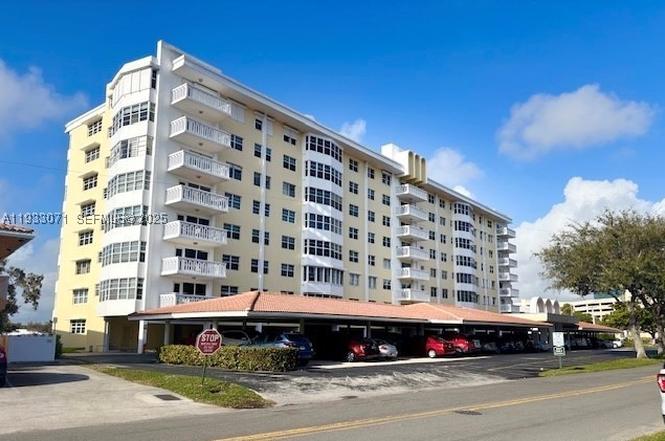
2500 NE 48th Ln #507 · Fort Lauderdale, FL
Flood risk 4/10 · Minor
- FEMA flood zone
- X (unshaded)
- Chance of flooding over 30 yrs
- 0.13%
- Est. flood insurance / yr
- $507 – $1,088
Fire risk 1/10 · Minimal
- Est. fire insurance / yr
- $947 – $1,759
Heat risk 10/10 · Severe
- Hot days now (above 105°F)
- 7 days/yr
- Hot days in 30 yrs
- 26 days/yr
Wind risk 10/10 · Severe
- Chance of severe wind over 30 yrs
- 99.0%
Air-quality risk 2/10 · Minimal
- Unhealthy air days now
- 1 days/yr
- Unhealthy air days in 30 yrs
- 2 days/yr
Risk factors via First Street. Map © Google.
Why this score? — see what drove the C- grade
The composite is a weighted blend of 9 inputs, each scored 0–100. Each bar is that input's sub-score; the figure is the points it added to the 100-point composite (weight × sub-score).
- Cash flow +18.4/30.0
- 1% rule +8.6/10.0
- ARV discount +7.5/15.0
- DSCR +5.8/10.0
- Schools +4.1/10.0
- Livability +4.1/5.0
- Rent growth +3.4/5.0
- Condition / age +2.5/5.0
- Appreciation +0.0/10.0
$289,000
🖨 Deal sheet 📄 Offer letter ✓ Due diligence
Listing remarks
Welcome to Country Club Towers, a peaceful and sought-after condominium complex in Coral Ridge. This beautiful 1,276 sq ft, 2-bed, 2-bath unit offers breathtaking 5th-floor views of Coral Ridge Country Club golf course and is just one mile from Lauderdale-by-the-Sea. The building has passed its 40-and 50-year inspections with no pending assessments and has FULLY FUNDED RESERVES. Amenities include modernized elevators, washer/dryer rooms on each floor, a pool with golf course views, 24-hour security cameras, secure entry, and on-site management. New impact windows, one covered parking space with overflow parking available. Walking distance to Holy Cross Hospital, dining, shopping, and the be
Key facts
- Breathtaking views
- Washer dryer rooms
- Secure entry
Tags
Property features AI
Finance
- Other: Association pool (heated); Association-managed amenities
- Financial info: Pets allowed (conditional; restrictions may apply)
- HOA & community: Monthly association fee; Association fee covers management, common areas, cable TV, laundry, grounds maintenance, structure maintenance, pest control, pool(s), reserve fund, sewer, security, trash and water; Community amenities include community kitchen, hobby room, laundry, library, pool, storage, trash service, vehicle wash area and elevators
Exterior
- Parking: Detached garage (1 space); Assigned parking; Guest parking; One covered space
- Security: Closed-circuit cameras; Lobby secured; Phone entry; Smoke detectors
- Utilities: Cable available; Electric service with fuses
- Home design: Condominium (attached); North-facing; Entry on 5th level; 8-story building
- Construction: Block construction; Resale property
- Exterior features: Courtyard; On golf course; Waterfront; Exterior lighting; Security/high impact doors
Interior
- Kitchen: Dishwasher; Electric range; Refrigerator
- Bedrooms: Bedroom on main level
- Flooring: Carpet; Tile
- Bathrooms: 2 full bathrooms
- Heating & cooling: Central heating; Central air conditioning; Ceiling fan(s)
- Interior features: Impact glass windows; Living/Dining room; Main living area on entry level
- Laundry & utility: Common area laundry; Electric water heater
Neighborhood map
What this means for you Summary
Snapshot
- This is a 2-bed/2.0-bath condo listed at $289k.
Deal economics
- At list price, monthly cash flow is $270 ($3k/yr) — positive.
- The deal already cash-flows at list — no discount required.
- Meets the 1% rule at list price ($4k rent vs $289k).
- Recommended offer: $254k (12.0% below list) — sets the bar for market timing.
- Cap rate 7.4% vs local median 2.2% in Fort Lauderdale — top-decile yield for the area; either an underpriced asset or a hidden risk that comps aren't pricing in. Stress-test before assuming the spread holds.
Location & tenants
- Location reads 82/100 on livability (#78 in FL, #1,293 nationally) — a professional / high-income tenant draw. Strengths: crime A+, amenities A+, health & safety A+; Watch: cost of living D-.
- Broward (suburban): math 42% / reading 53% proficiency, ranked #46 of 73 in FL (top 63%) — families likely to look elsewhere, expect single-tenant / working-renter base with shorter leases.
- Market conditions: Rents rising (+3.6%/yr); 739 active listings in the ZIP; 40 comparable units currently listed for rent nearby; rentals at typical pace (median 22d on market — plan ~3-4 weeks tenant-placement turnaround); solid renter incomes; 2,111 units permitted in Broward County in 2024 (1,265 in 5+ unit buildings).
- At $3,919/mo this rent would consume 50% of the median local household income ($94k/yr) (locally 912% of renters already pay >50% of income on rent) — very limited rent-growth headroom before tenants either downsize or default.
Forward outlook
- Local home prices are declining (-3.0%/yr); year-one equity from $2k of loan paydown is wiped out by about $9k of value loss. Plan a longer hold.
- Broward County population projected at +34% by 2050 — long-run rental-demand tailwind backs the buy-and-hold thesis.
Negotiation context
- It's been on market 182 days — a 12% lower offer ($254k) is reasonable based on typical stale-listing flexibility.
- Current owner paid $88k; list at $289k implies a 228% gain — meaningful room to come down on a strong offer.
Risks & watch-outs
- Watch-outs: HOA is 26% of rent.
- Climate carrying-cost: severe wind risk, 99% chance of damaging wind over 30y; extreme-heat days projected 7→26/yr by 2055 (HVAC capex compounding) — expect insurance premiums to compound above CPI over the hold.
Questions for the listing agent
- It's been on market 182 days. Have you received any prior offers? Is the seller open to a 12% concession, seller financing, or rate buy-down credit?
- Built in 1975 — when were the roof, HVAC, electrical panel, plumbing, and water heater last replaced?
- What does the HOA fee cover, when was the last increase, and are there any pending special assessments or reserve-fund shortfalls?
- Any open or pending special assessments — roof, HVAC, plumbing, elevator, façade? What's the per-unit balance and payoff schedule, and is the seller paying it off at close or rolling it to the buyer?
- Why hasn't it sold? Are there any deal-killer items the seller is aware of (foundation, flood, title, zoning, code violations)?
- Is there a deadline driving the sale (1031 exchange, divorce, estate, relocation)? That informs how much negotiation room exists.
- Schools are B-rated — typically a magnet for longer-tenancy family renters. What's the average tenant stay here, and is there a school-zone premium baked into asking?
- What's the average days-on-market for RENTAL listings here right now (not sales)? A rising rental-DOM trend means longer vacancies and softer asking-rent achievability than the comps imply.
- What's the recent tenant-quality profile in this submarket — average credit score on applications, eviction rate, late-payment / NSF rate, and stable-employment percentage? A property-management company in the area should have these aggregated.
- How much new apartment / multifamily construction is in the pipeline within 1–3 miles? Heavy new supply (>2% of stock underway) typically softens rents 12–24 months out; light construction supports rent growth.
Investment metrics
- 1% rule
- 1.36% ✓
- Cap rate
- 7.41%
- Cash-on-cash
- 4.00%
- DSCR
- 1.18
- GRM
- 6.1
CMA / ARV
No comps found within radius.
Projected returns pro-forma
-3.0% appreciation · 3.63% rent growth · sell at horizon
- IRR
- -8.9%
- Equity multiple
- 0.67×
- Total profit
- $-26,573
- Equity at exit
- $43,091
- IRR
- 1.9%
- Equity multiple
- 1.14×
- Total profit
- $11,696
- Equity at exit
- $24,987
Cash invested: $80,920 (down + closing). Projections, not guarantees.
Landlord ↔ Tenant lean methodology
- Overall (STATE)
- 87 Strongly Landlord-Friendly
- State Florida
- 87 Strongly Landlord-Friendly · R+3
- County
- — inherits STATE
- City
- — inherits STATE
ZIP-level market 33308
- Rents YoY
- 3.6%
- Active inventory
- 739
- Price-to-rent
- 6.1×
Monthly cashflow live
- Estimated rent
- $3,919 high interval (Pro) →
- Mortgage (P&I)
- −$1,516
- Tax from tax record
- −$178 /mo · $2,142/yr
- Insurance
- −$120
- HOA est. from 8 same-building comps
- −$1,012
- Vacancy / Maint / Mgmt
- −$823
- Net cashflow
- $270
Break-even live
UW: 25.0% down · 7.5% · 30yr · 1.5% tax · 5.0% vac · 8.0% maint · 8.0% mgmt
Financing live
Cash to close
- Down payment
- $72,250
- Closing costs
- $8,670
- Reserves months
- —
- Total cash needed
- —
Loan-product check · same deal, 3 products live
Conventional
25% down · 7.5% · 30yr
- Down + closing
- —
- Monthly P&I
- —
- Monthly cashflow
- —
- DSCR
- —
- Eligible?
- —
Personal DTI + credit; lowest rate.
DSCR
20% down · 8.5% · 30yr
- Down + closing
- —
- Monthly P&I
- —
- Monthly cashflow
- —
- DSCR
- —
- Eligible?
- —
No personal income docs; deal must DSCR.
Hard money
10% down · 12.0% · 12mo
- Down + closing
- —
- Monthly P&I
- —
- Monthly cashflow
- —
- DSCR
- —
- Eligible?
- —
Short-term bridge; refi at stabilization.
Rent comps 40 comps
| Address | Beds | Baths | Sqft | Rent | $/sqft | DOM | Units | Dist |
|---|---|---|---|---|---|---|---|---|
| 4800 NE 25th Ave Apt N Fort Lauderdale, FL | 2.0 | 2.0 | 1800 | $3,200 | $1.78 | 21d | 1 | 0.05mi |
| 4800 NE 25th Ave Apt N Fort Lauderdale, FL | 2.0 | 2.0 | 1800 | $3,200 | $1.78 | 17d | 1 | 0.05mi |
| 4804 NE 21st Ave #4804 Fort Lauderdale, FL | 2.0 | 2.0 | 1400 | $4,500 | $3.21 | 24d | 1 | 0.21mi |
| 4800 Bayview Dr #303 Fort Lauderdale, FL | 2.0 | 2.0 | 1032 | $3,500 | $3.39 | 24d | 1 | 0.34mi |
| 2100 NE 45th St #1 Fort Lauderdale, FL | 3.0 | 3.5 | 1340 | $9,500 | $7.09 | 24d | 1 | 0.39mi |
| 3100 NE 48th St #908 Fort Lauderdale, FL | 2.0 | 2.0 | 1181 | $3,100 | $2.62 | 18d | 1 | 0.49mi |
| 3100 NE 48th St #908 Fort Lauderdale, FL | 2.0 | 2.0 | 1181 | $3,100 | $2.62 | 21d | 1 | 0.49mi |
| 3111 NE 51st St Unit 301 Fort Lauderdale, FL | 2.0 | 2.0 | 1300 | $3,800 | $2.92 | 24d | 1 | 0.52mi |
| 283 Imperial Ln Lauderdale by the Sea, FL | 3.0 | 2.5 | 1761 | $4,500 | $2.56 | 24d | 1 | 0.64mi |
| 4454 W Tradewinds Ave Lauderdale by the Sea, FL | 3.0 | 2.0 | 1808 | $4,700 | $2.60 | 18d | 1 | 0.74mi |
| 262 Bombay Ave Lauderdale by the Sea, FL | 2.0 | 3.0 | 1803 | $7,000 | $3.88 | 24d | 1 | 0.74mi |
| 2155 NE 56th Ct Fort Lauderdale, FL | 3.0 | 2.0 | 1500 | $3,500 | $2.33 | 24d | 1 | 0.77mi |
| 233 Commercial Blvd Unit 1541802P Lauderdale-By-The-Sea, FL | 2.0 | 2.0 | 1291 | $3,876 | $3.00 | 2d | 1 | 0.82mi |
| 4764 NE 15th Way Oakland Park, FL | 3.0 | 2.0 | 1218 | $3,500 | $2.87 | 24d | 1 | 0.86mi |
| 1575 NE 47th St Oakland Park, FL | 3.0 | 2.0 | 1358 | $3,700 | $2.72 | 24d | 1 | 0.86mi |
| 2010 NE 57th St Fort Lauderdale, FL | 3.0 | 2.0 | 1730 | $6,000 | $3.47 | 21d | 1 | 0.87mi |
| 4511 Seagrape Dr Lauderdale by the Sea, FL | 2.0 | 2.0 | 1218 | $3,500 | $2.87 | 24d | 1 | 0.90mi |
| 5200 NE 15th Ave Fort Lauderdale, FL | 3.0 | 2.0 | 1585 | $4,600 | $2.90 | 24d | 1 | 0.94mi |
| 5790 NE 20th Ter Fort Lauderdale, FL | 3.0 | 2.0 | 1874 | $6,000 | $3.20 | 24d | 1 | 0.99mi |
| 4144 El Mar Dr Unit 1 Lauderdale-By-The-Sea, FL | 2.0 | 2.0 | 1116 | $3,250 | $2.91 | 24d | 1 | 1.01mi |
| 4280 Galt Ocean Dr Fort Lauderdale, FL | 1.0–3.0 | 1.5–2.5 | 2025 | $6,250 | $3.09 | 2d | 5 | 1.01mi |
| 4280 Galt Ocean Dr Fort Lauderdale, FL | 1.0–3.0 | 2.0–2.5 | 2025 | $6,000 | $2.96 | 17d | 5 | 1.01mi |
| 4280 Galt Ocean Dr Fort Lauderdale, FL | 1.0–3.0 | 1.5–2.5 | 2025 | $6,250 | $3.09 | 4d | 5 | 1.01mi |
| 4280 Galt Ocean Dr Fort Lauderdale, FL | 1.0–3.0 | 2.0–2.5 | 2025 | $6,000 | $2.96 | 21d | 5 | 1.01mi |
| 4280 Galt Ocean Dr Fort Lauderdale, FL | 2.0–3.0 | 2.0–2.5 | 2125 | $6,000 | $2.82 | 5d | 4 | 1.01mi |
| 5910 NE 21st Way Fort Lauderdale, FL | 3.0 | 2.0 | 1823 | $4,950 | $2.72 | 21d | 1 | 1.02mi |
| 4445 El Mar Dr Unit 303 Lauderdale-By-The-Sea, FL | 2.0 | 2.5 | 1672 | $7,000 | $4.19 | 24d | 1 | 1.04mi |
| 4445 El Mar Dr #2311 Lauderdale by the Sea, FL | 2.0 | 2.5 | 1791 | $5,850 | $3.27 | 7d | 1 | 1.04mi |
| 4619 Poinciana St Unit 2A Lauderdale by the Sea, FL | 3.0 | 2.5 | 1452 | $3,900 | $2.69 | 15d | 1 | 1.05mi |
| 4250 Galt Ocean Dr Fort Lauderdale, FL | 2.0 | 2.0 | 1350 | $3,650 | $2.70 | 1d | 2 | 1.05mi |
| 4240 Galt Ocean Dr #1006 Fort Lauderdale, FL | 3.0 | 2.0 | 1836 | $6,000 | $3.27 | 24d | 1 | 1.06mi |
| 4100 Galt Ocean Dr Fort Lauderdale, FL | 2.0–3.0 | 2.0–2.5 | 2295 | $3,500 | $1.53 | 11d | 1 | 1.08mi |
| 4444 El Mar Dr #3305 Lauderdale by the Sea, FL | 2.0 | 2.5 | 1515 | $7,000 | $4.62 | 24d | 1 | 1.09mi |
| 4444 El Mar Dr #3404 Lauderdale by the Sea, FL | 2.0 | 2.0 | 1256 | $6,200 | $4.94 | 24d | 1 | 1.09mi |
| 2169 Imperial Point Dr Fort Lauderdale, FL | 2.0 | 2.0 | 1300 | $4,200 | $3.23 | 24d | 1 | 1.10mi |
| 3605 NE 32nd Ave Unit 209A Fort Lauderdale, FL | 2.0 | 2.0 | 1000 | $3,300 | $3.30 | 1d | 1 | 1.10mi |
| 3605 NE 32nd Ave Unit 209A Fort Lauderdale, FL | 2.0 | 2.0 | 1000 | $3,300 | $3.30 | 19d | 1 | 1.10mi |
| 4540 N Ocean Dr #210 Lauderdale by the Sea, FL | 2.0 | 2.0 | 1450 | $5,500 | $3.79 | 24d | 1 | 1.11mi |
| 4020 Galt Ocean Dr Fort Lauderdale, FL | 1.0–2.0 | 1.0–2.0 | 1553 | $8,750 | $5.63 | 4d | 6 | 1.13mi |
| 4020 Galt Ocean Dr Fort Lauderdale, FL | 1.0–2.0 | 1.0–2.0 | 1536 | $8,750 | $5.69 | 4d | 7 | 1.13mi |
HOA detail condo
- Monthly dues
- $0 · $0/yr
- Likely covers
- poolsecurity
- Assessments
- None detected in remarks — confirm with the listing agent.
Listing history 16 events
-
2026-06-18days on market $289,000 Active 182 DOM
-
2026-06-17days on market $289,000 Active 181 DOM
-
2026-06-16days on market $289,000 Active 180 DOM
-
2026-06-15days on market $289,000 Active 179 DOM
-
2026-06-13days on market $289,000 Active 177 DOM
-
2026-06-09days on market $289,000 Active 173 DOM
-
2026-06-07days on market $289,000 Active 171 DOM
-
2026-06-04days on market $289,000 Active 168 DOM
-
2026-06-03days on market $289,000 Active 167 DOM
-
2026-06-02days on market $289,000 Active 166 DOM
-
2026-06-01days on market $289,000 Active 165 DOM
-
2026-05-31days on market $289,000 Active 164 DOM
-
2026-04-06price $289,000
-
2025-12-18$309,000 Active
-
1998-10-14soldstatus $88,000
-
1985-10-01soldstatus $79,500
ⓘ Source: listings_history table (triggers on properties + properties_extension) + one-shot
backfill from property_details.listing_events for pre-trigger history.
Tax reassessment forecast FL · Resets to sale price
- Current annual tax
- $2,142 · $178/mo
- Projected year-2 tax
- $2,399 · $200/mo
- Expected delta
- +$257/yr (+$21/mo · 12.0%)
ⓘ Screening estimate from a state-policy table — verify with the county assessor before closing.
Climate risk First Street
- Flood 4/10 Moderate FEMA zone X (unshaded) · 13% chance over 30 yrs
- Wildfire 1/10 Low
- Heat 10/10 Extreme 7 d/yr ≥105°F today · 26 d/yr by 30 yrs out
- Wind 10/10 Extreme 99% chance of damaging wind over 30 yrs
- Air quality 2/10 Low 1 unhealthy d/yr today · 2 by 30 yrs out
Nearby sold comps map
Loading sold comps map…
Walkable amenities ~0.75 mi
Loading nearby amenities…
Taxation est. · year 1
- Rental income
- $47,033
- − Mortgage interest
- −$16,188
- − Property taxes
- −$2,142
- − Insurance
- −$1,445
- − Repairs & maintenance
- −$3,763
- − Management
- −$3,763
- − HOA
- −$12,144
- − Depreciation
- −$8,407
- Taxable loss
- −$819
- Est. tax savings @ 24.0%
- +$197
- After-tax cash flow
- $3,435/yr
For passive investors: Depreciation is non-cash, so a rental often shows a tax loss while cash-flowing — sheltering income. Rental losses are passive: they offset passive income freely, and up to $25,000/yr can offset ordinary (W-2) income if you actively participate and your MAGI is under $100k (phasing out to $0 by $150k); unused losses carry forward. On sale, claimed depreciation is recaptured at up to 25%, and gains may owe capital-gains tax (a 1031 exchange can defer both). Figures are a year-1 estimate at your 24.0% rate — not tax advice; consult a CPA.
Schools (NCES district)
- District
- Broward
- NCES district ID
- 1200180
- Math proficiency
- 42% ▼ -18.00%
- Reading proficiency
- 53% ▼ -5.00%
- Median HH income
- $52,139
- Composite
- 40.88/100
- National rank
- #3621
- State rank
- #46 of 73 in FL
Livability — Fort Lauderdale
- Score
- 82/100
- State rank
- #78
- US rank
- #1293
Category grades
Schools grade is shown separately in the Schools card above.
Census & demographics
- Census place
- Fort Lauderdale, FL
- County
- Broward County · 1,963,430 people
- City population
- 235,769
- Metro
- Miami-Fort Lauderdale-Pompano Beach, FL
- Population (ZIP)
- 27,935
- Household income
- $93,879
- Rent vs Own
- Severe rent burden
- 912.0
Population outlook (Broward County) Hauer SSP2
- Today (2025)
- 2,207,033 people
- By 2030
- 2,360,704 · +7.0%
- By 2040
- 2,661,208 · +20.6%
- By 2050
- 2,946,698 · +33.5%
- By 2075
- 3,602,273 · +63.2%
- By 2100
- 3,970,984 · +79.9%
Race, ethnicity, and origin ACS 2023
- Neighborhood character
- Predominantly White (75%)
- Race & ethnicity
- White 75% Hispanic / Latino 16% Two or more races 14% Asian 3% Black 2%
- Hispanic origin (detail)
- Puerto Rican 2% Cuban 3%
- Common ancestry
- Romanian 4% Lithuanian 3% Scotch-Irish 3%
- Foreign-born
- 24% · Canada, Jamaica, Dominican Republic
- Languages at home
- 75% English-only · Spanish 14% Other Indo-European 5% Russian/Polish/Slavic 2%
Political lean MEDSL · Broward
- 2024 margin
- D (+17.0) · D 58.0% · R 41.0%
- 2008→2024 swing
- -17.8pp toward R · 2008: 34.7pp · 2024: 17.0pp
- All cycles
- 2024: D+17.0 2020: D+29.8 2016: D+35.0 2012: D+34.9 2008: D+34.7
Not yet ingested
- Civics
- —
Market trends
- HPI YoY
- ▼ -417.95%
- Current HPI
- 325.3902
- Rent YoY
- ▲ 3.63%
- Metro
- Miami-Fort Lauderdale-Pompano Beach, FL
- State GDP YoY
- ▲ 3.28%
- F500 in state
- 36
Industry mix (Fortune 500 HQ in FL)
| Industry | F500 HQs | Revenue |
|---|---|---|
| Industrial Technology | 2 | $29B |
|
||
| Insurance | 2 | $17B |
|
||
| Retail | 1 | $60B |
|
||
| Technology Distribution | 1 | $58B |
|
||
| Homebuilding | 1 | $35B |
|
||
| Technology Manufacturing | 1 | $35B |
|
||
Price history
+263.5% since first listed4 events — show timeline
- 2026-04-06 Price Changed $289,000 MARMLS
- 2025-12-18 Listed $309,000 MARMLS
- 1998-10-14 Sold (Public Records) $88,000 Public Records
- 1985-10-01 Sold (Public Records) $79,500 Public Records
Property tax history
+3.3%/yrLatest (2025): $2,142 · +7.1% YoY. Source: county tax records.
Cash-flow waterfall
monthlySold comps — $/sqft
last 12 mo · ≤1 miLoading sold comps…