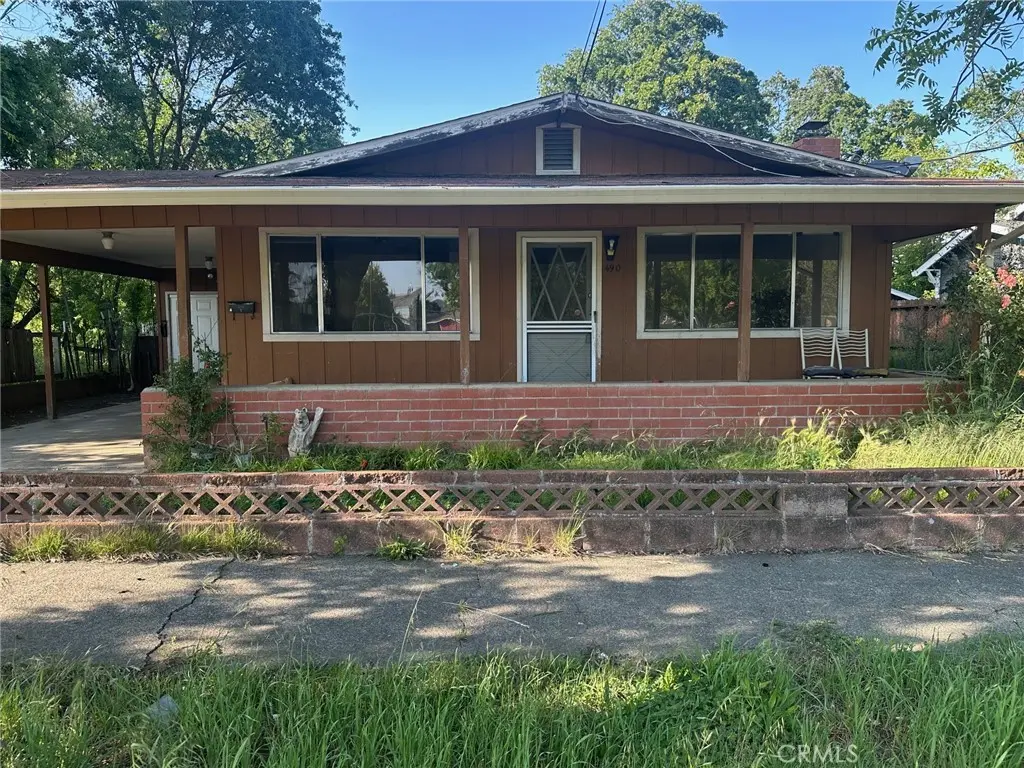
490 Martin St · Lakeport, CA
Flood risk 1/10 · Minimal
- FEMA flood zone
- AO
- Chance of flooding over 30 yrs
- 0.0%
- Est. flood insurance / yr
- $848 – $2,087
Fire risk 8/10 · Major
- Est. fire insurance / yr
- $659 – $1,223
Heat risk 6/10 · Moderate
- Hot days now (above 103°F)
- 7 days/yr
- Hot days in 30 yrs
- 14 days/yr
Wind risk 1/10 · Minimal
- Chance of severe wind over 30 yrs
- —
Air-quality risk 10/10 · Severe
- Unhealthy air days now
- 28 days/yr
- Unhealthy air days in 30 yrs
- 29 days/yr
Risk factors via First Street. Map © Google.
Why this score? — see what drove the C+ grade
The composite is a weighted blend of 9 inputs, each scored 0–100. Each bar is that input's sub-score; the figure is the points it added to the 100-point composite (weight × sub-score).
- Cash flow +23.4/30.0
- ARV discount +15.0/15.0
- DSCR +7.5/10.0
- 1% rule +5.4/10.0
- Livability +2.7/5.0
- Rent growth +2.5/5.0
- Condition / age +2.5/5.0
- Schools +1.9/10.0
- Appreciation +0.0/10.0
$217,000
🖨 Deal sheet 📄 Offer letter ✓ Due diligence
Listing remarks
Great opportunity for a fixer upper! This single story home features 3 bedrooms and 2 bathrooms on a spacious lot, with a well designed floor plan full of potential. With a bit of creativity and vision, you can truly make this home shine again. Living room features a large window and fireplace. The spacious kitchen offers ample room, a double sink, and direct access to the carport. Enjoy relaxing on the covered porch with your favorite drink. The back yard includes a detached, oversized one car garage. Lots of back yard space to entertain family and friends. Enjoy the convenience of walking to downtown, parks and the lake, along with access to fantastic local amenities like boating, fishing
Key facts
- 0.24 acre lot
- Garage
- Built 1966
Property features AI
Finance
- Other: No accessory dwelling unit (ADU); No common walls (detached); Total units: 1
- HOA & community: Community offers biking, fishing, and lake access
Exterior
- Parking: Carport (attached); One covered parking space; One garage space listed
- Utilities: Public sewer; Public/District water; Electricity connected
- Home design: Single-family house; Single-story (1 story); Entry on front
- Construction: Fixer condition; Year built per public records
- Exterior features: Front porch; Back yard; No pool; Has view
Interior
- Kitchen: Refrigerator; Electric oven; Dishwasher; Eating area in kitchen
- Bedrooms: Three main-level bedrooms
- Flooring: Carpet; Laminate
- Bathrooms: Two full bathrooms (both on main level)
- Heating & cooling: Electric heating; Wall/window cooling units
- Interior features: One-level layout with front entry; Family room with fireplace; Kitchen and family room included among room types; Bathtub in bathroom(s)
- Laundry & utility: Laundry located in carport
Neighborhood map
What this means for you Summary
Snapshot
- This is a 3-bed/1.5-bath single-family listed at $217k.
Deal economics
- At list price, monthly cash flow is $280 ($3k/yr) — positive.
- The deal already cash-flows at list — no discount required.
- Meets the 1% rule at list price ($2k rent vs $217k).
- Recommended offer: $210k (3.0% below list) — sets the bar for market timing.
- Cap rate 8.5% vs local median 3.3% in Lakeport — top-decile yield for the area; either an underpriced asset or a hidden risk that comps aren't pricing in. Stress-test before assuming the spread holds.
Location & tenants
- Location reads 54/100 on livability (#925 in CA) — a working-class tenant base; expect higher turnover. Strengths: housing A; Watch: health & safety C-, schools D+, employment D+.
- Lakeport Unified (town): math 13% / reading 30% proficiency, ranked #451 of 517 in CA (top 87%) — low school quality limits family demand, transient renter base, plan for 1-2y turnover.
- Market conditions: 148 active listings in the ZIP; 4 comparable units currently listed for rent nearby; rentals lingering (median 44d on market — plan ~5-8 weeks vacancy on turnover, expect pricing pressure); 100% of comp listings sitting > 30 days — soft ceiling on asking rent; 107 units permitted in Lake County in 2024 (40 in 5+ unit buildings).
- This rent runs 38% of the median local income ($71k/yr) — at the standard rent-burdened threshold; future hikes will face affordability resistance.
Forward outlook
- Local home prices are declining (-3.0%/yr); year-one equity from $2k of loan paydown is wiped out by about $7k of value loss. Plan a longer hold.
- Lake County population projected at -15% by 2050 — secular population decline; favor cash flow + early exit over multi-decade hold.
Negotiation context
- It's been on market 43 days — a 3% lower offer ($210k) is reasonable based on typical stale-listing flexibility.
- 2 sale attempts with the ask held roughly flat each time — persistent listings suggest the price (not the market) is what's stuck; bring a comps-based counter.
- Current owner paid $75k; list at $217k implies a 189% gain — meaningful room to come down on a strong offer.
Risks & watch-outs
- Watch-outs: flood insurance adds $122/mo.
- Climate carrying-cost: in FEMA flood zone AO (mandatory federal flood insurance); severe wildfire risk; extreme-heat days projected 7→14/yr by 2055 (HVAC capex compounding) — expect insurance premiums to compound above CPI over the hold.
Questions for the listing agent
- It's been on market 43 days. Have you received any prior offers? Is the seller open to a 3% concession, seller financing, or rate buy-down credit?
- Built in 1966 — when were the roof, HVAC, electrical panel, plumbing, and water heater last replaced?
- What's the actual annual flood-insurance premium (NFIP or private), and is the property in a SFHA with mandatory coverage?
- Is there a deadline driving the sale (1031 exchange, divorce, estate, relocation)? That informs how much negotiation room exists.
- Schools are D-rated, which usually means shorter tenancies and higher turnover. Who's the typical renter profile here, and what's been the actual vacancy rate?
- Crime grade is F in this area — have there been break-ins, vandalism, or insurance claims at this property in the last 3 years? What carrier currently insures it and at what premium?
- What's the average days-on-market for RENTAL listings here right now (not sales)? A rising rental-DOM trend means longer vacancies and softer asking-rent achievability than the comps imply.
- What's the recent tenant-quality profile in this submarket — average credit score on applications, eviction rate, late-payment / NSF rate, and stable-employment percentage? A property-management company in the area should have these aggregated.
- How much new for-sale + rental construction is in the pipeline within 1–3 miles? Heavy new supply typically softens prices + rents 12–24 months out; constrained supply supports both.
Investment metrics
- 1% rule
- 1.04% ✓
- Cap rate
- 8.52%
- Cash-on-cash
- 7.94%
- DSCR
- 1.35
- GRM
- 8.0
CMA / ARV
- ARV (median comp)
- $337,125
- List price
- $217,000
- Delta
- -35.63%
- Verdict
- UNDERPRICED
- Comps
- 20 within 1.0 mi
Show comp detail 12 sales within ~0.75 mi
| Address | Dist | Beds/Ba | Sqft | Sold | Price | $/sf | Match |
|---|---|---|---|---|---|---|---|
| 355 1st St | 0.12mi | 3/2.0 | 1,349 (+9%) | 1mo | $375,000 | $278 | 78 |
| 325 S Forbes | 0.13mi | 3/1.0 | 1,365 (+10%) | 1mo | $357,000 | $262 | 75 |
| 145 N Brush St | 0.16mi | 3/2.0 | 1,156 (-7%) | 12mo | $297,750 | $258 | 69 |
| 944 First St | 0.28mi | 4/1.5 (+1) | 1,196 (-4%) | 10mo | $339,000 | $283 | 68 |
| 1150 North St | 0.61mi | 3/2.0 | 1,254 (+1%) | 1mo | $355,000 | $283 | 67 |
| 730 Sixth St | 0.41mi | 3/2.0 | 1,222 (-2%) | 13mo | $326,000 | $267 | 66 |
| 435 Armstrong St | 0.04mi | 2/2.0 (-1) | 1,086 (-13%) | 8mo | $334,000 | $308 | 63 |
| 305 N Brush | 0.25mi | 2/1.0 (-1) | 1,085 (-13%) | 4mo | $289,000 | $266 | 58 |
| 977 Sixth St | 0.47mi | 2/2.0 (-1) | 1,326 (+7%) | 7mo | $300,000 | $226 | 54 |
| 659 14th St | 0.71mi | 3/1.5 | 1,204 (-3%) | 13mo | $336,600 | $280 | 51 |
| 625 10th St | 0.53mi | 2/1.0 (-1) | 1,140 (-8%) | 8mo | $217,000 | $190 | 48 |
| 710 Clearlake Ave | 0.67mi | 3/2.0 | 1,123 (-10%) | 8mo | $355,000 | $316 | 44 |
Match score weights: distance 35% · size 25% · config 20% · recency 20%. Top-matched comps best support the ARV.
Projected returns pro-forma
-3.0% appreciation · 3.0% rent growth · sell at horizon
- IRR
- -7.7%
- Equity multiple
- 0.72×
- Total profit
- $-17,303
- Equity at exit
- $32,355
- IRR
- 1.9%
- Equity multiple
- 1.13×
- Total profit
- $8,029
- Equity at exit
- $18,762
Cash invested: $60,760 (down + closing). Projections, not guarantees.
Landlord ↔ Tenant lean methodology
- Overall (STATE)
- 18 Strongly Tenant-Friendly
- State California
- 18 Strongly Tenant-Friendly · D+13
- County
- — inherits STATE
- City
- — inherits STATE
ZIP-level market 95453
- Active inventory
- 148
- Price-to-rent
- 8.0×
Monthly cashflow live
- Estimated rent
- $2,256 medium interval (Pro) →
- Mortgage (P&I)
- −$1,138
- Tax from tax record
- −$152 /mo · $1,819/yr
- Insurance
- −$90
- Flood insurance flood zone
- −$122 /mo · $1,468/yr
- HOA
- −$0
- Vacancy / Maint / Mgmt
- −$474
- Net cashflow
- $280
Break-even live
UW: 25.0% down · 7.5% · 30yr · 1.5% tax · 5.0% vac · 8.0% maint · 8.0% mgmt
Financing live
Cash to close
- Down payment
- $54,250
- Closing costs
- $6,510
- Reserves months
- —
- Total cash needed
- —
Loan-product check · same deal, 3 products live
Conventional
25% down · 7.5% · 30yr
- Down + closing
- —
- Monthly P&I
- —
- Monthly cashflow
- —
- DSCR
- —
- Eligible?
- —
Personal DTI + credit; lowest rate.
DSCR
20% down · 8.5% · 30yr
- Down + closing
- —
- Monthly P&I
- —
- Monthly cashflow
- —
- DSCR
- —
- Eligible?
- —
No personal income docs; deal must DSCR.
Hard money
10% down · 12.0% · 12mo
- Down + closing
- —
- Monthly P&I
- —
- Monthly cashflow
- —
- DSCR
- —
- Eligible?
- —
Short-term bridge; refi at stabilization.
Rent comps 4 comps
| Address | Beds | Baths | Sqft | Rent | $/sqft | DOM | Units | Dist |
|---|---|---|---|---|---|---|---|---|
| 10 Royale Ave Lakeport, CA | 2.0–3.0 | 2.0 | 1475 | $2,195 | $1.49 | 43d | 3 | 0.57mi |
| 10 Royale Ave #21 Lakeport, CA | 2.0 | 2.0 | 1225 | $2,195 | $1.79 | 43d | 1 | 0.57mi |
| 10 Royale Ave #17 Lakeport, CA | 2.0 | 2.0 | 1221 | $2,100 | $1.72 | 43d | 1 | 0.57mi |
| 300 Grace Ln Lakeport, CA | 2.0 | 2.0 | 1200 | $2,500 | $2.08 | 43d | 1 | 0.71mi |
Listing history 18 events
-
2026-06-18days on market $217,000 Active 43 DOM
-
2026-06-17days on market $217,000 Active 42 DOM
-
2026-06-16days on market $217,000 Active 41 DOM
-
2026-06-15days on market $217,000 Active 40 DOM
-
2026-06-14days on market $217,000 Active 38 DOM
-
2026-06-12statusdays on market $217,000 Active 37 DOM
-
2026-06-09days on market $217,000 Active Under Contract 34 DOM
-
2026-06-08days on market $217,000 Active Under Contract 33 DOM
-
2026-06-07days on market $217,000 Active Under Contract 32 DOM
-
2026-06-05days on market $217,000 Active Under Contract 29 DOM
-
2026-06-03days on market $217,000 Active Under Contract 28 DOM
-
2026-06-02days on market $217,000 Active Under Contract 27 DOM
-
2026-06-01days on market $217,000 Active Under Contract 26 DOM
-
2026-05-31days on market $217,000 Active Under Contract 25 DOM
-
2026-05-30days on market $217,000 Active Under Contract 24 DOM
-
2026-05-17historical Active Under Contract 767-char remark
-
2026-05-06$217,000 Active 767-char remark
-
1989-08-02soldstatus $75,000
ⓘ Source: listings_history table (triggers on properties + properties_extension) + one-shot
backfill from property_details.listing_events for pre-trigger history.
Tax reassessment forecast CA · Resets to sale price
- Current annual tax
- $1,819 · $152/mo
- Projected year-2 tax
- $1,819 · $152/mo
- Expected delta
- $0/yr ($0/mo · 0.0%)
ⓘ Screening estimate from a state-policy table — verify with the county assessor before closing.
Climate risk First Street
- Flood 1/10 Low FEMA zone AO · 0% chance over 30 yrs
- Wildfire 8/10 Severe
- Heat 6/10 Major 7 d/yr ≥103°F today · 14 d/yr by 30 yrs out
- Wind 1/10 Low
- Air quality 10/10 Extreme 28 unhealthy d/yr today · 29 by 30 yrs out
Nearby sold comps map
Loading sold comps map…
Walkable amenities ~0.75 mi
Loading nearby amenities…
Taxation est. · year 1
- Rental income
- $27,070
- − Mortgage interest
- −$12,155
- − Property taxes
- −$1,819
- − Insurance
- −$2,552
- − Repairs & maintenance
- −$2,166
- − Management
- −$2,166
- − Depreciation
- −$6,313
- Taxable loss
- −$101
- Est. tax savings @ 24.0%
- +$24
- After-tax cash flow
- $3,382/yr
For passive investors: Depreciation is non-cash, so a rental often shows a tax loss while cash-flowing — sheltering income. Rental losses are passive: they offset passive income freely, and up to $25,000/yr can offset ordinary (W-2) income if you actively participate and your MAGI is under $100k (phasing out to $0 by $150k); unused losses carry forward. On sale, claimed depreciation is recaptured at up to 25%, and gains may owe capital-gains tax (a 1031 exchange can defer both). Figures are a year-1 estimate at your 24.0% rate — not tax advice; consult a CPA.
Schools (NCES district)
- District
- Lakeport Unified
- NCES district ID
- 0620670
- Math proficiency
- 13% ▼ -8.00%
- Reading proficiency
- 30% ▲ 1.00%
- Median HH income
- $44,332
- Composite
- 18.55/100
- National rank
- #8912
- State rank
- #451 of 517 in CA
Livability — Lakeport
- Score
- 54/100
- State rank
- #925
- US rank
- #24236
Category grades
Schools grade is shown separately in the Schools card above.
Census & demographics
- Census place
- Lakeport, CA
- County
- Lake County · 24,333 people
- City population
- 11,741
- Metro
- Clearlake, CA
- Population (ZIP)
- 11,741
- Household income
- $71,419
- Rent vs Own
- Severe rent burden
- 250.0
Population outlook (Lake County) Hauer SSP2
- Today (2025)
- 62,396 people
- By 2030
- 60,626 · -2.8%
- By 2040
- 56,453 · -9.5%
- By 2050
- 53,054 · -15.0%
- By 2075
- 47,663 · -23.6%
- By 2100
- 41,804 · -33.0%
Race, ethnicity, and origin ACS 2023
- Neighborhood character
- Predominantly White (74%)
- Race & ethnicity
- White 74% Hispanic / Latino 14% Two or more races 9% Native American 5% Asian 1%
- Hispanic origin (detail)
- Mexican 10%
- Common ancestry
- Italian 3% Slovak 3% Romanian 2%
- Foreign-born
- 6% · Canada
- Languages at home
- 89% English-only · Spanish 9% Other Indo-European 1%
Political lean MEDSL · Lake
- 2024 margin
- Toss-up / Even · D 47.8% · R 49.2% · Other 3.0%
- 2008→2024 swing
- -20.6pp toward R · 2008: 19.3pp · 2024: -1.4pp
- All cycles
- 2024: R+1.4 2020: D+6.3 2016: D+3.7 2012: D+16.5 2008: D+19.3
Not yet ingested
- Civics
- —
Market trends
- HPI YoY
- ▼ -176.01%
- Current HPI
- 155.5391
- Rent YoY
- —
- Metro
- Clearlake, CA
- State GDP YoY
- ▲ 3.21%
- F500 in state
- 116
Industry mix (Fortune 500 HQ in CA)
| Industry | F500 HQs | Revenue |
|---|---|---|
| Technology | 27 | $1,492B |
|
||
| Financial Services | 3 | $174B |
|
||
| Retail | 3 | $44B |
|
||
| Insurance | 3 | $26B |
|
||
| Media / Entertainment | 2 | $115B |
|
||
| Pharmaceuticals / Biotech | 2 | $62B |
|
||
Price history
+189.3% since first listed5 events — show timeline
- 2026-06-18 Listing Removed — CRMLS
- 2026-06-11 Relisted — CRMLS
- 2026-05-17 Contingent — CRMLS
- 2026-05-06 Listed $217,000 CRMLS
- 1989-08-02 Sold (Public Records) $75,000 Public Records
Property tax history
+2.6%/yrLatest (2025): $1,819 · +2.4% YoY. Source: county tax records.
Cash-flow waterfall
monthlySold comps — $/sqft
last 12 mo · ≤1 miLoading sold comps…