 🏷️ Likely Rental
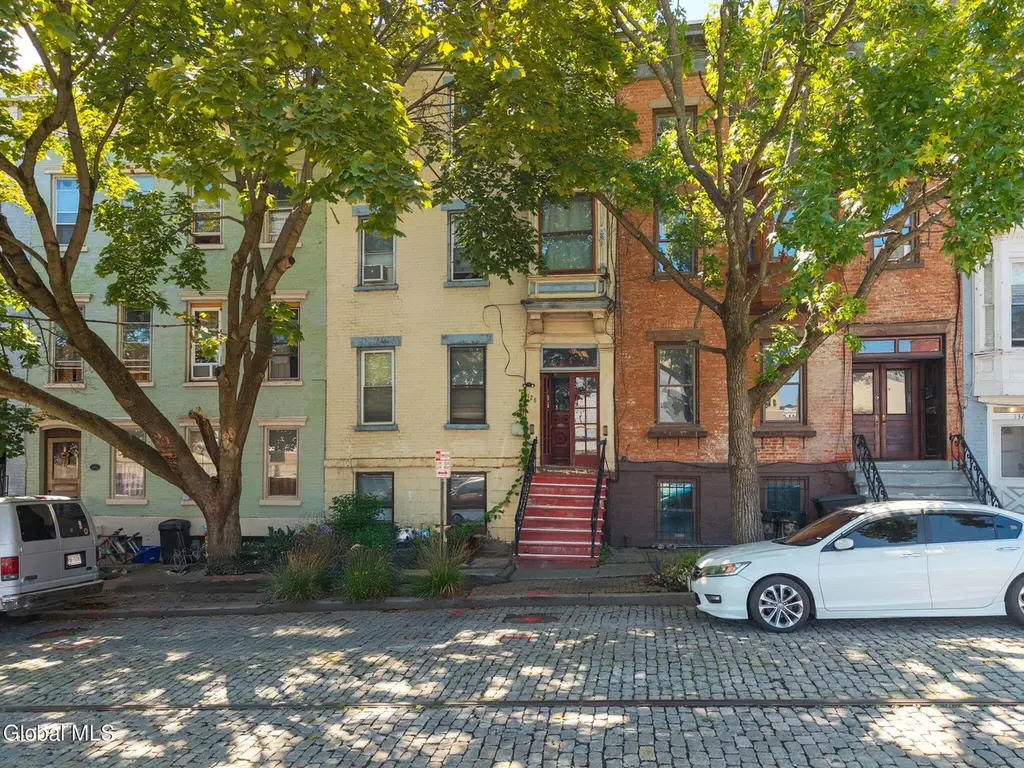
128 Hamilton St · Albany, NY
Flood risk 1/10 · Minimal
- FEMA flood zone
- X (unshaded)
- Chance of flooding over 30 yrs
- 0.0%
- Est. flood insurance / yr
- $473 – $860
Fire risk 1/10 · Minimal
- Est. fire insurance / yr
- $691 – $1,283
Heat risk 4/10 · Minor
- Hot days now (above 98°F)
- 7 days/yr
- Hot days in 30 yrs
- 17 days/yr
Wind risk 3/10 · Minor
- Chance of severe wind over 30 yrs
- 6.0%
Air-quality risk 1/10 · Minimal
- Unhealthy air days now
- 0 days/yr
- Unhealthy air days in 30 yrs
- 0 days/yr
Risk factors via First Street. Map © Google.
Why this score? — see what drove the A- grade
The composite is a weighted blend of 9 inputs, each scored 0–100. Each bar is that input's sub-score; the figure is the points it added to the 100-point composite (weight × sub-score).
- Cash flow +30.0/30.0
- ARV discount +15.0/15.0
- 1% rule +10.0/10.0
- DSCR +10.0/10.0
- Appreciation +5.0/10.0
- Rent growth +4.0/5.0
- Livability +4.0/5.0
- Schools +3.2/10.0
- Condition / age +2.5/5.0
$325,000
🖨 Deal sheet (PDF) 📄 Offer letter ✓ Due diligence
Multi-family units
County records classify this as Multi-Family (2-4 Unit). Listing-text estimate: 4 units. confirmed
Listing remarks
39-year owner with long term tenants makes for a great investment as projected rents could approach $5,500/month with garage rented separately. Priced well below other 4-unit properties and those with similar rent potential, especially with an oversized 2-car garage accessible from the yard or Van Zandt Street. Although some apartments are listed as 1 bedroom, the tenants have elected to use them as 2 bedrooms. Seller pays approximately $3,947.16 for utilities annually (2025). Close to MVP Arena, Empire State Plaza, Albany Capital Center, Cafe Capriccio and I-87. Property was under contract for a long period of time only to have the buyers financing fail at last minute.
Key facts
- Close to mvp arena
- 2,613 sq ft lot
- 2 garage spots
Tags
Neighborhood map
What this means for you Summary
Snapshot
- This is a 4 × 5-bed/4.0-bath units multifamily listed at $325k.
Deal economics
- At list price, monthly cash flow is $5k ($59k/yr) — positive. Per door: $1k/mo.
- The deal already cash-flows at list — no discount required.
- Meets the 1% rule at list price ($9k rent vs $325k).
- Recommended offer: $320k (1.5% below list) — sets the bar for market timing.
- Cap rate 24.6% vs local median 5.7% in Albany — top-decile yield for the area; either an underpriced asset or a hidden risk that comps aren't pricing in. Stress-test before assuming the spread holds.
Location & tenants
- Location reads 79/100 on livability (#129 in NY, #2,083 nationally) — a middle-class / working-renter tenant base. Strengths: amenities A+, commute A+, housing A+; Watch: employment C-, crime F.
- Albany City School District (urban): math 37% / reading 40% proficiency, ranked #543 of 590 in NY (top 92%) — families likely to look elsewhere, expect single-tenant / working-renter base with shorter leases; 66% free/reduced lunch — lower-income household profile, screen leases tightly.
- Zoned schools: Albany High School (math 74% / reading 67%, grade B+, #710 of 1,100 statewide, top 65%, 2,676 students, 69% FRL) — zoned schools at 69% FRL track the district average.
- Zoned-school proficiency averages 70% at this address vs 38% district-wide (+32 pts) — the actual schools serving this property are materially stronger than the Albany City School District average implies; a family-tenant draw the district grade alone would hide.
- Market conditions: Rents rising fast (+5.8%/yr); 5 active listings in the ZIP; 675 units permitted in Albany County in 2024 (451 in 5+ unit buildings).
Forward outlook
- In year one you build about $12k of equity ($2k loan paydown + $10k appreciation (3.0% local appreciation)).
- Albany County population projected at +9% by 2050 — modest demand growth; plan on rents tracking national, not racing it.
- At projected returns (3.0% appreciation + 5.8% rent growth), your $91k cash investment doubles in ~2 years — after that, you're playing with house money.
- By year 4, paydown + projected appreciation supports a ~$41k cash-out refi (75% LTV) — recoverable capital for the next deal without selling this one.
Negotiation context
- It's been on market 28 days — a 2% lower offer ($320k) is reasonable based on typical stale-listing flexibility.
- 4 sale attempts; this cycle's ask has dropped $300k (48%) from the opening price — seller is motivated, your offer sets the floor, not the list.
Risks & watch-outs
- Watch-outs: built in 1858 — expect roof / HVAC / electrical / plumbing capex.
Questions for the listing agent
- Can we see the unit-by-unit rent roll, current vacancy, and any below-market leases? What's the average tenancy length?
- What capital expenditures (roof, boiler, parking lot, exteriors) have been made in the last 5 years, and what's planned in the next 2?
- Built in 1858 — when were the roof, HVAC, electrical panel, plumbing, and water heater last replaced?
- Is there a deadline driving the sale (1031 exchange, divorce, estate, relocation)? That informs how much negotiation room exists.
- Crime grade is F in this area — have there been break-ins, vandalism, or insurance claims at this property in the last 3 years? What carrier currently insures it and at what premium?
- What's the average days-on-market for RENTAL listings here right now (not sales)? A rising rental-DOM trend means longer vacancies and softer asking-rent achievability than the comps imply.
- What's the recent tenant-quality profile in this submarket — average credit score on applications, eviction rate, late-payment / NSF rate, and stable-employment percentage? A property-management company in the area should have these aggregated.
- How much new apartment / multifamily construction is in the pipeline within 1–3 miles? Heavy new supply (>2% of stock underway) typically softens rents 12–24 months out; light construction supports rent growth.
Investment metrics
- 1% rule
- 2.87% ✓
- Cap rate
- 24.57%
- Cash-on-cash
- 65.27%
- DSCR
- 3.90
- GRM
- 2.9
CMA / ARV
- ARV (on-the-fly)
- $624,450
- Comps found
- 4
Show comp detail 4 sales within ~0.75 mi
| Address | Dist | Beds/Ba | Sqft | Sold | Price | $/sf | Match |
|---|---|---|---|---|---|---|---|
| 140 Jefferson St | 0.45mi | 7/4.0 (+1) | 5,420 (-0%) | 3mo | $625,000 | $115 | 67 |
| 11 Elm St | 0.09mi | 7/4.0 (+1) | 4,680 (-14%) | 13mo | $425,000 | $91 | 53 |
| 285 Lark St | 0.67mi | 6/5.0 | 5,196 (-4%) | 2mo | $445,000 | $86 | 52 |
| 324 Hudson Ave | 0.59mi | 6/7.0 | 4,940 (-9%) | 0mo | $739,000 | $150 | 41 |
Match score weights: distance 35% · size 25% · config 20% · recency 20%. Top-matched comps best support the ARV.
Projected returns pro-forma
3.0% appreciation · 5.83% rent growth · sell at horizon
- IRR
- 72.9%
- Equity multiple
- 5.20×
- Total profit
- $382,001
- Equity at exit
- $146,134
- IRR
- 73.4%
- Equity multiple
- 11.59×
- Total profit
- $963,869
- Equity at exit
- $225,210
Cash invested: $91,000 (down + closing). Projections, not guarantees.
Landlord ↔ Tenant lean methodology
- Overall (STATE)
- 15 Strongly Tenant-Friendly
- State New York
- 15 Strongly Tenant-Friendly · D+10
- County
- — inherits STATE
- City
- — inherits STATE
ZIP-level market 12207
- Rents YoY
- 5.8%
- Active inventory
- 5
- Price-to-rent
- 11.6×
Monthly cashflow live
- Estimated rent
- $9,340 high interval (Pro) →
- Mortgage (P&I)
- −$1,704
- Tax from tax record
- −$589 /mo · $7,070/yr
- Insurance
- −$135
- HOA
- −$0
- Vacancy / Maint / Mgmt
- −$1,961
- Net cashflow
- $4,950
Break-even live
Sensitivity live
| Price | -10% $5,134 | -5% $5,042 | +0% $4,950 | +5% $4,858 | +10% $4,766 |
|---|---|---|---|---|---|
| Rent | -10% $4,212 | -5% $4,581 | +0% $4,950 | +5% $5,319 | +10% $5,688 |
| Rate | -1.0pp $5,113 | -0.5pp $5,032 | base $4,950 | +0.5pp $4,865 | +1.0pp $4,780 |
4-unit breakdown (identical units grouped — click to expand)
| Units | Beds | Baths | Est. rent |
|---|---|---|---|
| 4× units | 5 | 4 | $9,340 |
| #1 | 5 | 4 | $2,335 |
| #2 | 5 | 4 | $2,335 |
| #3 | 5 | 4 | $2,335 |
| #4 | 5 | 4 | $2,335 |
| Total (4 units) | $9,340 | ||
UW: 25.0% down · 7.5% · 30yr · 1.5% tax · 5.0% vac · 8.0% maint · 8.0% mgmt
Financing live
Cash to close
- Down payment
- $81,250
- Closing costs
- $9,750
- Reserves months
- —
- Total cash needed
- —
Loan-product check · same deal, 3 products live
Conventional
25% down · 7.5% · 30yr
- Down + closing
- —
- Monthly P&I
- —
- Monthly cashflow
- —
- DSCR
- —
- Eligible?
- —
Personal DTI + credit; lowest rate.
DSCR
20% down · 8.5% · 30yr
- Down + closing
- —
- Monthly P&I
- —
- Monthly cashflow
- —
- DSCR
- —
- Eligible?
- —
No personal income docs; deal must DSCR.
Hard money
10% down · 12.0% · 12mo
- Down + closing
- —
- Monthly P&I
- —
- Monthly cashflow
- —
- DSCR
- —
- Eligible?
- —
Short-term bridge; refi at stabilization.
Listing history 11 events
-
2026-04-28status Pending
-
2026-03-31price $325,000
-
2026-03-31$625,000 Active
-
2025-12-04status Pending
-
2025-11-28historical
-
2025-11-03price $325,000
-
2025-09-06status Active
-
2025-08-26status Pending
-
2025-08-23historical $950
-
2025-08-22$350,000 Active
-
2025-08-07$950
ⓘ Source: listings_history table (triggers on properties + properties_extension) + one-shot
backfill from property_details.listing_events for pre-trigger history.
Tax reassessment forecast NY · Partial reset (capped growth)
- Current annual tax
- $7,070 · $589/mo
- Projected year-2 tax
- $7,070 · $589/mo
- Expected delta
- $0/yr ($0/mo · 0.0%)
ⓘ Screening estimate from a state-policy table — verify with the county assessor before closing.
Climate risk First Street
- Flood 1/10 Low FEMA zone X (unshaded) · 0% chance over 30 yrs
- Wildfire 1/10 Low
- Heat 4/10 Moderate 7 d/yr ≥98°F today · 17 d/yr by 30 yrs out
- Wind 3/10 Moderate 6% chance of damaging wind over 30 yrs
- Air quality 1/10 Low 0 unhealthy d/yr today · 0 by 30 yrs out
Nearby sold comps map
Loading sold comps map…
Walkable amenities ~0.75 mi
Loading nearby amenities…
Taxation est. · year 1
- Rental income
- $112,080
- − Mortgage interest
- −$18,205
- − Property taxes
- −$7,070
- − Insurance
- −$1,625
- − Repairs & maintenance
- −$8,966
- − Management
- −$8,966
- − Depreciation
- −$9,455
- Taxable income
- $57,793
- Est. tax owed @ 24.0%
- −$13,870
- After-tax cash flow
- $45,526/yr
For passive investors: Depreciation is non-cash, so a rental often shows a tax loss while cash-flowing — sheltering income. Rental losses are passive: they offset passive income freely, and up to $25,000/yr can offset ordinary (W-2) income if you actively participate and your MAGI is under $100k (phasing out to $0 by $150k); unused losses carry forward. On sale, claimed depreciation is recaptured at up to 25%, and gains may owe capital-gains tax (a 1031 exchange can defer both). Figures are a year-1 estimate at your 24.0% rate — not tax advice; consult a CPA.
Schools (NCES district)
- District
- Albany City School District
- NCES district ID
- 3602460
- Math proficiency
- 37% ▲ 6.00%
- Reading proficiency
- 40% ▲ 7.00%
- Median HH income
- $40,568
- Composite
- 32.34/100
- National rank
- #5744
- State rank
- #543 of 590 in NY
Livability — Albany
- Score
- 79/100
- State rank
- #129
- US rank
- #2083
Category grades
Schools grade is shown separately in the Schools card above.
Census & demographics
- Census place
- Albany, NY
- County
- Albany County · 196,626 people
- City population
- 116,921
- Metro
- Albany-Schenectady-Troy, NY
- Population (ZIP)
- 1,988
- Household income
- $58,998
- Rent vs Own
- Severe rent burden
- 182.0
Population outlook (Albany County) Hauer SSP2
- Today (2025)
- 320,794 people
- By 2030
- 327,401 · +2.1%
- By 2040
- 338,218 · +5.4%
- By 2050
- 348,467 · +8.6%
- By 2075
- 381,693 · +19.0%
- By 2100
- 393,809 · +22.8%
Race, ethnicity, and origin ACS 2023
- Neighborhood character
- Diverse neighborhood (Simpson 0.62)
- Race & ethnicity
- White 44% Black 43% Hispanic / Latino 7% Asian 3% Two or more races 3%
- Hispanic origin (detail)
- Mexican 2% Cuban 2% Dominican 2%
- Common ancestry
- Romanian 4% Serbian 1% Lithuanian 1%
- Foreign-born
- 6% · Canada, China
- Languages at home
- 85% English-only · Spanish 10% Korean 2% French/Haitian/Cajun 2%
Political lean MEDSL · Albany
- 2024 margin
- Strong D (+25.8) · D 62.9% · R 37.1%
- 2008→2024 swing
- -3.6pp toward R · 2008: 29.4pp · 2024: 25.8pp
- All cycles
- 2024: D+25.8 2020: D+31.4 2016: D+24.3 2012: D+31.0 2008: D+29.4
Not yet ingested
- Civics
- —
Market trends
- HPI YoY
- —
- Current HPI
- —
- Rent YoY
- ▲ 5.83%
- Metro
- Albany-Schenectady-Troy, NY
- State GDP YoY
- ▲ 2.60%
- F500 in state
- 92
Industry mix (Fortune 500 HQ in NY)
| Industry | F500 HQs | Revenue |
|---|---|---|
| Financial Services | 10 | $950B |
|
||
| Consumer Goods | 9 | $162B |
|
||
| Insurance | 4 | $225B |
|
||
| Telecommunications | 2 | $144B |
|
||
| Pharmaceuticals | 2 | $112B |
|
||
| Media / Entertainment | 2 | $69B |
|
||
Price history
-7.1% since first listed11 events — show timeline
- 2026-04-28 Pending — Global MLS
- 2026-03-31 Price Changed $325,000 Global MLS
- 2026-03-31 Listed $625,000 Global MLS
- 2025-12-04 Pending — Global MLS
- 2025-11-28 Listing Removed — Global MLS
- 2025-11-03 Price Changed $325,000 Global MLS
- 2025-09-06 Relisted — Global MLS
- 2025-08-26 Pending — Global MLS
- 2025-08-23 Rental Removed $950 REDFIN
- 2025-08-22 Listed $350,000 Global MLS
- 2025-08-07 Listed for Rent $950 REDFIN
Property tax history
+0.5%/yrLatest (2025): $7,070 · +0.0% YoY. Source: county tax records.
Cash-flow waterfall
monthlySold comps — $/sqft
last 12 mo · ≤1 miLoading sold comps…