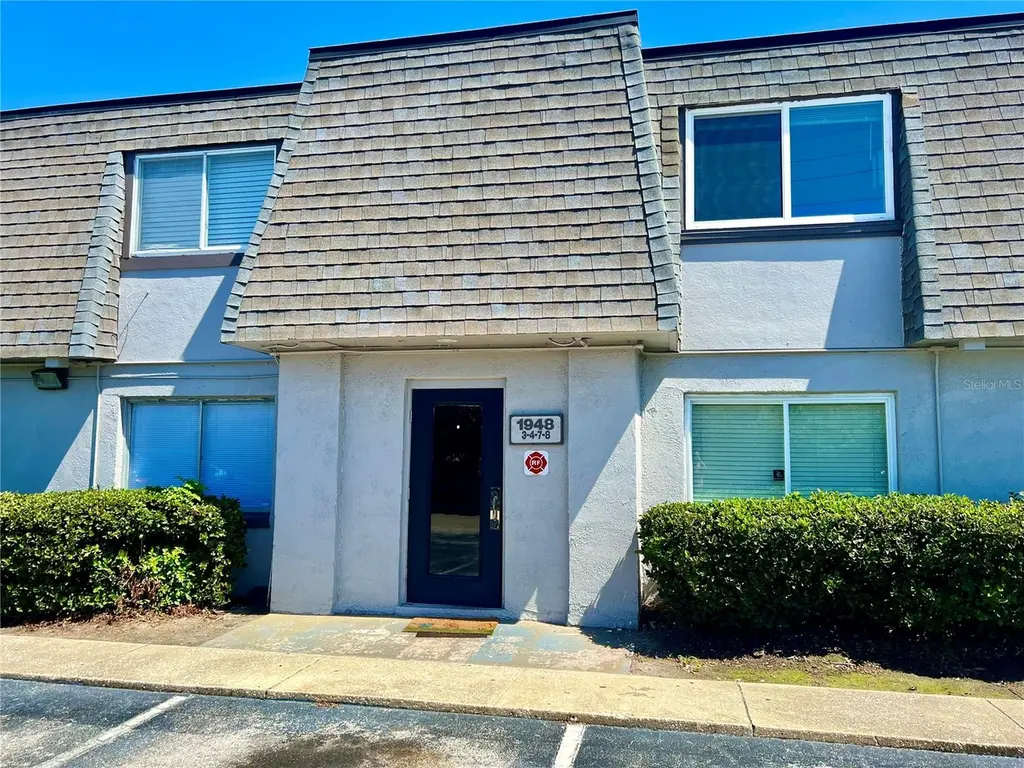
1948 Conway Rd #4 · Orlando, FL
Flood risk 1/10 · Minimal
- FEMA flood zone
- X (unshaded)
- Chance of flooding over 30 yrs
- 0.0%
- Est. flood insurance / yr
- $507 – $1,088
Fire risk 1/10 · Minimal
- Est. fire insurance / yr
- $947 – $1,759
Heat risk 9/10 · Severe
- Hot days now (above 108°F)
- 7 days/yr
- Hot days in 30 yrs
- 23 days/yr
Wind risk 9/10 · Severe
- Chance of severe wind over 30 yrs
- 99.0%
Air-quality risk 2/10 · Minimal
- Unhealthy air days now
- 1 days/yr
- Unhealthy air days in 30 yrs
- 1 days/yr
Risk factors via First Street. Map © Google.
Why this score? — see what drove the C- grade
The composite is a weighted blend of 9 inputs, each scored 0–100. Each bar is that input's sub-score; the figure is the points it added to the 100-point composite (weight × sub-score).
- Cash flow +16.5/30.0
- 1% rule +9.4/10.0
- ARV discount +7.5/15.0
- DSCR +5.1/10.0
- Livability +4.3/5.0
- Schools +4.1/10.0
- Condition / age +2.5/5.0
- Rent growth +2.0/5.0
- Appreciation +0.0/10.0
$125,000
🖨 Deal sheet 📄 Offer letter ✓ Due diligence
Listing remarks MLS
Short Sale: Approved Price ~ STUNNING, NEWLY RENOVATED, 1ST FLOOR END UNIT WITH LARGE BACKYARD WITH OAK. GREAT SPLIT FLOOR PLAN. TRULY A MUST-SEE UNIT IN METRO AT MICHIGAN PARK!
Key facts
- Fitness center
- Clubhouse
- Walk-in closet
Tags
Property features AI
Finance
- Financial info: Total annual association fees $4,260; Association approval required; Lease restrictions apply
- HOA & community: HOA: Zeal Community; Monthly HOA fee of $355 (includes pool, grounds maintenance, pest control and trash); Clubhouse, fitness center, pool; Deed restrictions; Sidewalks; Pets allowed (cats and dogs)
Exterior
- Parking: Asphalt paved road access
- Utilities: Public water; Public sewer; Electricity connected; Water connected
- Home design: Residential condominium; Single-story (one level); Faces south; Entry at first floor
- Construction: Block and stucco construction; Shingle roof; Slab foundation; Built as Unit 4 of building 1948
- Exterior features: Patio; Sidewalk; Sliding doors; Wood fencing; Paved lot
Interior
- Kitchen: Dishwasher; Microwave; Range; Refrigerator
- Bedrooms: 2 bedrooms
- Flooring: Laminate flooring; Tile flooring
- Bathrooms: 2 full bathrooms
- Heating & cooling: Central heating; Central air conditioning
- Interior features: Open floorplan; Thermostat; Walk-in closets; Blinds on windows
- Laundry & utility: Washer and dryer inside; Inside utility room
Neighborhood map
What this means for you Summary
Snapshot
- This is a 2-bed/2.0-bath condo listed at $125k.
Deal economics
- At list price, monthly cash flow is $74 ($890/yr) — positive.
- The deal already cash-flows at list — no discount required.
- Meets the 1% rule at list price ($2k rent vs $125k).
- Cap rate 7.0% vs local median 3.0% in Orlando — top-decile yield for the area; either an underpriced asset or a hidden risk that comps aren't pricing in. Stress-test before assuming the spread holds.
Location & tenants
- Location reads 86/100 on livability (#12 in FL, #360 nationally) — a professional / high-income tenant draw. Strengths: amenities A+, commute A+, housing A+.
- Orange (suburban): math 46% / reading 51% proficiency, ranked #43 of 73 in FL (top 59%) — families likely to look elsewhere, expect single-tenant / working-renter base with shorter leases.
- Zoned schools: Conway Elementary (math 38% / reading 38%, grade F, #1,587 of 2,144 statewide, top 74%, 489 students, 70% FRL); William R Boone High (math 36% / reading 58%, grade D-, #207 of 667 statewide, top 32%, 2,780 students, 44% FRL) — zoned schools at 57% FRL track the district average.
- Market conditions: Rents soft (-2.0%/yr); 214 active listings in the ZIP; 40 comparable units currently listed for rent nearby; rentals leasing fast (median 12d on market — plan ~1-2 weeks tenant-placement turnaround); 8,053 units permitted in Orange County in 2024 (3,133 in 5+ unit buildings).
Forward outlook
- Local home prices are declining (-3.0%/yr); year-one equity from $864 of loan paydown is wiped out by about $4k of value loss. Plan a longer hold.
- Orange County population projected at +52% by 2050 — long-run rental-demand tailwind backs the buy-and-hold thesis.
Negotiation context
- Only 14 days on market — expect competitive offers; lowballing is unlikely to land.
- 3 sale attempts since 19y ago with the ask held roughly flat each time — persistent listings suggest the price (not the market) is what's stuck; bring a comps-based counter.
- Current owner paid $36k; list at $125k implies a 247% gain — meaningful room to come down on a strong offer.
Risks & watch-outs
- Watch-outs: HOA is 26% of rent.
- Climate carrying-cost: severe wind risk, 99% chance of damaging wind over 30y; extreme-heat days projected 7→23/yr by 2055 (HVAC capex compounding) — expect insurance premiums to compound above CPI over the hold.
Questions for the listing agent
- Built in 1970 — when were the roof, HVAC, electrical panel, plumbing, and water heater last replaced?
- What does the HOA fee cover, when was the last increase, and are there any pending special assessments or reserve-fund shortfalls?
- Any open or pending special assessments — roof, HVAC, plumbing, elevator, façade? What's the per-unit balance and payoff schedule, and is the seller paying it off at close or rolling it to the buyer?
- Is there a deadline driving the sale (1031 exchange, divorce, estate, relocation)? That informs how much negotiation room exists.
- Schools are B-rated — typically a magnet for longer-tenancy family renters. What's the average tenant stay here, and is there a school-zone premium baked into asking?
- What's the average days-on-market for RENTAL listings here right now (not sales)? A rising rental-DOM trend means longer vacancies and softer asking-rent achievability than the comps imply.
- What's the recent tenant-quality profile in this submarket — average credit score on applications, eviction rate, late-payment / NSF rate, and stable-employment percentage? A property-management company in the area should have these aggregated.
- How much new apartment / multifamily construction is in the pipeline within 1–3 miles? Heavy new supply (>2% of stock underway) typically softens rents 12–24 months out; light construction supports rent growth.
Investment metrics
- 1% rule
- 1.44% ✓
- Cap rate
- 7.00%
- Cash-on-cash
- 2.54%
- DSCR
- 1.11
- GRM
- 5.8
CMA / ARV
No comps found within radius.
Projected returns pro-forma
-3.0% appreciation · 0.0% rent growth · sell at horizon
- IRR
- -17.3%
- Equity multiple
- 0.41×
- Total profit
- $-20,478
- Equity at exit
- $18,638
- IRR
- -21.7%
- Equity multiple
- 0.12×
- Total profit
- $-30,797
- Equity at exit
- $10,808
Cash invested: $35,000 (down + closing). Projections, not guarantees.
Landlord ↔ Tenant lean methodology
- Overall (STATE)
- 87 Strongly Landlord-Friendly
- State Florida
- 87 Strongly Landlord-Friendly · R+3
- County
- — inherits STATE
- City
- — inherits STATE
ZIP-level market 32812
- Rents YoY
- -2.0%
- Active inventory
- 214
- Price-to-rent
- 5.8×
Monthly cashflow live
- Estimated rent
- $1,798 high interval (Pro) →
- Mortgage (P&I)
- −$656
- Tax from tax record
- −$177 /mo · $2,130/yr
- Insurance
- −$52
- HOA
- −$461
- Vacancy / Maint / Mgmt
- −$378
- Net cashflow
- $74
Break-even live
UW: 25.0% down · 7.5% · 30yr · 1.5% tax · 5.0% vac · 8.0% maint · 8.0% mgmt
Financing live
Cash to close
- Down payment
- $31,250
- Closing costs
- $3,750
- Reserves months
- —
- Total cash needed
- —
Loan-product check · same deal, 3 products live
Conventional
25% down · 7.5% · 30yr
- Down + closing
- —
- Monthly P&I
- —
- Monthly cashflow
- —
- DSCR
- —
- Eligible?
- —
Personal DTI + credit; lowest rate.
DSCR
20% down · 8.5% · 30yr
- Down + closing
- —
- Monthly P&I
- —
- Monthly cashflow
- —
- DSCR
- —
- Eligible?
- —
No personal income docs; deal must DSCR.
Hard money
10% down · 12.0% · 12mo
- Down + closing
- —
- Monthly P&I
- —
- Monthly cashflow
- —
- DSCR
- —
- Eligible?
- —
Short-term bridge; refi at stabilization.
Rent comps 40 comps
| Address | Beds | Baths | Sqft | Rent | $/sqft | DOM | Units | Dist |
|---|---|---|---|---|---|---|---|---|
| 1948 Conway Rd #6 Orlando, FL | 2.0 | 2.0 | 1100 | $1,395 | $1.27 | 23d | 1 | 0.01mi |
| 1928 Conway Rd #1 Orlando, FL | 1.0 | 1.0 | 825 | $1,500 | $1.82 | 4d | 1 | 0.03mi |
| 2100 Conway Rd Orlando, FL | 1.0–3.0 | 1.0–2.0 | 1022 | $2,326 | $2.28 | 2d | 20 | 0.07mi |
| 1926 Conway Rd #5 Orlando, FL | 3.0 | 2.0 | 1302 | $1,750 | $1.34 | 23d | 1 | 0.08mi |
| 2320 S Conway Rd Orlando, FL | 3.0 | 1.0–2.0 | 760 | $1,703 | $2.24 | 2d | 23 | 0.19mi |
| 1637 Watauga Ave Orlando, FL | 2.0 | 2.0 | 951 | $1,432 | $1.51 | 7d | 2 | 0.21mi |
| 2490 Conway Rd Orlando, FL | 1.0–2.0 | 1.0–2.0 | 984 | $1,758 | $1.79 | 1d | 14 | 0.21mi |
| 4310 Yorkshire Ln Orlando, FL | 3.0 | 2.0 | 1271 | $2,095 | $1.65 | 4d | 1 | 0.26mi |
| 3612 Surrey Dr Orlando, FL | 3.0 | 1.5 | 1040 | $2,200 | $2.12 | 4d | 1 | 0.28mi |
| 2520 Conway Rd Orlando, FL | 1.0–2.0 | 1.0–2.0 | 967 | $1,899 | $1.96 | 11d | 15 | 0.30mi |
| 2001 Conway Gardens Rd Orlando, FL | 3.0 | 1.0 | 1040 | $2,375 | $2.28 | 23d | 1 | 0.31mi |
| 3700 Curry Ford Rd Orlando, FL | 3.0 | 1.0–2.0 | 830 | $1,710 | $2.06 | 1d | 29 | 0.34mi |
| 4001 E Michigan St Unit 4323 Orlando, FL | 2.0 | 2.0 | 864 | $1,195 | $1.38 | 10d | 1 | 0.38mi |
| 4019 E Michigan St #4019 Orlando, FL | 2.0 | 1.0 | 828 | $1,390 | $1.68 | 7d | 1 | 0.38mi |
| 3501 E Grant Ave Orlando, FL | 3.0 | 2.0 | 1483 | $2,850 | $1.92 | 23d | 1 | 0.40mi |
| 1501 Berwyn Rd Orlando, FL | 3.0 | 2.0 | 1223 | $2,331 | $1.91 | 21d | 1 | 0.44mi |
| 3373 Coe Ave Orlando, FL | 1.0 | 1.0 | 720 | $1,699 | $2.36 | 23d | 1 | 0.51mi |
| 4895 E Wind St Unit 2 Orlando, FL | 2.0 | 1.0 | 1000 | $1,499 | $1.50 | 16d | 1 | 0.57mi |
| 4928 E Michigan St Orlando, FL | 1.0–2.0 | 1.0–2.0 | 1102 | $2,050 | $1.86 | 1d | 6 | 0.60mi |
| 2859 Conway Rd Orlando, FL | 1.0–3.0 | 1.0–2.0 | 917 | $1,824 | $1.99 | 7d | 17 | 0.61mi |
| 1638 S Crystal Lake Dr Orlando, FL | 2.0 | 1.0 | 655 | $1,750 | $2.67 | 4d | 1 | 0.69mi |
| 1448 Adriel Ln Orlando, FL | 1.0–2.0 | 1.0–2.0 | 712 | $1,550 | $2.18 | 21d | 1 | 0.75mi |
| 3037 Condel Dr Orlando, FL | 2.0 | 2.0 | 1100 | $3,000 | $2.73 | 23d | 1 | 0.81mi |
| 3149 Landtree Pl Orlando, FL | 1.0–2.0 | 1.0–2.0 | 751 | $2,097 | $2.79 | 1d | 15 | 0.83mi |
| 5273 Tunbridge Wells Ln #1601 Orlando, FL | 3.0 | 2.0 | 1395 | $2,000 | $1.43 | 21d | 1 | 0.87mi |
| 5230 Curry Ford Rd Orlando, FL | 2.0 | 1.0 | 984 | $1,250 | $1.27 | 4d | 1 | 0.89mi |
| 5234 Curry Ford Rd #412 Orlando, FL | 2.0 | 1.0 | 984 | $1,200 | $1.22 | 23d | 1 | 0.89mi |
| 2786 Curry Ford Rd Unit 6B Orlando, FL | 2.0 | 1.0 | 927 | $1,650 | $1.78 | 17d | 1 | 0.93mi |
| 2690 Curry Ford Rd Unit 2 Orlando, FL | 1.0 | 1.0 | 790 | $1,699 | $2.15 | 19d | 1 | 0.96mi |
| 5301 White Cliff Ln Unit 1004 Orlando, FL | 2.0 | 2.0 | 1071 | $1,800 | $1.68 | 14d | 1 | 0.97mi |
| 720 Conway Rd Orlando, FL | 2.0 | 1.0–2.0 | 995 | $2,037 | $2.05 | 1d | 13 | 1.09mi |
| 5325 Curry Ford Rd Unit H101 Orlando, FL | 1.0 | 1.0 | 777 | $1,199 | $1.54 | 23d | 1 | 1.09mi |
| 4004 Lake Underhill Rd Orlando, FL | 1.0–3.0 | 1.0–2.0 | 891 | $1,948 | $2.18 | 1d | 15 | 1.09mi |
| 2315 E Kaley Ave Unit 1 Orlando, FL | 1.0 | 1.0 | 825 | $1,400 | $1.70 | 20d | 1 | 1.10mi |
| 4380 Lake Underhill Rd Orlando, FL | 2.0 | 2.0 | 1250 | $2,000 | $1.60 | 10d | 1 | 1.11mi |
| 4380 Lake Underhill Rd Unit A Orlando, FL | 2.0 | 2.0 | 1250 | $2,000 | $1.60 | 14d | 1 | 1.11mi |
| 1625 Larkin Ave Orlando, FL | 3.0 | 2.0 | 1202 | $1,850 | $1.54 | 11d | 1 | 1.12mi |
| 5408 E Michigan St Orlando, FL | 1.0 | 1.0 | 851 | $1,388 | $1.63 | 23d | 2 | 1.16mi |
| 5424 E Michigan St Orlando, FL | 2.0 | 2.0 | 1126 | $1,499 | $1.33 | 7d | 1 | 1.18mi |
| 3326 Conway Gardens Rd Orlando, FL | 2.0 | 1.0 | 1110 | $2,400 | $2.16 | 12d | 1 | 1.18mi |
HOA detail condo
- Monthly dues
- $461 · $5,532/yr
- Assessments
- None detected in remarks — confirm with the listing agent.
Listing history 16 events
-
2026-06-18days on market $125,000 Active 14 DOM
-
2026-06-17days on market $125,000 Active 13 DOM
-
2026-06-16days on market $125,000 Active 12 DOM
-
2026-06-15days on market $125,000 Active 11 DOM
-
2026-06-13days on market $125,000 Active 9 DOM
-
2026-06-13days on market $125,000 Active 8 DOM
-
2026-06-10status $125,000 Active 5 DOM
-
2026-06-03status $125,000 Pending 5 DOM
-
2026-06-02days on market $125,000 Active 5 DOM
-
2026-06-01days on market $125,000 Active 4 DOM
-
2026-05-31days on market $125,000 Active 3 DOM
-
2026-05-28$125,000 Active
-
2010-12-22soldstatus $36,000 177-char remark
Show marketing remark (177 chars)
Short Sale: Approved Price ~ STUNNING, NEWLY RENOVATED, 1ST FLOOR END UNIT WITH LARGE BACKYARD WITH OAK. GREAT SPLIT FLOOR PLAN. TRULY A MUST-SEE UNIT IN METRO AT MICHIGAN PARK!
-
2009-11-30$33,000 177-char remark
Show marketing remark (177 chars)
Short Sale: Approved Price ~ STUNNING, NEWLY RENOVATED, 1ST FLOOR END UNIT WITH LARGE BACKYARD WITH OAK. GREAT SPLIT FLOOR PLAN. TRULY A MUST-SEE UNIT IN METRO AT MICHIGAN PARK!
-
2008-03-12historical
-
2007-09-16$189,503
ⓘ Source: listings_history table (triggers on properties + properties_extension) + one-shot
backfill from property_details.listing_events for pre-trigger history.
Tax reassessment forecast FL · Resets to sale price
- Current annual tax
- $2,130 · $177/mo
- Projected year-2 tax
- $2,130 · $177/mo
- Expected delta
- $0/yr ($0/mo · 0.0%)
ⓘ Screening estimate from a state-policy table — verify with the county assessor before closing.
Climate risk First Street
- Flood 1/10 Low FEMA zone X (unshaded) · 0% chance over 30 yrs
- Wildfire 1/10 Low
- Heat 9/10 Extreme 7 d/yr ≥108°F today · 23 d/yr by 30 yrs out
- Wind 9/10 Extreme 99% chance of damaging wind over 30 yrs
- Air quality 2/10 Low 1 unhealthy d/yr today · 1 by 30 yrs out
Nearby sold comps map
Loading sold comps map…
Walkable amenities ~0.75 mi
Loading nearby amenities…
Taxation est. · year 1
- Rental income
- $21,573
- − Mortgage interest
- −$7,002
- − Property taxes
- −$2,130
- − Insurance
- −$625
- − Repairs & maintenance
- −$1,726
- − Management
- −$1,726
- − HOA
- −$5,532
- − Depreciation
- −$3,636
- Taxable loss
- −$804
- Est. tax savings @ 24.0%
- +$193
- After-tax cash flow
- $1,083/yr
For passive investors: Depreciation is non-cash, so a rental often shows a tax loss while cash-flowing — sheltering income. Rental losses are passive: they offset passive income freely, and up to $25,000/yr can offset ordinary (W-2) income if you actively participate and your MAGI is under $100k (phasing out to $0 by $150k); unused losses carry forward. On sale, claimed depreciation is recaptured at up to 25%, and gains may owe capital-gains tax (a 1031 exchange can defer both). Figures are a year-1 estimate at your 24.0% rate — not tax advice; consult a CPA.
Schools (NCES district)
- District
- Orange
- NCES district ID
- 1201440
- Math proficiency
- 46% ▼ -9.00%
- Reading proficiency
- 51% ▼ -2.00%
- Median HH income
- $49,350
- Composite
- 41.47/100
- National rank
- #3461
- State rank
- #43 of 73 in FL
Livability — Orlando
- Score
- 86/100
- State rank
- #12
- US rank
- #360
Category grades
Schools grade is shown separately in the Schools card above.
Census & demographics
- Census place
- Orlando, FL
- County
- Orange County · 1,471,359 people
- City population
- 964,969
- Metro
- Orlando-Kissimmee-Sanford, FL
- Population (ZIP)
- 34,686
- Household income
- $73,149
- Rent vs Own
- Severe rent burden
- 1653.0
Population outlook (Orange County) Hauer SSP2
- Today (2025)
- 1,618,226 people
- By 2030
- 1,787,404 · +10.5%
- By 2040
- 2,125,621 · +31.4%
- By 2050
- 2,454,016 · +51.6%
- By 2075
- 3,173,711 · +96.1%
- By 2100
- 3,607,781 · +122.9%
Race, ethnicity, and origin ACS 2023
- Neighborhood character
- Diverse neighborhood (Simpson 0.63)
- Race & ethnicity
- White 49% Hispanic / Latino 34% Two or more races 18% Black 8% Asian 4%
- Hispanic origin (detail)
- Mexican 3% Puerto Rican 18% Cuban 3% Dominican 2%
- Common ancestry
- Romanian 3% Slovak 2% Iranian 2%
- Foreign-born
- 13% · Canada, Jamaica, Vietnam
- Languages at home
- 66% English-only · Spanish 28% Chinese 2% Other Indo-European 1%
Political lean MEDSL · Orange
- 2024 margin
- D (+13.6) · D 56.1% · R 42.5% · Other 1.3%
- 2008→2024 swing
- -5.0pp toward R · 2008: 18.6pp · 2024: 13.6pp
- All cycles
- 2024: D+13.6 2020: D+23.1 2016: D+24.6 2012: D+18.2 2008: D+18.6
Not yet ingested
- Civics
- —
Market trends
- HPI YoY
- ▼ -202.16%
- Current HPI
- 352.6841
- Rent YoY
- ▼ -2.00%
- Metro
- Orlando-Kissimmee-Sanford, FL
- State GDP YoY
- ▲ 3.28%
- F500 in state
- 36
Industry mix (Fortune 500 HQ in FL)
| Industry | F500 HQs | Revenue |
|---|---|---|
| Industrial Technology | 2 | $29B |
|
||
| Insurance | 2 | $17B |
|
||
| Retail | 1 | $60B |
|
||
| Technology Distribution | 1 | $58B |
|
||
| Homebuilding | 1 | $35B |
|
||
| Technology Manufacturing | 1 | $35B |
|
||
Price history
-34.0% since first listed5 events — show timeline
- 2026-05-28 Listed $125,000 Stellar MLS as Distributed by MLS Grid
- 2010-12-22 Sold (MLS) $36,000 Stellar MLS as Distributed by MLS Grid
- 2009-11-30 Listed $33,000 Stellar MLS as Distributed by MLS Grid
- 2008-03-12 Listing Removed — Stellar MLS as Distributed by MLS Grid
- 2007-09-16 Listed $189,503 Stellar MLS as Distributed by MLS Grid
Property tax history
+10.1%/yrLatest (2025): $2,130 · +8.3% YoY. Source: county tax records.
Cash-flow waterfall
monthlySold comps — $/sqft
last 12 mo · ≤1 miLoading sold comps…