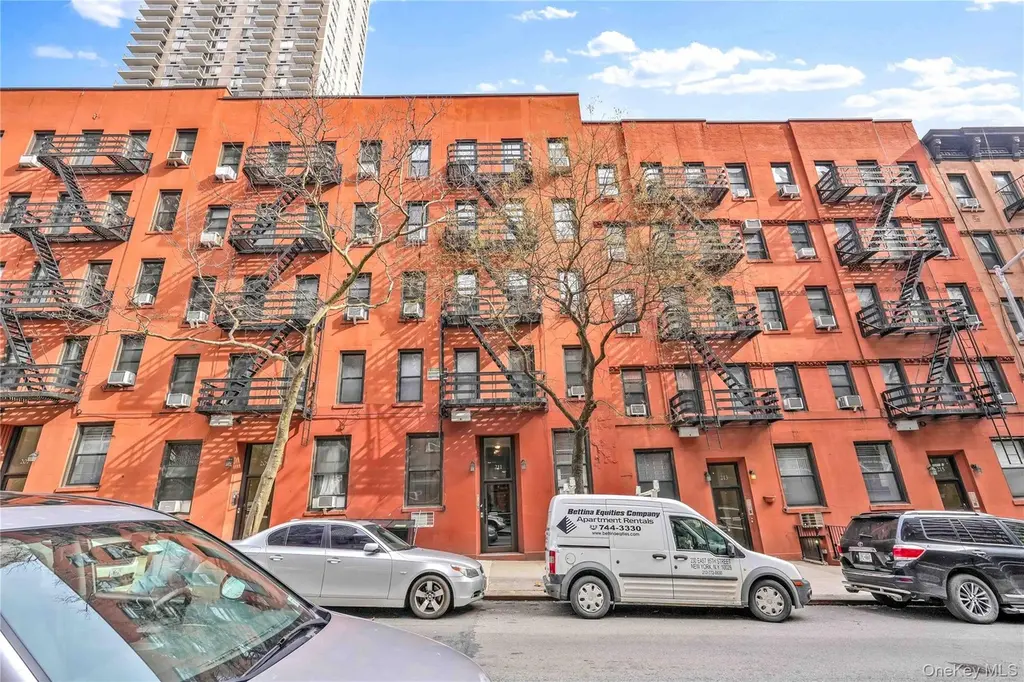
211 E 88 St Unit 2A · New York, NY
Flood risk 1/10 · Minimal
- FEMA flood zone
- X (unshaded)
- Chance of flooding over 30 yrs
- 0.0%
- Est. flood insurance / yr
- $507 – $1,088
Fire risk 1/10 · Minimal
- Est. fire insurance / yr
- $691 – $1,283
Heat risk 6/10 · Moderate
- Hot days now (above 99°F)
- 7 days/yr
- Hot days in 30 yrs
- 15 days/yr
Wind risk 6/10 · Moderate
- Chance of severe wind over 30 yrs
- 27.0%
Air-quality risk 4/10 · Minor
- Unhealthy air days now
- 5 days/yr
- Unhealthy air days in 30 yrs
- 6 days/yr
Risk factors via First Street. Map © Google.
Why this score? — see what drove the C grade
The composite is a weighted blend of 9 inputs, each scored 0–100. Each bar is that input's sub-score; the figure is the points it added to the 100-point composite (weight × sub-score).
- Cash flow +16.9/30.0
- ARV discount +7.5/15.0
- Appreciation +6.9/10.0
- DSCR +5.2/10.0
- Schools +5.0/10.0
- 1% rule +4.6/10.0
- Rent growth +4.3/5.0
- Livability +3.8/5.0
- Condition / age +3.8/5.0
$388,000
🖨 Deal sheet (PDF) 📄 Offer letter ✓ Due diligence
Listing remarks
Welcome to Residence 2A at 211 East 88th Street — a charming pre-war co-op nestled on a quiet, tree-lined block in the heart of Manhattan’s coveted Upper East Side. This inviting home offers classic New York character paired with everyday functionality. Located just one flight up in a boutique walk-up building, the apartment features a well-proportioned layout with distinct living and sleeping areas, allowing for comfortable living and entertaining. Oversized windows invite natural light throughout, while timeless details such as hardwood floors and high ceilings enhance the home’s warmth and appeal. The kitchen provides ample cabinetry and workspace, while the bedroom ser
Key facts
- Laundry facilities
- Ample cabinetry
- Tree-lined block
Tags
Property features AI
Exterior
- Parking: No carport; No parking features
- Utilities: Public sewer; Electricity available and connected; Water available and connected
- Home design: Stock cooperative
- Construction: Other construction materials; Other foundation details
- Exterior features: No waterfront
Interior
- Kitchen: Refrigerator
- Bedrooms: 2 rooms total (entry level: 2)
- Bathrooms: 1 full bathroom
- Heating & cooling: No cooling; Other heating
- Interior features: Entrance foyer; Measured living area
- Laundry & utility: Basement (common)
Neighborhood map
What this means for you Summary
Snapshot
- This is a 1-bed/1.0-bath condo listed at $388k. Condition is rated good.
Deal economics
- At list price, monthly cash flow is $254 ($3k/yr) — positive.
- The deal already cash-flows at list — no discount required.
- To meet the 1% rule (rent ≥ 1% of price), the offer needs to be $372k (4.2% below list).
- Recommended offer: $353k (9.0% below list) — sets the bar for market timing.
- Cap rate 7.1% vs local median 2.6% in New York — top-decile yield for the area; either an underpriced asset or a hidden risk that comps aren't pricing in. Stress-test before assuming the spread holds.
Location & tenants
- Location reads 75/100 on livability (#268 in NY, #4,188 nationally) — a middle-class / working-renter tenant base. Strengths: amenities A+, commute A+, health & safety A; Watch: crime F, cost of living F.
- Market conditions: Rents rising fast (+7.0%/yr); 309 active listings in the ZIP; high-income renter base; 4,467 units permitted in New York County in 2024 (4,463 in 5+ unit buildings).
- This rent runs 30% of the median local income ($148k/yr) — at the standard rent-burdened threshold; future hikes will face affordability resistance.
Forward outlook
- In year one you build about $17k of equity ($3k loan paydown + $14k appreciation (3.7% local appreciation)).
- New York County population projected at +21% by 2050 — long-run rental-demand tailwind backs the buy-and-hold thesis.
- At projected returns (3.7% appreciation + 7.0% rent growth), your $109k cash investment doubles in ~5 years — after that, you're playing with house money.
- By year 3, paydown + projected appreciation supports a ~$43k cash-out refi (75% LTV) — recoverable capital for the next deal without selling this one.
Negotiation context
- It's been on market 92 days — a 9% lower offer ($353k) is reasonable based on typical stale-listing flexibility.
Risks & watch-outs
- Watch-outs: built in 1920 — expect roof / HVAC / electrical / plumbing capex.
- Climate carrying-cost: major wind risk, 27% chance of damaging wind over 30y; extreme-heat days projected 7→15/yr by 2055 (HVAC capex compounding) — expect insurance premiums to compound above CPI over the hold.
Questions for the listing agent
- It's been on market 92 days. Have you received any prior offers? Is the seller open to a 9% concession, seller financing, or rate buy-down credit?
- Built in 1920 — when were the roof, HVAC, electrical panel, plumbing, and water heater last replaced?
- Any open or pending special assessments — roof, HVAC, plumbing, elevator, façade? What's the per-unit balance and payoff schedule, and is the seller paying it off at close or rolling it to the buyer?
- Why hasn't it sold? Are there any deal-killer items the seller is aware of (foundation, flood, title, zoning, code violations)?
- Is there a deadline driving the sale (1031 exchange, divorce, estate, relocation)? That informs how much negotiation room exists.
- Schools are B-rated — typically a magnet for longer-tenancy family renters. What's the average tenant stay here, and is there a school-zone premium baked into asking?
- Crime grade is F in this area — have there been break-ins, vandalism, or insurance claims at this property in the last 3 years? What carrier currently insures it and at what premium?
- What's the average days-on-market for RENTAL listings here right now (not sales)? A rising rental-DOM trend means longer vacancies and softer asking-rent achievability than the comps imply.
- What's the recent tenant-quality profile in this submarket — average credit score on applications, eviction rate, late-payment / NSF rate, and stable-employment percentage? A property-management company in the area should have these aggregated.
- How much new apartment / multifamily construction is in the pipeline within 1–3 miles? Heavy new supply (>2% of stock underway) typically softens rents 12–24 months out; light construction supports rent growth.
Investment metrics
- 1% rule
- 0.96% ✗
- Cap rate
- 7.08%
- Cash-on-cash
- 2.81%
- DSCR
- 1.12
- GRM
- 8.7
CMA / ARV
No comps found within radius.
Projected returns pro-forma
3.74% appreciation · 7.04% rent growth · sell at horizon
- IRR
- 14.2%
- Equity multiple
- 1.87×
- Total profit
- $94,025
- Equity at exit
- $190,759
- IRR
- 17.5%
- Equity multiple
- 3.96×
- Total profit
- $321,634
- Equity at exit
- $307,337
Cash invested: $108,640 (down + closing). Projections, not guarantees.
Landlord ↔ Tenant lean methodology
- Overall (CITY)
- 0 Strongly Tenant-Friendly
- State New York
- 15 Strongly Tenant-Friendly · D+10
- County
- — inherits STATE
- City New York
- 0 Strongly Tenant-Friendly · D+34
ZIP-level market 10128
- Home prices YoY
- 2.0%
- Rents YoY
- 7.0%
- Active inventory
- 309
- Price-to-rent
- 8.7×
Monthly cashflow live
- Estimated rent
- $3,716 medium interval (Pro) →
- Mortgage (P&I)
- −$2,035
- Tax est. 1.5%
- −$485 /mo · $5,820/yr
- Insurance
- −$162
- HOA
- −$0
- Vacancy / Maint / Mgmt
- −$780
- Net cashflow
- $254
Break-even live
Sensitivity live
| Price | -10% $522 | -5% $388 | +0% $254 | +5% $120 | +10% $-14 |
|---|---|---|---|---|---|
| Rent | -10% $-39 | -5% $107 | +0% $254 | +5% $401 | +10% $548 |
| Rate | -1.0pp $450 | -0.5pp $353 | base $254 | +0.5pp $154 | +1.0pp $51 |
UW: 25.0% down · 7.5% · 30yr · 1.5% tax · 5.0% vac · 8.0% maint · 8.0% mgmt
Financing live
Cash to close
- Down payment
- $97,000
- Closing costs
- $11,640
- Reserves months
- —
- Total cash needed
- —
Loan-product check · same deal, 3 products live
Conventional
25% down · 7.5% · 30yr
- Down + closing
- —
- Monthly P&I
- —
- Monthly cashflow
- —
- DSCR
- —
- Eligible?
- —
Personal DTI + credit; lowest rate.
DSCR
20% down · 8.5% · 30yr
- Down + closing
- —
- Monthly P&I
- —
- Monthly cashflow
- —
- DSCR
- —
- Eligible?
- —
No personal income docs; deal must DSCR.
Hard money
10% down · 12.0% · 12mo
- Down + closing
- —
- Monthly P&I
- —
- Monthly cashflow
- —
- DSCR
- —
- Eligible?
- —
Short-term bridge; refi at stabilization.
HOA detail condo
- Monthly dues
- $0 · $0/yr
- Assessments
- None detected in remarks — confirm with the listing agent.
Listing history 12 events
-
2026-06-18days on market $388,000 Active 92 DOM
-
2026-06-17days on market $388,000 Active 91 DOM
-
2026-06-15days on market $388,000 Active 89 DOM
-
2026-06-13days on market $388,000 Active 87 DOM
-
2026-06-10days on market $388,000 Active 83 DOM
-
2026-06-08days on market $388,000 Active 82 DOM
-
2026-06-08days on market $388,000 Active 81 DOM
-
2026-06-04pricedays on market $388,000 Active 78 DOM
-
2026-06-03days on market $408,000 Active 77 DOM
-
2026-06-01days on market $408,000 Active 75 DOM
-
2026-05-31days on market $408,000 Active 74 DOM
-
2026-03-17$408,000 Active
ⓘ Source: listings_history table (triggers on properties + properties_extension) + one-shot
backfill from property_details.listing_events for pre-trigger history.
Climate risk First Street
- Flood 1/10 Low FEMA zone X (unshaded) · 0% chance over 30 yrs
- Wildfire 1/10 Low
- Heat 6/10 Major 7 d/yr ≥99°F today · 15 d/yr by 30 yrs out
- Wind 6/10 Major 27% chance of damaging wind over 30 yrs
- Air quality 4/10 Moderate 5 unhealthy d/yr today · 6 by 30 yrs out
Nearby sold comps map
Loading sold comps map…
Walkable amenities ~0.75 mi
Loading nearby amenities…
Taxation est. · year 1
- Rental income
- $44,591
- − Mortgage interest
- −$21,734
- − Property taxes
- −$5,820
- − Insurance
- −$1,940
- − Repairs & maintenance
- −$3,567
- − Management
- −$3,567
- − Depreciation
- −$11,287
- Taxable loss
- −$3,325
- Est. tax savings @ 24.0%
- +$798
- After-tax cash flow
- $3,849/yr
For passive investors: Depreciation is non-cash, so a rental often shows a tax loss while cash-flowing — sheltering income. Rental losses are passive: they offset passive income freely, and up to $25,000/yr can offset ordinary (W-2) income if you actively participate and your MAGI is under $100k (phasing out to $0 by $150k); unused losses carry forward. On sale, claimed depreciation is recaptured at up to 25%, and gains may owe capital-gains tax (a 1031 exchange can defer both). Figures are a year-1 estimate at your 24.0% rate — not tax advice; consult a CPA.
Condition & rehab AI · 6 photos
This pre-war co-op in the Upper East Side is in good condition with a well-maintained interior and exterior. A fresh coat of paint on the exterior walls and cleaning the windows would significantly enhance its curb appeal and value.
Value-add opportunities
- Both Paint exterior walls — Fresh paint enhances curb appeal and can increase both resale and rental value.
- Both Clean windows — Clean windows improve natural light and can make the home more appealing to potential buyers or renters.
Renovation cost estimate screening
Value-add ROI direction
- Both Paint exterior walls — Fresh paint enhances curb appeal and can increase both resale and rental value. ↑
- Both Clean windows — Clean windows improve natural light and can make the home more appealing to potential buyers or renters. ↑
ⓘ Cost ranges are severity-bucket heuristics (US national rule-of-thumb). Get contractor quotes + a written scope before underwriting a rehab budget.
Schools (NCES district)
No district data.
Livability — New York
- Score
- 75/100
- State rank
- #268
- US rank
- #4188
Category grades
Schools grade is shown separately in the Schools card above.
Census & demographics
- Census place
- New York, NY
- County
- New York County · 1,599,927 people
- City population
- 7,731,280
- Metro
- New York-Newark-Jersey City, NY-NJ-PA
- Population (ZIP)
- 57,976
- Household income
- $147,772
- Rent vs Own
- Severe rent burden
- 4892.0
Population outlook (New York County) Hauer SSP2
- Today (2025)
- 1,825,725 people
- By 2030
- 1,904,611 · +4.3%
- By 2040
- 2,052,719 · +12.4%
- By 2050
- 2,206,601 · +20.9%
- By 2075
- 2,509,427 · +37.4%
- By 2100
- 2,702,933 · +48.0%
Race, ethnicity, and origin ACS 2023
- Neighborhood character
- Predominantly White (67%)
- Race & ethnicity
- White 67% Hispanic / Latino 13% Asian 10% Two or more races 9% Black 5%
- Hispanic origin (detail)
- Mexican 2% Puerto Rican 3% Cuban 1% Dominican 2%
- Common ancestry
- Scotch-Irish 6% Romanian 6% Lithuanian 2%
- Foreign-born
- 25% · Canada, China, South Korea
- Languages at home
- 71% English-only · Spanish 9% Other Indo-European 6% Other Asian/Pacific 3%
Political lean MEDSL · New York
- 2024 margin
- Solid D (+64.8) · D 82.4% · R 17.6%
- 2008→2024 swing
- -7.4pp toward R · 2008: 72.2pp · 2024: 64.8pp
- All cycles
- 2024: D+64.8 2020: D+74.5 2016: D+77.2 2012: D+69.6 2008: D+72.2
Not yet ingested
- Civics
- —
Market trends
- HPI YoY
- ▲ 3.74%
- Current HPI
- 187.2161
- Rent YoY
- ▲ 7.04%
- Metro
- New York-Newark-Jersey City, NY-NJ-PA
- State GDP YoY
- ▲ 2.60%
- F500 in state
- 92
Industry mix (Fortune 500 HQ in NY)
| Industry | F500 HQs | Revenue |
|---|---|---|
| Financial Services | 10 | $950B |
|
||
| Consumer Goods | 9 | $162B |
|
||
| Insurance | 4 | $225B |
|
||
| Telecommunications | 2 | $144B |
|
||
| Pharmaceuticals | 2 | $112B |
|
||
| Media / Entertainment | 2 | $69B |
|
||
Price history
1 event — show timeline
- 2026-03-17 Listed $408,000 OneKey® MLS as Distributed by MLS Grid
Cash-flow waterfall
monthlySold comps — $/sqft
last 12 mo · ≤1 miLoading sold comps…