 🏗️ New Construction
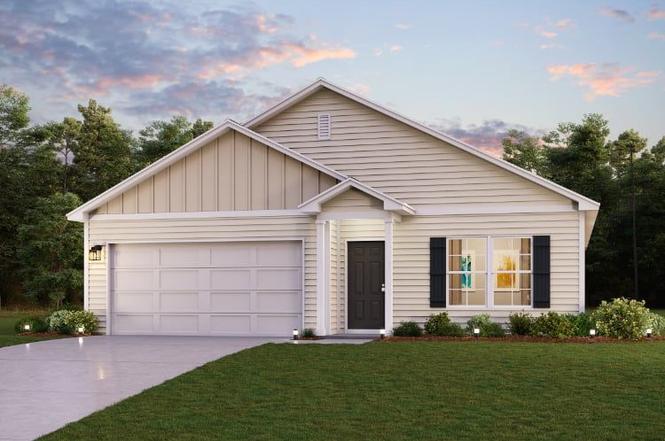
CABOT Plan · Glen St. Mary, FL
Flood risk 1/10 · Minimal
- FEMA flood zone
- X (unshaded)
- Chance of flooding over 30 yrs
- 0.0%
- Est. flood insurance / yr
- $507 – $1,088
Fire risk 6/10 · Moderate
- Est. fire insurance / yr
- $947 – $1,759
Heat risk 8/10 · Major
- Hot days now (above 107°F)
- 7 days/yr
- Hot days in 30 yrs
- 20 days/yr
Wind risk 9/10 · Severe
- Chance of severe wind over 30 yrs
- 99.0%
Air-quality risk 5/10 · Moderate
- Unhealthy air days now
- 7 days/yr
- Unhealthy air days in 30 yrs
- 8 days/yr
Risk factors via First Street. Map © Google.
Why this score? — see what drove the D grade
The composite is a weighted blend of 9 inputs, each scored 0–100. Each bar is that input's sub-score; the figure is the points it added to the 100-point composite (weight × sub-score).
- Cash flow +15.3/30.0
- ARV discount +7.5/15.0
- DSCR +4.7/10.0
- Schools +4.4/10.0
- 1% rule +4.2/10.0
- Rent growth +2.5/5.0
- Livability +2.5/5.0
- Condition / age +2.5/5.0
- Appreciation +0.0/10.0
$288,990
🖨 Deal sheet (PDF) 📄 Offer letter ✓ Due diligence
Listing remarks
Welcome home to our Cabot plan. This thoughtfully designed open concept layout seamlessly connects the spacious kitchen, dining, and living areas, creating the perfect setting for gatherings and everyday living. The kitchen features an abundance of white shaker style cabinets, beautiful granite countertops and stainless steel appliances. The primary suite offers a true retreat with a private bath including dual sinks and a large walk in closet. Three additional bedrooms provide plenty of space for family, guests, or a home office. Step out from the dining area onto a covered back porch, perfect for relaxing mornings or evening get togethers. With modern finishes, quality craftsmanship, and
Key facts
- Private bath
- Spacious kitchen
- Granite countertops
Tags
Property features AI
Finance
- Financial info: List price $288,990
Exterior
- Home design: CABOT plan (new construction plan); Active listing
- Construction: Plan name: CABOT
- Exterior features: Living area of 1684
Interior
- Bedrooms: 4 bedrooms
- Interior features: 2 full bathrooms; Total of 2 bathrooms
Neighborhood map
What this means for you Summary
Snapshot
- This is a 4-bed/2.0-bath single-family listed at $289k.
Deal economics
- At list price, monthly cash flow is $104 ($1k/yr) — positive.
- The deal already cash-flows at list — no discount required.
- To meet the 1% rule (rent ≥ 1% of price), the offer needs to be $258k (10.8% below list).
- Recommended offer: $254k (12.0% below list) — sets the bar for market timing.
- Cap rate 6.7% vs local median 3.5% in Glen St. Mary — top-decile yield for the area; either an underpriced asset or a hidden risk that comps aren't pricing in. Stress-test before assuming the spread holds.
Location & tenants
- Location reads: area grade D — affects rentability + tenant quality, not the cash-flow math above.
- Baker (town): math 53% / reading 49% proficiency, ranked #28 of 73 in FL (top 38%) — acceptable for families but not a draw, mixed tenant base, ~2y average lease.
- Zoned schools: Prek/Kindergarten Center (592 students, 58% FRL); Baker County Middle School (math 47% / reading 42%, grade D, #320 of 571 statewide, top 57%, 1,102 students, 52% FRL); Baker County Senior High School (math 41% / reading 48%, grade F, #237 of 667 statewide, top 36%, 1,425 students, 40% FRL) — zoned schools at 50% FRL track the district average.
- Market conditions: 63 active listings in the ZIP; 99 units permitted in Baker County in 2024 (0 in 5+ unit buildings).
Forward outlook
- Local home prices are declining (-3.0%/yr); year-one equity from $2k of loan paydown is wiped out by about $8k of value loss. Plan a longer hold.
- Baker County population projected to shrink 9% by 2050 — rents likely to lag national; underwrite the cash flow, not the appreciation.
Negotiation context
- It's been on market 296 days — a 12% lower offer ($254k) is reasonable based on typical stale-listing flexibility.
Risks & watch-outs
- Climate carrying-cost: severe wind risk, 99% chance of damaging wind over 30y; major wildfire risk; extreme-heat days projected 7→20/yr by 2055 (HVAC capex compounding) — expect insurance premiums to compound above CPI over the hold.
Questions for the listing agent
- It's been on market 296 days. Have you received any prior offers? Is the seller open to a 12% concession, seller financing, or rate buy-down credit?
- Why hasn't it sold? Are there any deal-killer items the seller is aware of (foundation, flood, title, zoning, code violations)?
- Is there a deadline driving the sale (1031 exchange, divorce, estate, relocation)? That informs how much negotiation room exists.
- The area grade is low — what's the realistic commute time and amenity access for the typical tenant pool here? Any planned neighborhood developments (good or bad) we should know about?
- What's the average days-on-market for RENTAL listings here right now (not sales)? A rising rental-DOM trend means longer vacancies and softer asking-rent achievability than the comps imply.
- What's the recent tenant-quality profile in this submarket — average credit score on applications, eviction rate, late-payment / NSF rate, and stable-employment percentage? A property-management company in the area should have these aggregated.
- How much new for-sale + rental construction is in the pipeline within 1–3 miles? Heavy new supply typically softens prices + rents 12–24 months out; constrained supply supports both.
Investment metrics
- 1% rule
- 0.92% ✗
- Cap rate
- 6.74%
- Cash-on-cash
- 1.59%
- DSCR
- 1.07
- GRM
- 9.0
CMA / ARV
- ARV (on-the-fly)
- $279,544
- Comps found
- 12
Show comp detail 12 sales within ~0.75 mi
| Address | Dist | Beds/Ba | Sqft | Sold | Price | $/sf | Match |
|---|---|---|---|---|---|---|---|
| 10273 Greystone Dr | 0.03mi | 4/2.0 | 1,684 (0%) | 4mo | $289,990 | $172 | 96 |
| 10364 Greystone Dr | 0.16mi | 4/2.0 | 1,684 (0%) | 0mo | $297,990 | $177 | 92 |
| 10286 Greystone Dr | 0.06mi | 4/2.0 | 1,684 (0%) | 12mo | $279,990 | $166 | 87 |
| 10304 Greystone Dr | 0.10mi | 4/2.0 | 1,684 (0%) | 11mo | $283,990 | $169 | 86 |
| 10318 Greystone Dr | 0.12mi | 4/2.0 | 1,684 (0%) | 10mo | $279,990 | $166 | 86 |
| 10340 Greystone Dr | 0.15mi | 4/2.0 | 1,773 (+5%) | 4mo | $276,000 | $156 | 81 |
| 10327 Greystone Dr | 0.11mi | 4/2.0 | 1,773 (+5%) | 6mo | $259,888 | $147 | 81 |
| 10298 Greystone Dr | 0.08mi | 4/2.0 | 1,773 (+5%) | 12mo | $289,990 | $164 | 78 |
| 10310 Greystone Dr | 0.11mi | 4/2.0 | 1,773 (+5%) | 11mo | $299,990 | $169 | 77 |
| 10554 Hillside Dr | 0.42mi | 3/2.0 (-1) | 1,659 (-2%) | 11mo | $269,250 | $162 | 64 |
| 10622 St Marys Cir W | 0.44mi | 3/2.0 (-1) | 1,792 (+6%) | 20mo | $340,000 | $190 | 47 |
| 878 Jacqueline Cir | 0.74mi | 4/2.0 | 1,539 (-9%) | 14mo | $255,000 | $166 | 39 |
Match score weights: distance 35% · size 25% · config 20% · recency 20%. Top-matched comps best support the ARV.
Projected returns pro-forma
-3.0% appreciation · 3.0% rent growth · sell at horizon
- IRR
- -13.7%
- Equity multiple
- 0.51×
- Total profit
- $-38,640
- Equity at exit
- $41,681
- IRR
- -4.9%
- Equity multiple
- 0.68×
- Total profit
- $-24,966
- Equity at exit
- $24,170
Cash invested: $78,272 (down + closing). Projections, not guarantees.
Landlord ↔ Tenant lean methodology
- Overall (STATE)
- 87 Strongly Landlord-Friendly
- State Florida
- 87 Strongly Landlord-Friendly · R+3
- County
- — inherits STATE
- City
- — inherits STATE
ZIP-level market 32040
- Home prices YoY
- -10.6%
- Active inventory
- 63
- Price-to-rent
- 9.3×
Monthly cashflow live
- Estimated rent
- $2,577 medium interval (Pro) →
- Mortgage (P&I)
- −$1,466
- Tax est. 1.5%
- −$349 /mo · $4,193/yr
- Insurance
- −$116
- HOA
- −$0
- Vacancy / Maint / Mgmt
- −$541
- Net cashflow
- $104
Break-even live
Sensitivity live
| Price | -10% $297 | -5% $201 | +0% $104 | +5% $7 | +10% $-89 |
|---|---|---|---|---|---|
| Rent | -10% $-100 | -5% $2 | +0% $104 | +5% $206 | +10% $308 |
| Rate | -1.0pp $245 | -0.5pp $175 | base $104 | +0.5pp $31 | +1.0pp $-42 |
UW: 25.0% down · 7.5% · 30yr · 1.5% tax · 5.0% vac · 8.0% maint · 8.0% mgmt
Financing live
Cash to close
- Down payment
- $69,886
- Closing costs
- $8,386
- Reserves months
- —
- Total cash needed
- —
Loan-product check · same deal, 3 products live
Conventional
25% down · 7.5% · 30yr
- Down + closing
- —
- Monthly P&I
- —
- Monthly cashflow
- —
- DSCR
- —
- Eligible?
- —
Personal DTI + credit; lowest rate.
DSCR
20% down · 8.5% · 30yr
- Down + closing
- —
- Monthly P&I
- —
- Monthly cashflow
- —
- DSCR
- —
- Eligible?
- —
No personal income docs; deal must DSCR.
Hard money
10% down · 12.0% · 12mo
- Down + closing
- —
- Monthly P&I
- —
- Monthly cashflow
- —
- DSCR
- —
- Eligible?
- —
Short-term bridge; refi at stabilization.
Listing history 16 events
-
2026-06-21days on market $288,990 Active 296 DOM
-
2026-06-19days on market $288,990 Active 294 DOM
-
2026-06-18days on market $288,990 Active 293 DOM
-
2026-06-17days on market $288,990 Active 292 DOM
-
2026-06-16days on market $288,990 Active 291 DOM
-
2026-06-15days on market $288,990 Active 290 DOM
-
2026-06-14days on market $288,990 Active 288 DOM
-
2026-06-12days on market $288,990 Active 287 DOM
-
2026-06-09days on market $288,990 Active 284 DOM
-
2026-06-08days on market $288,990 Active 283 DOM
-
2026-06-07days on market $288,990 Active 282 DOM
-
2026-06-05days on market $288,990 Active 279 DOM
-
2026-06-02days on market $288,990 Active 277 DOM
-
2026-06-01days on market $288,990 Active 276 DOM
-
2026-05-31days on market $288,990 Active 275 DOM
-
2026-05-30days on market $288,990 Active 274 DOM
ⓘ Source: listings_history table (triggers on properties + properties_extension) + one-shot
backfill from property_details.listing_events for pre-trigger history.
Climate risk First Street
- Flood 1/10 Low FEMA zone X (unshaded) · 0% chance over 30 yrs
- Wildfire 6/10 Major
- Heat 8/10 Severe 7 d/yr ≥107°F today · 20 d/yr by 30 yrs out
- Wind 9/10 Extreme 99% chance of damaging wind over 30 yrs
- Air quality 5/10 Major 7 unhealthy d/yr today · 8 by 30 yrs out
Nearby sold comps map
Loading sold comps map…
Walkable amenities ~0.75 mi
Loading nearby amenities…
Taxation est. · year 1
- Rental income
- $30,923
- − Mortgage interest
- −$15,659
- − Property taxes
- −$4,193
- − Insurance
- −$1,398
- − Repairs & maintenance
- −$2,474
- − Management
- −$2,474
- − Depreciation
- −$8,132
- Taxable loss
- −$3,406
- Est. tax savings @ 24.0%
- +$817
- After-tax cash flow
- $2,065/yr
For passive investors: Depreciation is non-cash, so a rental often shows a tax loss while cash-flowing — sheltering income. Rental losses are passive: they offset passive income freely, and up to $25,000/yr can offset ordinary (W-2) income if you actively participate and your MAGI is under $100k (phasing out to $0 by $150k); unused losses carry forward. On sale, claimed depreciation is recaptured at up to 25%, and gains may owe capital-gains tax (a 1031 exchange can defer both). Figures are a year-1 estimate at your 24.0% rate — not tax advice; consult a CPA.
Schools (NCES district)
- District
- Baker
- NCES district ID
- 1200060
- Math proficiency
- 53% ▼ -6.00%
- Reading proficiency
- 49% ▼ -3.00%
- Median HH income
- $50,301
- Composite
- 43.67/100
- National rank
- #2958
- State rank
- #28 of 73 in FL
Livability — Glen St. Mary
No livability data for this city. (Only ~50 U.S. cities are tracked.)
Census & demographics
- Population (ZIP)
- 8,754
Population outlook (Baker County) Hauer SSP2
- Today (2025)
- 27,607 people
- By 2030
- 27,452 · -0.6%
- By 2040
- 26,637 · -3.5%
- By 2050
- 25,103 · -9.1%
- By 2075
- 19,576 · -29.1%
- By 2100
- 11,664 · -57.7%
Race, ethnicity, and origin ACS 2023
- Neighborhood character
- Predominantly White (88%)
- Race & ethnicity
- White 88% Two or more races 8% Hispanic / Latino 3% Black 3%
- Common ancestry
- Serbian 3% Slovak 2% Lithuanian 1%
- Foreign-born
- 1% · Canada
- Languages at home
- 98% English-only · Spanish 1% French/Haitian/Cajun 1%
Political lean MEDSL · Baker
- 2024 margin
- Solid R (+73.1) · D 13.2% · R 86.3%
- 2008→2024 swing
- -15.7pp toward R · 2008: -57.4pp · 2024: -73.1pp
- All cycles
- 2024: R+73.1 2020: R+70.2 2016: R+64.8 2012: R+58.6 2008: R+57.4
Not yet ingested
- Civics
- —
Market trends
- HPI YoY
- ▼ -25.72%
- Current HPI
- 216.151
- Rent YoY
- —
- Metro
- —
- State GDP YoY
- ▲ 3.28%
- F500 in state
- 36
Industry mix (Fortune 500 HQ in FL)
| Industry | F500 HQs | Revenue |
|---|---|---|
| Industrial Technology | 2 | $29B |
|
||
| Insurance | 2 | $17B |
|
||
| Retail | 1 | $60B |
|
||
| Technology Distribution | 1 | $58B |
|
||
| Homebuilding | 1 | $35B |
|
||
| Technology Manufacturing | 1 | $35B |
|
||
Cash-flow waterfall
monthlySold comps — $/sqft
last 12 mo · ≤1 miLoading sold comps…