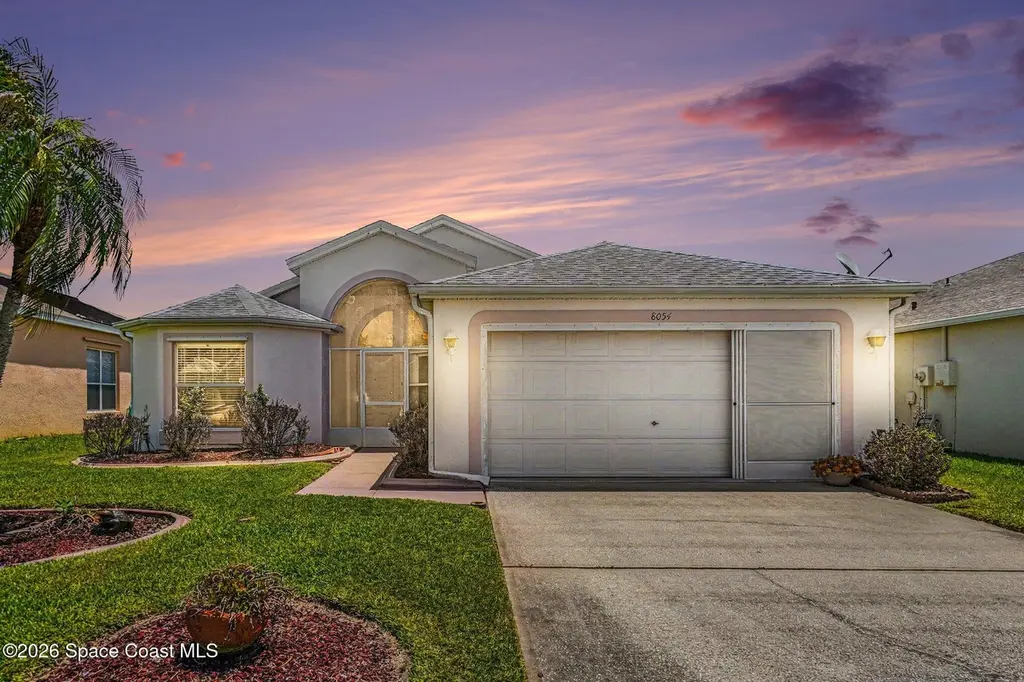
8054 Bracken Ln · Viera East, FL
Flood risk 1/10 · Minimal
- FEMA flood zone
- X (unshaded)
- Chance of flooding over 30 yrs
- 0.0%
- Est. flood insurance / yr
- $507 – $1,088
Fire risk 3/10 · Minor
- Est. fire insurance / yr
- $947 – $1,759
Heat risk 10/10 · Severe
- Hot days now (above 104°F)
- 7 days/yr
- Hot days in 30 yrs
- 22 days/yr
Wind risk 10/10 · Severe
- Chance of severe wind over 30 yrs
- 99.0%
Air-quality risk 1/10 · Minimal
- Unhealthy air days now
- 0 days/yr
- Unhealthy air days in 30 yrs
- 0 days/yr
Risk factors via First Street. Map © Google.
Why this score? — see what drove the D grade
The composite is a weighted blend of 9 inputs, each scored 0–100. Each bar is that input's sub-score; the figure is the points it added to the 100-point composite (weight × sub-score).
- Cash flow +11.7/30.0
- ARV discount +7.5/15.0
- Appreciation +5.2/10.0
- Schools +4.7/10.0
- Livability +4.0/5.0
- DSCR +3.4/10.0
- Rent growth +3.0/5.0
- 1% rule +2.7/10.0
- Condition / age +2.5/5.0
$329,900
🖨 Deal sheet 📄 Offer letter ✓ Due diligence
Listing remarks
Fantastic opportunity in Viera's desirable Hammock Trace! This classic 1997-built home features 3 bedrooms, 2 full bathrooms, and a 2-car garage across 1,577 sq ft of living area. Zoned for excellent schools (Quest, Viera Middle, Viera High) and offering low HOA fees, the location simply can't be beat. You are just around the corner from The Avenue Viera, local parks, and top-tier shopping. This property is a great blank canvas ready for its next chapter making it an ideal find for buyers looking to build equity in a premium 32940 zip code. Schedule your showing today!
Key facts
- Low hoa fees
- 5,663 sq ft lot
- 2 garage spots
Tags
Property features AI
Finance
- Other: Lot approx. 0.13 acres; Living area listed as 1,577 (building total 1,977); Currently used as a single family home
- HOA & community: Located in Hammock Trace association; Annual association fee: $435; Additional annual fee: $240
Exterior
- Parking: 2-car garage
- Utilities: Public sewer; Electricity connected; Water connected; Sewer connected
- Home design: Single family residence; Faces west
- Construction: Concrete and stucco construction; Built with foundation and standard residential construction
- Exterior features: Front and rear porches; Screened rear porch; Wood fencing around backyard; Shingle roof
Interior
- Kitchen: Dishwasher; Disposal; Electric range; Microwave; Refrigerator
- Bedrooms: 3 bedrooms
- Flooring: Carpet; Laminate; Tile
- Bathrooms: 2 full bathrooms
- Heating & cooling: Central heating (electric); Central air (electric)
- Interior features: Breakfast bar; Ceiling fans; Eat-in kitchen; Open floorplan; Pantry; Split bedroom layout; Vaulted ceilings; Walk-in closets
- Laundry & utility: Washer hookup; Electric dryer hookup
Neighborhood map
What this means for you Summary
Snapshot
- This is a 3-bed/2.0-bath single-family listed at $330k.
Deal economics
- At list price, monthly cash flow is $-98 ($-1k/yr) — negative.
- To cash-flow at today's rent, offer at most $313k (5.3% below list).
- To meet the 1% rule (rent ≥ 1% of price), the offer needs to be $255k (22.6% below list).
- Recommended offer: $255k (22.6% below list) — sets the bar for 1% rule.
Location & tenants
- Location reads 79/100 on livability (#141 in FL, #1,964 nationally) — a middle-class / working-renter tenant base. Strengths: crime A+, employment A+, housing A+; Watch: commute D+, amenities F.
- Brevard (suburban): math 53% / reading 57% proficiency, ranked #19 of 73 in FL (top 26%) — acceptable for families but not a draw, mixed tenant base, ~2y average lease.
- Zoned schools: Quest Elementary School (math 83% / reading 80%, grade A+, #90 of 2,144 statewide, top 4%, 691 students, 20% FRL); Viera High School (math 58% / reading 71%, grade B-, #78 of 667 statewide, top 13%, 2,289 students, 15% FRL) — zoned schools average 17% FRL vs 43% district-wide (26 pts lower); this property's tenant base skews higher-income than the district average.
- Zoned-school proficiency averages 73% at this address vs 55% district-wide (+18 pts) — the actual schools serving this property are materially stronger than the Brevard average implies; a family-tenant draw the district grade alone would hide.
- Market conditions: Rents rising (+2.0%/yr); 583 active listings in the ZIP; 21 comparable units currently listed for rent nearby; rentals at typical pace (median 19d on market — plan ~3-4 weeks tenant-placement turnaround); high-income renter base; 4,602 units permitted in Brevard County in 2024 (702 in 5+ unit buildings).
Forward outlook
- In year one you build about $4k of equity ($2k loan paydown + $1k appreciation (0.4% local appreciation)).
- Brevard County population projected at +15% by 2050 — modest demand growth; plan on rents tracking national, not racing it.
- By year 8, paydown + projected appreciation supports a ~$32k cash-out refi (75% LTV) — recoverable capital for the next deal without selling this one.
Negotiation context
- Only 1 days on market — expect competitive offers; lowballing is unlikely to land.
- Current owner paid $104k; list at $330k implies a 217% gain — meaningful room to come down on a strong offer.
Risks & watch-outs
- Climate carrying-cost: severe wind risk, 99% chance of damaging wind over 30y; extreme-heat days projected 7→22/yr by 2055 (HVAC capex compounding) — expect insurance premiums to compound above CPI over the hold.
Questions for the listing agent
- What do current leases actually rent for vs. the listed asking? Can we see a recent rent roll and the last 12 months of T-12 income?
- What does the HOA fee cover, when was the last increase, and are there any pending special assessments or reserve-fund shortfalls?
- Is there a deadline driving the sale (1031 exchange, divorce, estate, relocation)? That informs how much negotiation room exists.
- Schools are F-rated, which usually means shorter tenancies and higher turnover. Who's the typical renter profile here, and what's been the actual vacancy rate?
- The area grade is low — what's the realistic commute time and amenity access for the typical tenant pool here? Any planned neighborhood developments (good or bad) we should know about?
- What's the average days-on-market for RENTAL listings here right now (not sales)? A rising rental-DOM trend means longer vacancies and softer asking-rent achievability than the comps imply.
- What's the recent tenant-quality profile in this submarket — average credit score on applications, eviction rate, late-payment / NSF rate, and stable-employment percentage? A property-management company in the area should have these aggregated.
- How much new for-sale + rental construction is in the pipeline within 1–3 miles? Heavy new supply typically softens prices + rents 12–24 months out; constrained supply supports both.
Investment metrics
- 1% rule
- 0.77% ✗
- Cap rate
- 5.94%
- Cash-on-cash
- -1.28%
- DSCR
- 0.94
- GRM
- 10.8
CMA / ARV
No comps found within radius.
Projected returns pro-forma
0.4% appreciation · 1.96% rent growth · sell at horizon
- IRR
- -2.8%
- Equity multiple
- 0.87×
- Total profit
- $-12,310
- Equity at exit
- $102,497
- IRR
- 2.0%
- Equity multiple
- 1.23×
- Total profit
- $20,871
- Equity at exit
- $128,693
Cash invested: $92,372 (down + closing). Projections, not guarantees.
Landlord ↔ Tenant lean methodology
- Overall (STATE)
- 87 Strongly Landlord-Friendly
- State Florida
- 87 Strongly Landlord-Friendly · R+3
- County
- — inherits STATE
- City
- — inherits STATE
ZIP-level market 32940
- Home prices YoY
- 0.1%
- Rents YoY
- 2.0%
- Active inventory
- 583
- Price-to-rent
- 10.8×
Monthly cashflow live
- Estimated rent
- $2,552 high interval (Pro) →
- Mortgage (P&I)
- −$1,730
- Tax from tax record
- −$191 /mo · $2,292/yr
- Insurance
- −$137
- HOA
- −$56
- Vacancy / Maint / Mgmt
- −$536
- Net cashflow
- $-98
Break-even live
UW: 25.0% down · 7.5% · 30yr · 1.5% tax · 5.0% vac · 8.0% maint · 8.0% mgmt
Financing live
Cash to close
- Down payment
- $82,475
- Closing costs
- $9,897
- Reserves months
- —
- Total cash needed
- —
Loan-product check · same deal, 3 products live
Conventional
25% down · 7.5% · 30yr
- Down + closing
- —
- Monthly P&I
- —
- Monthly cashflow
- —
- DSCR
- —
- Eligible?
- —
Personal DTI + credit; lowest rate.
DSCR
20% down · 8.5% · 30yr
- Down + closing
- —
- Monthly P&I
- —
- Monthly cashflow
- —
- DSCR
- —
- Eligible?
- —
No personal income docs; deal must DSCR.
Hard money
10% down · 12.0% · 12mo
- Down + closing
- —
- Monthly P&I
- —
- Monthly cashflow
- —
- DSCR
- —
- Eligible?
- —
Short-term bridge; refi at stabilization.
Rent comps 21 comps
| Address | Beds | Baths | Sqft | Rent | $/sqft | DOM | Units | Dist |
|---|---|---|---|---|---|---|---|---|
| 660 Wickham Lakes Dr Melbourne, FL | 3.0 | 2.0 | 1521 | $2,500 | $1.64 | 23d | 1 | 0.69mi |
| 1390 Hampton Park Ln Melbourne, FL | 2.0 | 2.5 | 1110 | $1,900 | $1.71 | 23d | 1 | 0.76mi |
| 531 Steeplechase Ln Melbourne, FL | 2.0 | 1.5 | 1110 | $1,875 | $1.69 | 23d | 1 | 0.77mi |
| 2439 Casona Ln Melbourne, FL | 1.0–2.0 | 1.0–2.0 | 964 | $2,251 | $2.34 | 13d | 14 | 0.78mi |
| 7578 Highsmith Rd Melbourne, FL | 1.0–3.0 | 1.0–2.0 | 1155 | $3,703 | $3.20 | 13d | 32 | 0.80mi |
| 8880 Napolo Dr Melbourne, FL | 4.0 | 3.5 | 2250 | $3,600 | $1.60 | 23d | 1 | 0.80mi |
| 1092 Egret Lake Way Melbourne, FL | 4.0 | 3.0 | 2218 | $2,750 | $1.24 | 23d | 1 | 0.85mi |
| 1311 Hampton Park Ln Melbourne, FL | 2.0 | 3.0 | 1110 | $1,850 | $1.67 | 23d | 1 | 0.87mi |
| 1306 Hampton Park Ln Melbourne, FL | 2.0 | 3.0 | 1110 | $1,700 | $1.53 | 14d | 1 | 0.88mi |
| 6705 Shadow Creek Trl Melbourne, FL | 1.0–3.0 | 1.0–2.0 | 1123 | $2,795 | $2.49 | 13d | 25 | 0.97mi |
| 2992 Rodina Dr Melbourne, FL | 1.0–2.0 | 1.0–2.0 | 963 | $2,585 | $2.68 | 14d | 8 | 1.02mi |
| 6431 Borasco Dr Melbourne, FL | 1.0–2.0 | 1.0–2.0 | 869 | $1,950 | $2.24 | 18d | 2 | 1.06mi |
| 300 Tuscany Way Melbourne, FL | 1.0–3.0 | 1.0–2.0 | 1097 | $2,269 | $2.07 | 23d | 12 | 1.07mi |
| 2185 Judge Fran Jamieson Way Melbourne, FL | 1.0–3.0 | 1.0–2.0 | 1192 | $2,365 | $1.98 | 13d | 17 | 1.11mi |
| 6411 Borasco Dr Melbourne, FL | 2.0–3.0 | 2.0 | 1258 | $2,195 | $1.74 | 23d | 1 | 1.12mi |
| 2601 Trasona Dr Melbourne, FL | 3.0 | 2.0 | 1656 | $2,749 | $1.66 | 23d | 1 | 1.20mi |
| 7667 N Wickham Rd Melbourne, FL | 1.0–2.0 | 1.0–2.0 | 915 | $1,750 | $1.91 | 14d | 2 | 1.26mi |
| 2560 Judge Fran Jamieson Way Melbourne, FL | 1.0–3.0 | 1.0–2.0 | 1091 | $2,660 | $2.44 | 13d | 14 | 1.34mi |
| 201 Plantation Club Dr Melbourne, FL | 1.0–2.0 | 1.0–2.0 | 1025 | $1,870 | $1.82 | 13d | 10 | 1.40mi |
| 1914 Jacques Dr Melbourne, FL | 3.0 | 2.0 | 1575 | $3,400 | $2.16 | 23d | 1 | 1.45mi |
| 8134 Loren Cove Dr Melbourne, FL | 3.0 | 2.0 | 1647 | $2,900 | $1.76 | 14d | 1 | 1.45mi |
HOA detail
- Monthly dues
- $56 · $672/yr
Listing history 2 events
-
2026-06-18remarks 575-char remark
-
2026-06-18$329,900 Active 1 DOM
ⓘ Source: listings_history table (triggers on properties + properties_extension) + one-shot
backfill from property_details.listing_events for pre-trigger history.
Tax reassessment forecast FL · Resets to sale price
- Current annual tax
- $2,292 · $191/mo
- Projected year-2 tax
- $2,738 · $228/mo
- Expected delta
- +$446/yr (+$37/mo · 19.4%)
ⓘ Screening estimate from a state-policy table — verify with the county assessor before closing.
Climate risk First Street
- Flood 1/10 Low FEMA zone X (unshaded) · 0% chance over 30 yrs
- Wildfire 3/10 Moderate
- Heat 10/10 Extreme 7 d/yr ≥104°F today · 22 d/yr by 30 yrs out
- Wind 10/10 Extreme 99% chance of damaging wind over 30 yrs
- Air quality 1/10 Low 0 unhealthy d/yr today · 0 by 30 yrs out
Nearby sold comps map
Loading sold comps map…
Walkable amenities ~0.75 mi
Loading nearby amenities…
Taxation est. · year 1
- Rental income
- $30,627
- − Mortgage interest
- −$18,480
- − Property taxes
- −$2,292
- − Insurance
- −$1,650
- − Repairs & maintenance
- −$2,450
- − Management
- −$2,450
- − HOA
- −$672
- − Depreciation
- −$9,597
- Taxable loss
- −$6,963
- Est. tax savings @ 24.0%
- +$1,671
- After-tax cash flow
- $493/yr
For passive investors: Depreciation is non-cash, so a rental often shows a tax loss while cash-flowing — sheltering income. Rental losses are passive: they offset passive income freely, and up to $25,000/yr can offset ordinary (W-2) income if you actively participate and your MAGI is under $100k (phasing out to $0 by $150k); unused losses carry forward. On sale, claimed depreciation is recaptured at up to 25%, and gains may owe capital-gains tax (a 1031 exchange can defer both). Figures are a year-1 estimate at your 24.0% rate — not tax advice; consult a CPA.
Schools (NCES district)
- District
- Brevard
- NCES district ID
- 1200150
- Math proficiency
- 53% ▼ -9.00%
- Reading proficiency
- 57% ▼ -4.00%
- Median HH income
- $49,426
- Composite
- 46.86/100
- National rank
- #2370
- State rank
- #19 of 73 in FL
Livability — Viera East
- Score
- 79/100
- State rank
- #141
- US rank
- #1964
Category grades
Schools grade is shown separately in the Schools card above.
Census & demographics
- Census place
- Viera East, FL
- County
- Brevard County · 602,871 people
- Metro
- Palm Bay-Melbourne-Titusville, FL
- Population (ZIP)
- 51,727
- Household income
- $110,495
- Rent vs Own
- Severe rent burden
- 873.0
Population outlook (Brevard County) Hauer SSP2
- Today (2025)
- 623,254 people
- By 2030
- 648,420 · +4.0%
- By 2040
- 690,009 · +10.7%
- By 2050
- 715,669 · +14.8%
- By 2075
- 775,744 · +24.5%
- By 2100
- 776,687 · +24.6%
Race, ethnicity, and origin ACS 2023
- Neighborhood character
- Predominantly White (77%)
- Race & ethnicity
- White 77% Hispanic / Latino 10% Two or more races 9% Asian 5% Black 3%
- Hispanic origin (detail)
- Mexican 1% Puerto Rican 3% Cuban 1%
- Common ancestry
- Romanian 4% Lithuanian 3% Slovak 2%
- Foreign-born
- 11% · Canada, Jamaica, China
- Languages at home
- 88% English-only · Spanish 6% Other Indo-European 2% German/W. Germanic 1%
Political lean MEDSL · Brevard
- 2024 margin
- Strong R (+20.8) · D 39.1% · R 59.9% · Other 1.0%
- 2008→2024 swing
- -10.4pp toward R · 2008: -10.4pp · 2024: -20.8pp
- All cycles
- 2024: R+20.8 2020: R+16.4 2016: R+19.8 2012: R+12.7 2008: R+10.4
Not yet ingested
- Civics
- —
Market trends
- HPI YoY
- ▲ 0.40%
- Current HPI
- 298.1023
- Rent YoY
- ▲ 1.96%
- Metro
- Palm Bay-Melbourne-Titusville, FL
- State GDP YoY
- ▲ 3.28%
- F500 in state
- 36
Industry mix (Fortune 500 HQ in FL)
| Industry | F500 HQs | Revenue |
|---|---|---|
| Industrial Technology | 2 | $29B |
|
||
| Insurance | 2 | $17B |
|
||
| Retail | 1 | $60B |
|
||
| Technology Distribution | 1 | $58B |
|
||
| Homebuilding | 1 | $35B |
|
||
| Technology Manufacturing | 1 | $35B |
|
||
Price history
+216.6% since first listed2 events — show timeline
- 2026-06-18 Listed $329,900 SCMLS
- 1996-07-19 Sold (Public Records) $104,200 Public Records
Property tax history
+0.9%/yrLatest (2025): $2,292 · +7.5% YoY. Source: county tax records.
Cash-flow waterfall
monthlySold comps — $/sqft
last 12 mo · ≤1 miLoading sold comps…