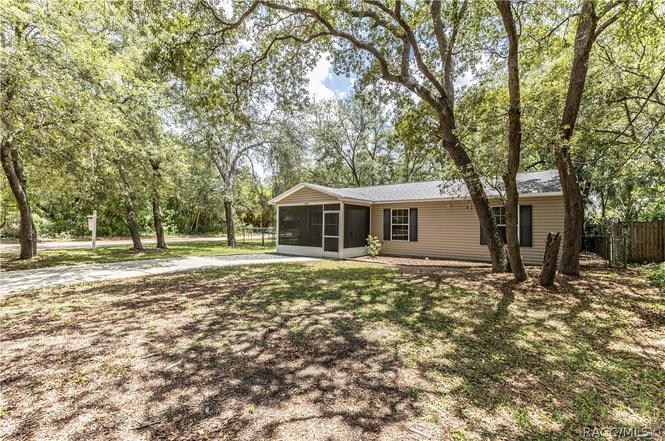
4438 Calamondin St · Lady Lake, FL
Flood risk 1/10 · Minimal
- FEMA flood zone
- X (unshaded)
- Chance of flooding over 30 yrs
- 0.0%
- Est. flood insurance / yr
- $507 – $1,088
Fire risk 3/10 · Minor
- Est. fire insurance / yr
- $947 – $1,759
Heat risk 8/10 · Major
- Hot days now (above 108°F)
- 7 days/yr
- Hot days in 30 yrs
- 21 days/yr
Wind risk 9/10 · Severe
- Chance of severe wind over 30 yrs
- 99.0%
Air-quality risk 3/10 · Minor
- Unhealthy air days now
- 2 days/yr
- Unhealthy air days in 30 yrs
- 4 days/yr
Risk factors via First Street. Map © Google.
Why this score? — see what drove the C grade
The composite is a weighted blend of 9 inputs, each scored 0–100. Each bar is that input's sub-score; the figure is the points it added to the 100-point composite (weight × sub-score).
- Cash flow +22.3/30.0
- ARV discount +8.8/15.0
- DSCR +7.1/10.0
- 1% rule +4.9/10.0
- Schools +4.2/10.0
- Rent growth +3.5/5.0
- Livability +3.5/5.0
- Condition / age +2.5/5.0
- Appreciation +0.0/10.0
$210,000
🖨 Deal sheet (PDF) 📄 Offer letter ✓ Due diligence
Listing remarks
Don’t miss this beautifully renovated home in Lady Lake, located in the desirable Carlton Village community and close to The Villages, with NO HOA fees. Nestled in a peaceful setting with mature trees, this property offers both privacy and charm. The home features 3 bedrooms and 1 fully updated bathroom, and welcomes you with an inviting front porch ideal for relaxing outdoors. The kitchen boasts brand-new stainless steel appliances, abundant cabinetry, and generous counter space—perfect for daily living and entertaining alike. The completely remodeled bathroom complements the fresh, modern interior. Luxury vinyl flooring throughout enhances comfort and durability, providing eas
Key facts
- Renovated home
- Inviting front porch
- No hoa fees
Tags
Property features AI
Finance
- Other: Property zoning R-1; Lot approximately 0.17 acres (0.17 acre); Road surface: dirt; Living area about 1,120 square feet; Unfurnished; No CDD; No homestead; Lease restrictions not indicated; Universal property identifier available; Directions available
Exterior
- Utilities: Public water; Public sewer; Electricity connected
- Home design: Single family residence; Residential property; One story; Faces north
- Construction: Vinyl siding; Shingle roof; Slab foundation; Built on slab
- Exterior features: Chain link fencing; Other exterior features
Interior
- Kitchen: Dishwasher; Range; Refrigerator
- Bedrooms: 3 bedrooms
- Bathrooms: 1 full bathroom
- Heating & cooling: Central heating; Central air conditioning
- Interior features: Ceiling fans
- Laundry & utility: Other laundry features
Neighborhood map
What this means for you Summary
Snapshot
- This is a 3-bed/2.0-bath single-family listed at $210k.
Deal economics
- At list price, monthly cash flow is $346 ($4k/yr) — positive.
- The deal already cash-flows at list — no discount required.
- To meet the 1% rule (rent ≥ 1% of price), the offer needs to be $208k (0.8% below list).
- Recommended offer: $185k (12.0% below list) — sets the bar for market timing.
- Cap rate 8.3% vs local median 4.2% in Lady Lake — top-decile yield for the area; either an underpriced asset or a hidden risk that comps aren't pricing in. Stress-test before assuming the spread holds.
Location & tenants
- Location reads 69/100 on livability (#457 in FL) — a middle-class / working-renter tenant base. Strengths: cost of living A+, housing A+, health & safety A-; Watch: employment D, amenities F, commute F.
- Lake (suburban): math 49% / reading 50% proficiency, ranked #37 of 73 in FL (top 51%) — families likely to look elsewhere, expect single-tenant / working-renter base with shorter leases.
- Zoned schools: The Villages Elementary of Lady Lake School (math 63% / reading 61%, grade B, #608 of 2,144 statewide, top 29%, 761 students, 61% FRL); Carver Middle School (math 41% / reading 41%, grade F, #353 of 571 statewide, top 63%, 837 students, 65% FRL); Leesburg High School (math 24% / reading 32%, grade F, #464 of 667 statewide, top 70%, 1,641 students, 58% FRL).
- Market conditions: Rents rising fast (+4.0%/yr); 590 active listings in the ZIP; 2 comparable units currently listed for rent nearby; 4,799 units permitted in Lake County in 2024 (814 in 5+ unit buildings).
- This rent runs 43% of the median local income ($59k/yr) — at the standard rent-burdened threshold; future hikes will face affordability resistance.
Forward outlook
- Local home prices are declining (-3.0%/yr); year-one equity from $1k of loan paydown is wiped out by about $6k of value loss. Plan a longer hold.
- Lake County population projected at +37% by 2050 — long-run rental-demand tailwind backs the buy-and-hold thesis.
Negotiation context
- It's been on market 140 days — a 12% lower offer ($185k) is reasonable based on typical stale-listing flexibility.
- Current owner paid $171k; 23% above their basis — modest negotiation headroom, anchor on the comps not their cost.
Risks & watch-outs
- Climate carrying-cost: severe wind risk, 99% chance of damaging wind over 30y; extreme-heat days projected 7→21/yr by 2055 (HVAC capex compounding) — expect insurance premiums to compound above CPI over the hold.
Questions for the listing agent
- It's been on market 140 days. Have you received any prior offers? Is the seller open to a 12% concession, seller financing, or rate buy-down credit?
- Why hasn't it sold? Are there any deal-killer items the seller is aware of (foundation, flood, title, zoning, code violations)?
- Is there a deadline driving the sale (1031 exchange, divorce, estate, relocation)? That informs how much negotiation room exists.
- Schools are B-rated — typically a magnet for longer-tenancy family renters. What's the average tenant stay here, and is there a school-zone premium baked into asking?
- What's the average days-on-market for RENTAL listings here right now (not sales)? A rising rental-DOM trend means longer vacancies and softer asking-rent achievability than the comps imply.
- What's the recent tenant-quality profile in this submarket — average credit score on applications, eviction rate, late-payment / NSF rate, and stable-employment percentage? A property-management company in the area should have these aggregated.
- How much new for-sale + rental construction is in the pipeline within 1–3 miles? Heavy new supply typically softens prices + rents 12–24 months out; constrained supply supports both.
Investment metrics
- 1% rule
- 0.99% ✗
- Cap rate
- 8.27%
- Cash-on-cash
- 7.06%
- DSCR
- 1.31
- GRM
- 8.4
CMA / ARV
- ARV (on-the-fly)
- $216,160
- Comps found
- 7
Show comp detail 7 sales within ~0.75 mi
| Address | Dist | Beds/Ba | Sqft | Sold | Price | $/sf | Match |
|---|---|---|---|---|---|---|---|
| 40206 Palm St | 0.28mi | 3/2.0 | 1,049 (-6%) | 0mo | $240,000 | $229 | 76 |
| 40103 Dogwood Way | 0.03mi | 3/2.0 | 1,067 (-5%) | 22mo | $200,000 | $187 | 72 |
| 40229 Palm St | 0.37mi | 3/2.0 | 1,184 (+6%) | 18mo | $230,700 | $195 | 58 |
| 4024 Elm St | 0.51mi | 3/2.0 | 1,242 (+11%) | 6mo | $225,000 | $181 | 53 |
| 4043 Lake Griffin Rd | 0.51mi | 3/2.0 | 1,183 (+6%) | 23mo | $165,000 | $139 | 48 |
| 39828 Grays Airport Rd | 0.51mi | 3/2.0 | 1,203 (+7%) | 23mo | $235,000 | $195 | 44 |
| 39746 Magnolia St | 0.41mi | 2/1.0 (-1) | 1,008 (-10%) | 23mo | $194,900 | $193 | 36 |
Match score weights: distance 35% · size 25% · config 20% · recency 20%. Top-matched comps best support the ARV.
Projected returns pro-forma
-3.0% appreciation · 4.03% rent growth · sell at horizon
- IRR
- -4.5%
- Equity multiple
- 0.83×
- Total profit
- $-9,889
- Equity at exit
- $31,312
- IRR
- 6.3%
- Equity multiple
- 1.49×
- Total profit
- $28,637
- Equity at exit
- $18,157
Cash invested: $58,800 (down + closing). Projections, not guarantees.
Landlord ↔ Tenant lean methodology
- Overall (STATE)
- 87 Strongly Landlord-Friendly
- State Florida
- 87 Strongly Landlord-Friendly · R+3
- County
- — inherits STATE
- City
- — inherits STATE
ZIP-level market 32159
- Home prices YoY
- -16.0%
- Rents YoY
- 4.0%
- Active inventory
- 590
- Price-to-rent
- 8.4×
Monthly cashflow live
- Estimated rent
- $2,084 medium interval (Pro) →
- Mortgage (P&I)
- −$1,101
- Tax from tax record
- −$112 /mo · $1,343/yr
- Insurance
- −$88
- HOA
- −$0
- Lot rent
- −$0
- Vacancy / Maint / Mgmt
- −$438
- Net cashflow
- $346
Break-even live
Sensitivity live
| Price | -10% $465 | -5% $405 | +0% $346 | +5% $286 | +10% $227 |
|---|---|---|---|---|---|
| Rent | -10% $181 | -5% $263 | +0% $346 | +5% $428 | +10% $510 |
| Rate | -1.0pp $451 | -0.5pp $399 | base $346 | +0.5pp $291 | +1.0pp $236 |
UW: 25.0% down · 7.5% · 30yr · 1.5% tax · 5.0% vac · 8.0% maint · 8.0% mgmt
Financing live
Cash to close
- Down payment
- $52,500
- Closing costs
- $6,300
- Reserves months
- —
- Total cash needed
- —
Loan-product check · same deal, 3 products live
Conventional
25% down · 7.5% · 30yr
- Down + closing
- —
- Monthly P&I
- —
- Monthly cashflow
- —
- DSCR
- —
- Eligible?
- —
Personal DTI + credit; lowest rate.
DSCR
20% down · 8.5% · 30yr
- Down + closing
- —
- Monthly P&I
- —
- Monthly cashflow
- —
- DSCR
- —
- Eligible?
- —
No personal income docs; deal must DSCR.
Hard money
10% down · 12.0% · 12mo
- Down + closing
- —
- Monthly P&I
- —
- Monthly cashflow
- —
- DSCR
- —
- Eligible?
- —
Short-term bridge; refi at stabilization.
Rent comps 2 comps
| Address | Beds | Baths | Sqft | Rent | $/sqft | DOM | Units | Dist |
|---|---|---|---|---|---|---|---|---|
| 40045 Palm St Lady Lake, FL | 3.0 | 2.0 | 1429 | $2,350 | $1.64 | 26d | 1 | 0.23mi |
| 40233 Palm St Lady Lake, FL | 2.0 | 2.0 | 1008 | $1,695 | $1.68 | 18d | 1 | 0.37mi |
Listing history 19 events
-
2026-06-22days on market $210,000 Active 140 DOM
-
2026-06-21days on market $210,000 Active 139 DOM
-
2026-06-18days on market $210,000 Active 136 DOM
-
2026-06-17days on market $210,000 Active 135 DOM
-
2026-06-16days on market $210,000 Active 134 DOM
-
2026-06-15days on market $210,000 Active 133 DOM
-
2026-06-13days on market $210,000 Active 131 DOM
-
2026-06-09days on market $210,000 Active 127 DOM
-
2026-06-08days on market $210,000 Active 126 DOM
-
2026-06-07days on market $210,000 Active 125 DOM
-
2026-06-04days on market $210,000 Active 122 DOM
-
2026-06-03days on market $210,000 Active 121 DOM
-
2026-06-02pricedays on market $210,000 Active 120 DOM
-
2026-06-02days on market $220,000 Active 119 DOM
-
2026-05-31days on market $220,000 Active 118 DOM
-
2026-04-08price $220,000
-
2026-02-02$230,000 Active
-
2025-09-25soldstatus $170,800
-
2010-07-19soldstatus $49,599
ⓘ Source: listings_history table (triggers on properties + properties_extension) + one-shot
backfill from property_details.listing_events for pre-trigger history.
Tax reassessment forecast FL · Resets to sale price
- Current annual tax
- $1,343 · $112/mo
- Projected year-2 tax
- $1,743 · $145/mo
- Expected delta
- +$400/yr (+$33/mo · 29.8%)
ⓘ Screening estimate from a state-policy table — verify with the county assessor before closing.
Climate risk First Street
- Flood 1/10 Low FEMA zone X (unshaded) · 0% chance over 30 yrs
- Wildfire 3/10 Moderate
- Heat 8/10 Severe 7 d/yr ≥108°F today · 21 d/yr by 30 yrs out
- Wind 9/10 Extreme 99% chance of damaging wind over 30 yrs
- Air quality 3/10 Moderate 2 unhealthy d/yr today · 4 by 30 yrs out
Nearby sold comps map
Loading sold comps map…
Walkable amenities ~0.75 mi
Loading nearby amenities…
Taxation est. · year 1
- Rental income
- $25,009
- − Mortgage interest
- −$11,763
- − Property taxes
- −$1,343
- − Insurance
- −$1,050
- − Repairs & maintenance
- −$2,001
- − Management
- −$2,001
- − Depreciation
- −$6,109
- Taxable income
- $742
- Est. tax owed @ 24.0%
- −$178
- After-tax cash flow
- $3,971/yr
For passive investors: Depreciation is non-cash, so a rental often shows a tax loss while cash-flowing — sheltering income. Rental losses are passive: they offset passive income freely, and up to $25,000/yr can offset ordinary (W-2) income if you actively participate and your MAGI is under $100k (phasing out to $0 by $150k); unused losses carry forward. On sale, claimed depreciation is recaptured at up to 25%, and gains may owe capital-gains tax (a 1031 exchange can defer both). Figures are a year-1 estimate at your 24.0% rate — not tax advice; consult a CPA.
Schools (NCES district)
- District
- Lake
- NCES district ID
- 1201050
- Math proficiency
- 49% ▼ -7.00%
- Reading proficiency
- 50% ▼ -4.00%
- Median HH income
- $46,632
- Composite
- 42.05/100
- National rank
- #3327
- State rank
- #37 of 73 in FL
Livability — Lady Lake
- Score
- 69/100
- State rank
- #457
- US rank
- #8302
Category grades
Schools grade is shown separately in the Schools card above.
Census & demographics
- County
- Lake County · 364,602 people
- City population
- 32,107
- Metro
- Orlando-Kissimmee-Sanford, FL
- Population (ZIP)
- 32,107
- Household income
- $58,518
- Rent vs Own
- Severe rent burden
- 1047.0
Population outlook (Lake County) Hauer SSP2
- Today (2025)
- 386,640 people
- By 2030
- 417,107 · +7.9%
- By 2040
- 476,676 · +23.3%
- By 2050
- 531,296 · +37.4%
- By 2075
- 648,303 · +67.7%
- By 2100
- 698,530 · +80.7%
Race, ethnicity, and origin ACS 2023
- Neighborhood character
- Predominantly White (86%)
- Race & ethnicity
- White 86% Hispanic / Latino 6% Two or more races 5% Black 4% Asian 1%
- Hispanic origin (detail)
- Puerto Rican 3%
- Common ancestry
- Romanian 4% Lithuanian 3% Slovak 3%
- Foreign-born
- 5% · Canada, Jamaica
- Languages at home
- 93% English-only · Spanish 4% German/W. Germanic 1% Other Indo-European 1%
Political lean MEDSL · Lake
- 2024 margin
- Strong R (+24.7) · D 37.3% · R 62.0%
- 2008→2024 swing
- -11.2pp toward R · 2008: -13.5pp · 2024: -24.7pp
- All cycles
- 2024: R+24.7 2020: R+20.0 2016: R+23.1 2012: R+17.1 2008: R+13.5
Not yet ingested
- Civics
- —
Market trends
- HPI YoY
- ▼ -45.24%
- Current HPI
- 237.6208
- Rent YoY
- ▲ 4.03%
- Metro
- Orlando-Kissimmee-Sanford, FL
- State GDP YoY
- ▲ 3.28%
- F500 in state
- 36
Industry mix (Fortune 500 HQ in FL)
| Industry | F500 HQs | Revenue |
|---|---|---|
| Industrial Technology | 2 | $29B |
|
||
| Insurance | 2 | $17B |
|
||
| Retail | 1 | $60B |
|
||
| Technology Distribution | 1 | $58B |
|
||
| Homebuilding | 1 | $35B |
|
||
| Technology Manufacturing | 1 | $35B |
|
||
Price history
+343.6% since first listed4 events — show timeline
- 2026-04-08 Price Changed $220,000 Stellar MLS as Distributed by MLS Grid
- 2026-02-02 Listed $230,000 Stellar MLS as Distributed by MLS Grid
- 2025-09-25 Sold (Public Records) $170,800 Public Records
- 2010-07-19 Sold (Public Records) $49,599 Public Records
Property tax history
+8.2%/yrLatest (2025): $1,343 · +3.4% YoY. Source: county tax records.
Cash-flow waterfall
monthlySold comps — $/sqft
last 12 mo · ≤1 miLoading sold comps…