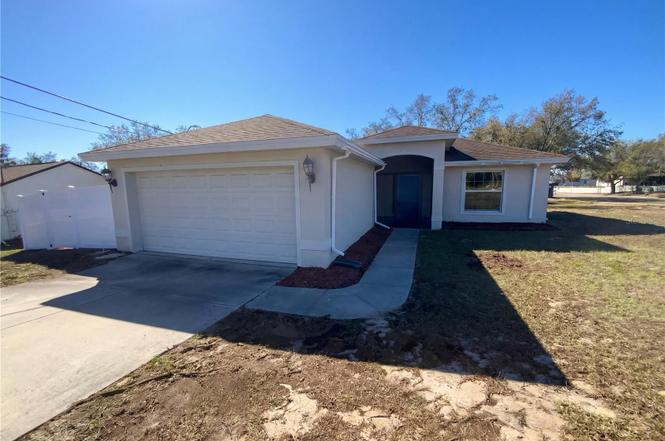
11275 Linden Dr · Spring Hill, FL
Flood risk 1/10 · Minimal
- FEMA flood zone
- X (unshaded)
- Chance of flooding over 30 yrs
- 0.0%
- Est. flood insurance / yr
- $507 – $1,088
Fire risk 1/10 · Minimal
- Est. fire insurance / yr
- $947 – $1,759
Heat risk 10/10 · Severe
- Hot days now (above 109°F)
- 7 days/yr
- Hot days in 30 yrs
- 24 days/yr
Wind risk 10/10 · Severe
- Chance of severe wind over 30 yrs
- 99.0%
Air-quality risk 2/10 · Minimal
- Unhealthy air days now
- 2 days/yr
- Unhealthy air days in 30 yrs
- 2 days/yr
Risk factors via First Street. Map © Google.
Why this score? — see what drove the D- grade
The composite is a weighted blend of 9 inputs, each scored 0–100. Each bar is that input's sub-score; the figure is the points it added to the 100-point composite (weight × sub-score).
- Cash flow +13.1/30.0
- ARV discount +7.1/15.0
- Schools +4.2/10.0
- DSCR +3.9/10.0
- Livability +3.2/5.0
- 1% rule +2.9/10.0
- Condition / age +2.5/5.0
- Rent growth +1.3/5.0
- Appreciation +0.0/10.0
$240,000
🖨 Deal sheet 📄 Offer letter ✓ Due diligence
Listing remarks MLS
Check out this 1 1/2 year old Custom built and designed home on a large corner lot with no rear neighbors. Built in 2018, this home was custom designed by the owner and has been immaculately kept. You will love this split bedroom home with Laminate Wood Floors and tile though out. This home has an open and airy living room, dining room and kitchen combination. The dishwasher and over are still new and have never been used. This Home is Perfect for a retiree or first time home buyer!! No HOA ! This home is close to everything including the YMCA, shopping, the bus line and the Veterans Expressway. All room sizes are approximate, buyer must verify the sizes.
Key facts
- Covered patio
- Storage shed
- Fenced-in backyard
Tags
Property features AI
Finance
- Other: Unfurnished; Living area approximately 1,000 square feet
- Financial info: Lease restrictions apply
- HOA & community: No community association fees; No community features listed
Exterior
- Parking: Driveway with tandem parking; 2-car attached garage
- Security: Owned security system
- Utilities: Public water; Public sewer; Electricity available; Water available
- Home design: Single family residence; One level; North facing
- Construction: Block and stucco construction; Shingle roof; Slab foundation; Built on approximately 0.3 acre lot
- Exterior features: Other exterior features; Concrete road access
Interior
- Kitchen: Dishwasher; Electric water heater
- Bedrooms: 2 bedrooms
- Flooring: Laminate flooring; Tile flooring
- Bathrooms: 2 full bathrooms
- Heating & cooling: Central heating; No cooling
- Interior features: Ceiling fans; Eat-in kitchen; Security system owned
- Laundry & utility: Laundry in garage
Neighborhood map
What this means for you Summary
Snapshot
- This is a 2-bed/7.0-bath single-family listed at $240k.
Deal economics
- At list price, monthly cash flow is $-10 ($-115/yr) — negative.
- To cash-flow at today's rent, offer at most $238k (0.7% below list).
- To meet the 1% rule (rent ≥ 1% of price), the offer needs to be $189k (21.1% below list).
- Recommended offer: $189k (21.1% below list) — sets the bar for 1% rule.
- Cap rate 6.2% vs local median 4.4% in Spring Hill — top-decile yield for the area; either an underpriced asset or a hidden risk that comps aren't pricing in. Stress-test before assuming the spread holds.
Location & tenants
- Location reads 63/100 on livability (#738 in FL) — a middle-class / working-renter tenant base. Strengths: cost of living A+, housing A+; Watch: health & safety C-, employment D+, amenities F.
- Hernando (suburban): math 50% / reading 50% proficiency, ranked #38 of 73 in FL (top 52%) — acceptable for families but not a draw, mixed tenant base, ~2y average lease.
- Market conditions: Rents falling (-4.8%/yr); 738 active listings in the ZIP; 12 comparable units currently listed for rent nearby; rentals at typical pace (median 25d on market — plan ~3-4 weeks tenant-placement turnaround); solid renter incomes; 2,505 units permitted in Hernando County in 2024 (318 in 5+ unit buildings).
Forward outlook
- Local home prices are declining (-3.0%/yr); year-one equity from $2k of loan paydown is wiped out by about $7k of value loss. Plan a longer hold.
- Hernando County population projected at +11% by 2050 — modest demand growth; plan on rents tracking national, not racing it.
Negotiation context
- It's been on market 113 days — a 9% lower offer ($218k) is reasonable based on typical stale-listing flexibility.
- 2 sale attempts since 6y ago; this cycle's ask has dropped $15k (6%) from the opening price — seller is motivated, your offer sets the floor, not the list.
Risks & watch-outs
- Climate carrying-cost: severe wind risk, 99% chance of damaging wind over 30y; extreme-heat days projected 7→24/yr by 2055 (HVAC capex compounding) — expect insurance premiums to compound above CPI over the hold.
Questions for the listing agent
- What do current leases actually rent for vs. the listed asking? Can we see a recent rent roll and the last 12 months of T-12 income?
- It's been on market 113 days. Have you received any prior offers? Is the seller open to a 21% concession, seller financing, or rate buy-down credit?
- Why hasn't it sold? Are there any deal-killer items the seller is aware of (foundation, flood, title, zoning, code violations)?
- Is there a deadline driving the sale (1031 exchange, divorce, estate, relocation)? That informs how much negotiation room exists.
- The area grade is low — what's the realistic commute time and amenity access for the typical tenant pool here? Any planned neighborhood developments (good or bad) we should know about?
- What's the average days-on-market for RENTAL listings here right now (not sales)? A rising rental-DOM trend means longer vacancies and softer asking-rent achievability than the comps imply.
- What's the recent tenant-quality profile in this submarket — average credit score on applications, eviction rate, late-payment / NSF rate, and stable-employment percentage? A property-management company in the area should have these aggregated.
- How much new for-sale + rental construction is in the pipeline within 1–3 miles? Heavy new supply typically softens prices + rents 12–24 months out; constrained supply supports both.
Investment metrics
- 1% rule
- 0.79% ✗
- Cap rate
- 6.24%
- Cash-on-cash
- -0.17%
- DSCR
- 0.99
- GRM
- 10.6
CMA / ARV
- ARV (on-the-fly)
- $238,000
- Comps found
- 12
Show comp detail 12 sales within ~0.75 mi
| Address | Dist | Beds/Ba | Sqft | Sold | Price | $/sf | Match |
|---|---|---|---|---|---|---|---|
| 11274 Linden Dr | 0.03mi | 3/2.0 (+1) | 1,008 (+1%) | 16mo | $259,000 | $257 | 64 |
| 11274 Linden Dr | 0.03mi | 3/2.0 (+1) | 1,008 (+1%) | 16mo | $259,000 | $257 | 63 |
| 11077 Lightwood St | 0.19mi | 2/2.0 | 1,074 (+7%) | 8mo | $256,000 | $238 | 52 |
| 1394 Escobar Ave | 0.46mi | 2/2.0 | 1,059 (+6%) | 3mo | $255,500 | $241 | 46 |
| 11175 Holbrook St | 0.65mi | 2/2.0 | 979 (-2%) | 3mo | $220,000 | $225 | 44 |
| 11006 Captain Dr | 0.49mi | 3/2.0 (+1) | 1,020 (+2%) | 14mo | $284,000 | $278 | 42 |
| 10347 Caspian St | 0.60mi | 2/2.0 | 973 (-3%) | 10mo | $210,000 | $216 | 39 |
| 1390 Mariner Blvd | 0.06mi | 2/2.0 | 1,150 (+15%) | 19mo | $252,500 | $220 | 36 |
| 10305 Bannister St | 0.72mi | 2/2.0 | 945 (-6%) | 4mo | $210,000 | $222 | 34 |
| 11544 Linden Dr | 0.50mi | 2/2.0 | 1,128 (+13%) | 5mo | $240,000 | $213 | 31 |
| 11127 Holbrook St | 0.63mi | 3/2.0 (+1) | 1,114 (+11%) | 4mo | $260,000 | $233 | 29 |
| 11731 Linden Dr | 0.74mi | 2/2.0 | 1,149 (+15%) | 13mo | $289,900 | $252 | 10 |
Match score weights: distance 35% · size 25% · config 20% · recency 20%. Top-matched comps best support the ARV.
Projected returns pro-forma
-3.0% appreciation · 0.0% rent growth · sell at horizon
- IRR
- -19.7%
- Equity multiple
- 0.33×
- Total profit
- $-45,119
- Equity at exit
- $35,785
- IRR
- -19.8%
- Equity multiple
- 0.08×
- Total profit
- $-61,794
- Equity at exit
- $20,751
Cash invested: $67,200 (down + closing). Projections, not guarantees.
Landlord ↔ Tenant lean methodology
- Overall (STATE)
- 87 Strongly Landlord-Friendly
- State Florida
- 87 Strongly Landlord-Friendly · R+3
- County
- — inherits STATE
- City
- — inherits STATE
ZIP-level market 34609
- Home prices YoY
- -23.2%
- Rents YoY
- -4.8%
- Active inventory
- 738
- Price-to-rent
- 10.6×
Monthly cashflow live
- Estimated rent
- $1,894 high interval (Pro) →
- Mortgage (P&I)
- −$1,259
- Tax from tax record
- −$147 /mo · $1,769/yr
- Insurance
- −$100
- HOA
- −$0
- Vacancy / Maint / Mgmt
- −$398
- Net cashflow
- $-10
Break-even live
UW: 25.0% down · 7.5% · 30yr · 1.5% tax · 5.0% vac · 8.0% maint · 8.0% mgmt
Financing live
Cash to close
- Down payment
- $60,000
- Closing costs
- $7,200
- Reserves months
- —
- Total cash needed
- —
Loan-product check · same deal, 3 products live
Conventional
25% down · 7.5% · 30yr
- Down + closing
- —
- Monthly P&I
- —
- Monthly cashflow
- —
- DSCR
- —
- Eligible?
- —
Personal DTI + credit; lowest rate.
DSCR
20% down · 8.5% · 30yr
- Down + closing
- —
- Monthly P&I
- —
- Monthly cashflow
- —
- DSCR
- —
- Eligible?
- —
No personal income docs; deal must DSCR.
Hard money
10% down · 12.0% · 12mo
- Down + closing
- —
- Monthly P&I
- —
- Monthly cashflow
- —
- DSCR
- —
- Eligible?
- —
Short-term bridge; refi at stabilization.
Rent comps 12 comps
| Address | Beds | Baths | Sqft | Rent | $/sqft | DOM | Units | Dist |
|---|---|---|---|---|---|---|---|---|
| 11348 Linden Dr Spring Hill, FL | 3.0 | 2.0 | 1114 | $1,895 | $1.70 | 24d | 1 | 0.14mi |
| 11624 Linden Dr Spring Hill, FL | 3.0 | 2.0 | 1403 | $1,945 | $1.39 | 15d | 1 | 0.60mi |
| 2079 De Carlo Ave Spring Hill, FL | 3.0 | 2.0 | 1367 | $1,950 | $1.43 | 12d | 1 | 0.74mi |
| 10264 Spring Hill Dr Spring Hill, FL | 2.0 | 1.0 | 720 | $500 | $0.69 | 24d | 1 | 0.78mi |
| 1215 Gatewood Ave Spring Hill, FL | 3.0 | 1.5 | 1000 | $1,800 | $1.80 | 24d | 1 | 0.84mi |
| 11303 Redgate St Spring Hill, FL | 2.0 | 2.0 | 1163 | $2,195 | $1.89 | 5d | 1 | 1.01mi |
| 2351 Gimlet Ave Spring Hill, FL | 2.0 | 2.0 | 1244 | $1,700 | $1.37 | 5d | 1 | 1.01mi |
| 10131 Hayward Rd Spring Hill, FL | 2.0 | 1.0 | 1235 | $1,580 | $1.28 | 24d | 1 | 1.12mi |
| 10054 Hayward Rd Spring Hill, FL | 3.0 | 2.0 | 1252 | $1,835 | $1.47 | 5d | 1 | 1.14mi |
| 2479 Statler Ave Spring Hill, FL | 2.0 | 2.0 | 1076 | $1,640 | $1.52 | 24d | 1 | 1.20mi |
| 3041 Hoban Ave Spring Hill, FL | 3.0 | 2.0 | 1344 | $1,849 | $1.38 | 24d | 1 | 1.41mi |
| 3017 Lema Dr Spring Hill, FL | 3.0 | 2.0 | 1296 | $1,920 | $1.48 | 5d | 1 | 1.43mi |
Listing history 24 events
-
2026-06-18days on market $240,000 Active 113 DOM
-
2026-06-17days on market $240,000 Active 112 DOM
-
2026-06-16days on market $240,000 Active 111 DOM
-
2026-06-15days on market $240,000 Active 110 DOM
-
2026-06-13days on market $240,000 Active 108 DOM
-
2026-06-13days on market $240,000 Active 107 DOM
-
2026-06-09days on market $240,000 Active 104 DOM
-
2026-06-08days on market $240,000 Active 103 DOM
-
2026-06-07days on market $240,000 Active 102 DOM
-
2026-06-04pricedays on market $240,000 Active 99 DOM
-
2026-06-03days on market $245,000 Active 98 DOM
-
2026-06-02days on market $245,000 Active 97 DOM
-
2026-06-01days on market $245,000 Active 96 DOM
-
2026-05-31days on market $245,000 Active 95 DOM
-
2026-04-23price $245,000
-
2026-03-19price $250,000
-
2026-02-25$255,000 Active
-
2026-02-13soldstatus $233,900
-
2020-09-01soldstatus $159,900
-
2020-08-28soldstatus $159,900 665-char remark
Show marketing remark (665 chars)
Check out this 1 1/2 year old Custom built and designed home on a large corner lot with no rear neighbors. Built in 2018, this home was custom designed by the owner and has been immaculately kept. You will love this split bedroom home with Laminate Wood Floors and tile though out. This home has an open and airy living room, dining room and kitchen combination. The dishwasher and over are still new and have never been used. This Home is Perfect for a retiree or first time home buyer!! No HOA ! This home is close to everything including the YMCA, shopping, the bus line and the Veterans Expressway. All room sizes are approximate, buyer must verify the sizes.
-
2020-08-01$159,900 665-char remark
Show marketing remark (665 chars)
Check out this 1 1/2 year old Custom built and designed home on a large corner lot with no rear neighbors. Built in 2018, this home was custom designed by the owner and has been immaculately kept. You will love this split bedroom home with Laminate Wood Floors and tile though out. This home has an open and airy living room, dining room and kitchen combination. The dishwasher and over are still new and have never been used. This Home is Perfect for a retiree or first time home buyer!! No HOA ! This home is close to everything including the YMCA, shopping, the bus line and the Veterans Expressway. All room sizes are approximate, buyer must verify the sizes.
-
2017-03-09soldstatus $10,000
-
1989-06-01soldstatus $20,000
-
1989-03-01soldstatus $16,000
ⓘ Source: listings_history table (triggers on properties + properties_extension) + one-shot
backfill from property_details.listing_events for pre-trigger history.
Tax reassessment forecast FL · Resets to sale price
- Current annual tax
- $1,769 · $147/mo
- Projected year-2 tax
- $1,992 · $166/mo
- Expected delta
- +$223/yr (+$19/mo · 12.6%)
ⓘ Screening estimate from a state-policy table — verify with the county assessor before closing.
Climate risk First Street
- Flood 1/10 Low FEMA zone X (unshaded) · 0% chance over 30 yrs
- Wildfire 1/10 Low
- Heat 10/10 Extreme 7 d/yr ≥109°F today · 24 d/yr by 30 yrs out
- Wind 10/10 Extreme 99% chance of damaging wind over 30 yrs
- Air quality 2/10 Low 2 unhealthy d/yr today · 2 by 30 yrs out
Nearby sold comps map
Loading sold comps map…
Walkable amenities ~0.75 mi
Loading nearby amenities…
Taxation est. · year 1
- Rental income
- $22,730
- − Mortgage interest
- −$13,444
- − Property taxes
- −$1,769
- − Insurance
- −$1,200
- − Repairs & maintenance
- −$1,818
- − Management
- −$1,818
- − Depreciation
- −$6,982
- Taxable loss
- −$4,301
- Est. tax savings @ 24.0%
- +$1,032
- After-tax cash flow
- $917/yr
For passive investors: Depreciation is non-cash, so a rental often shows a tax loss while cash-flowing — sheltering income. Rental losses are passive: they offset passive income freely, and up to $25,000/yr can offset ordinary (W-2) income if you actively participate and your MAGI is under $100k (phasing out to $0 by $150k); unused losses carry forward. On sale, claimed depreciation is recaptured at up to 25%, and gains may owe capital-gains tax (a 1031 exchange can defer both). Figures are a year-1 estimate at your 24.0% rate — not tax advice; consult a CPA.
Schools (NCES district)
- District
- Hernando
- NCES district ID
- 1200810
- Math proficiency
- 50% ▼ -8.00%
- Reading proficiency
- 50% ▼ -4.00%
- Median HH income
- $41,985
- Composite
- 42.03/100
- National rank
- #3329
- State rank
- #38 of 73 in FL
Livability — Spring Hill
- Score
- 63/100
- State rank
- #738
- US rank
- #15937
Category grades
Schools grade is shown separately in the Schools card above.
Census & demographics
- Census place
- Spring Hill, FL
- County
- Hernando County · 169,677 people
- City population
- 83,915
- Metro
- Tampa-St. Petersburg-Clearwater, FL
- Population (ZIP)
- 47,257
- Household income
- $79,442
- Rent vs Own
- Severe rent burden
- 663.0
Population outlook (Hernando County) Hauer SSP2
- Today (2025)
- 189,218 people
- By 2030
- 194,367 · +2.7%
- By 2040
- 203,398 · +7.5%
- By 2050
- 209,589 · +10.8%
- By 2075
- 218,452 · +15.4%
- By 2100
- 205,923 · +8.8%
Race, ethnicity, and origin ACS 2023
- Neighborhood character
- Predominantly White (65%)
- Race & ethnicity
- White 65% Hispanic / Latino 22% Two or more races 13% Black 6% Asian 3%
- Hispanic origin (detail)
- Mexican 2% Puerto Rican 12% Cuban 3%
- Common ancestry
- Romanian 4% Lithuanian 2% Slovak 1%
- Foreign-born
- 11% · Canada, Jamaica, Philippines
- Languages at home
- 81% English-only · Spanish 15% Other Asian/Pacific 1% Other Indo-European 1%
Political lean MEDSL · Hernando
- 2024 margin
- Solid R (+37.0) · D 31.1% · R 68.2%
- 2008→2024 swing
- -33.5pp toward R · 2008: -3.6pp · 2024: -37.0pp
- All cycles
- 2024: R+37.0 2020: R+30.2 2016: R+29.0 2012: R+8.5 2008: R+3.6
Not yet ingested
- Civics
- —
Market trends
- HPI YoY
- ▼ -86.49%
- Current HPI
- 286.5885
- Rent YoY
- ▼ -4.82%
- Metro
- Tampa-St. Petersburg-Clearwater, FL
- State GDP YoY
- ▲ 3.28%
- F500 in state
- 36
Industry mix (Fortune 500 HQ in FL)
| Industry | F500 HQs | Revenue |
|---|---|---|
| Industrial Technology | 2 | $29B |
|
||
| Insurance | 2 | $17B |
|
||
| Retail | 1 | $60B |
|
||
| Technology Distribution | 1 | $58B |
|
||
| Homebuilding | 1 | $35B |
|
||
| Technology Manufacturing | 1 | $35B |
|
||
Price history
+1431.2% since first listed10 events — show timeline
- 2026-04-23 Price Changed $245,000 Stellar MLS as Distributed by MLS Grid
- 2026-03-19 Price Changed $250,000 Stellar MLS as Distributed by MLS Grid
- 2026-02-25 Listed $255,000 Stellar MLS as Distributed by MLS Grid
- 2026-02-13 Sold (Public Records) $233,900 Public Records
- 2020-09-01 Sold (Public Records) $159,900 Public Records
- 2020-08-28 Sold (MLS) $159,900 Stellar MLS as Distributed by MLS Grid
- 2020-08-01 Listed $159,900 Stellar MLS as Distributed by MLS Grid
- 2017-03-09 Sold (Public Records) $10,000 Public Records
- 1989-06-01 Sold (Public Records) $20,000 Public Records
- 1989-03-01 Sold (Public Records) $16,000 Public Records
Property tax history
+19.9%/yrLatest (2025): $1,769 · +0.9% YoY. Source: county tax records.
Cash-flow waterfall
monthlySold comps — $/sqft
last 12 mo · ≤1 miLoading sold comps…