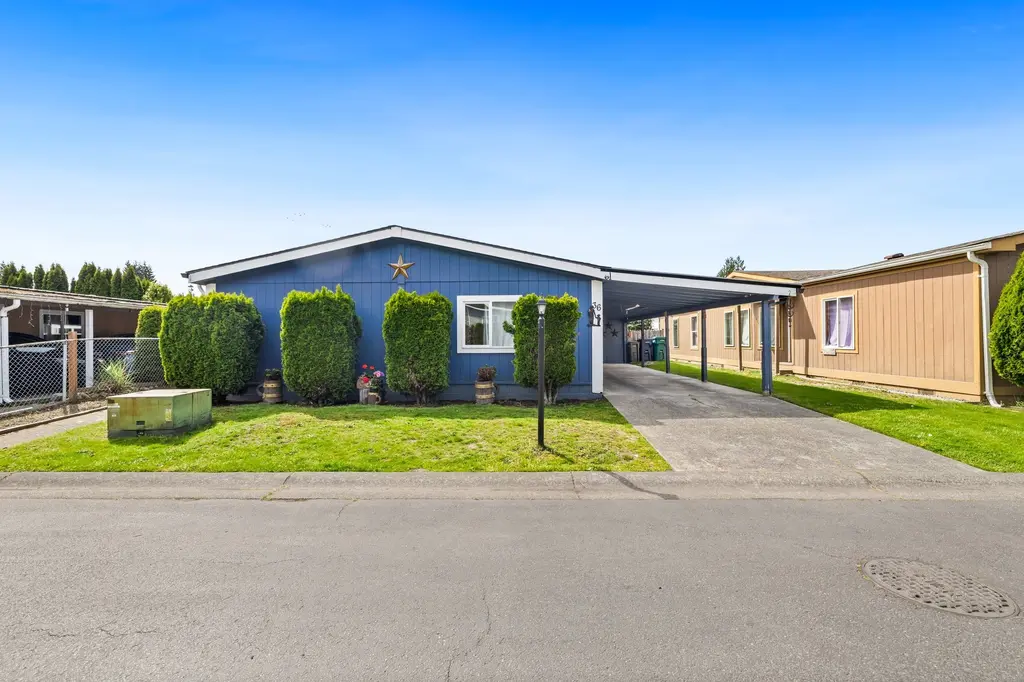
725 37th Street Ct SE #36 · Auburn, WA
Flood risk 1/10 · Minimal
- FEMA flood zone
- X (unshaded)
- Chance of flooding over 30 yrs
- 0.0%
- Est. flood insurance / yr
- $507 – $1,088
Fire risk 2/10 · Minimal
- Est. fire insurance / yr
- $604 – $1,122
Heat risk 3/10 · Minor
- Hot days now (above 87°F)
- 7 days/yr
- Hot days in 30 yrs
- 15 days/yr
Wind risk 1/10 · Minimal
- Chance of severe wind over 30 yrs
- —
Air-quality risk 7/10 · Major
- Unhealthy air days now
- 10 days/yr
- Unhealthy air days in 30 yrs
- 11 days/yr
Risk factors via First Street. Map © Google.
Why this score? — see what drove the C grade
The composite is a weighted blend of 9 inputs, each scored 0–100. Each bar is that input's sub-score; the figure is the points it added to the 100-point composite (weight × sub-score).
- Cash flow +25.8/30.0
- DSCR +8.7/10.0
- 1% rule +6.8/10.0
- Schools +4.7/10.0
- Livability +4.0/5.0
- Condition / age +4.0/5.0
- Rent growth +2.9/5.0
- ARV discount +2.7/15.0
- Appreciation +0.0/10.0
$165,000
🖨 Deal sheet (PDF) 📄 Offer letter ✓ Due diligence
Listing remarks
Beautifully maintained 3-bedroom, 2 full bath manufactured home in a no age restriction park; offering comfortable and affordable living in a well-kept Auburn community! This inviting home features a spacious open-concept layout filled with natural light and a warm, welcoming feel throughout. The living area flows seamlessly into the dining space and well-appointed kitchen, complete with ample cabinetry and counter space—perfect for everyday living and entertaining. The generously sized primary suite offers a private retreat with its own full bath, while two additional bedrooms provide flexibility for guests, a home office, or hobbies. Enjoy your own outdoor space, ideal f
Key facts
- 2 parking spots
- Built 1986
- Listed 26 days
Property features AI
Finance
- Other: Buyer to verify schools and lot details; Calculated living area 1,232
- Financial info: Land lease amount: $1,075; Listing terms: Cash
- HOA & community: Park name: Don Wan states; Pets allowed: Cats and dogs; Land lease
Exterior
- Parking: Carport
- Utilities: Electric energy source; Electric water heater located in bedroom closet; Water from park; Sewer to park; Power provided by PSE
- Home design: Manufactured home (Double wide); Updated/remodeled condition; One level; Faces southeast; Model: 22/28; Make: FLTWD; Mobile home remains in place; Park approved for sale; Park amenities include common area
- Construction: Wood construction; Composition roof; Wood skirt; Concrete perimeter foundation; Manufactured after 6/15/1976
- Exterior features: Wood exterior; Wood products; Paved lot
Interior
- Kitchen: Microwave; Refrigerator; Stove/Range
- Bedrooms: 3 bedrooms
- Flooring: Ceramic tile; Laminate; Carpet
- Bathrooms: 2 full bathrooms; 2 bathtubs; 2 showers
- Heating & cooling: Forced air heating; Central air; Heat pump; High-efficiency cooling; Window unit(s)
- Interior features: Water heater; Ceiling fan(s); Patio/porch/deck; Walk-in closet; Bath off primary
- Laundry & utility: Washer; Dryer; Utility room
Neighborhood map
What this means for you Summary
Snapshot
- This is a 3-bed/2.0-bath manufactured listed at $165k. Condition is rated good.
Deal economics
- At list price, monthly cash flow is $403 ($5k/yr) — positive.
- The deal already cash-flows at list — no discount required.
- Meets the 1% rule at list price ($2k rent vs $165k).
- Recommended offer: $163k (1.5% below list) — sets the bar for market timing.
- Cap rate 9.2% vs local median 2.7% in Auburn — top-decile yield for the area; either an underpriced asset or a hidden risk that comps aren't pricing in. Stress-test before assuming the spread holds.
Location & tenants
- Location reads 81/100 on livability (#75 in WA, #1,371 nationally) — a professional / high-income tenant draw. Strengths: amenities A+, commute A+, employment A+; Watch: crime F, cost of living F.
- Auburn School District (urban): math 47% / reading 56% proficiency, ranked #125 of 291 in WA (top 43%) — acceptable for families but not a draw, mixed tenant base, ~2y average lease.
- Zoned schools: Gildo Rey Elementary School (412 students, 76% FRL); Mt Baker Middle School (977 students, 58% FRL); Auburn Senior High School (1,844 students, 67% FRL) — zoned schools average 67% FRL vs 44% district-wide (23 pts higher); higher-poverty schools than district average — tighter screening recommended.
- Market conditions: Rents rising (+1.5%/yr); 176 active listings in the ZIP; 16 comparable units currently listed for rent nearby; rentals leasing fast (median 7d on market — plan ~1-2 weeks tenant-placement turnaround); solid renter incomes; 10,555 units permitted in King County in 2024 (7,119 in 5+ unit buildings).
Forward outlook
- Local home prices are declining (-3.0%/yr); year-one equity from $1k of loan paydown is wiped out by about $5k of value loss. Plan a longer hold.
- King County population projected at +44% by 2050 — long-run rental-demand tailwind backs the buy-and-hold thesis.
Negotiation context
- It's been on market 26 days — a 2% lower offer ($163k) is reasonable based on typical stale-listing flexibility.
Questions for the listing agent
- Is there a deadline driving the sale (1031 exchange, divorce, estate, relocation)? That informs how much negotiation room exists.
- Crime grade is F in this area — have there been break-ins, vandalism, or insurance claims at this property in the last 3 years? What carrier currently insures it and at what premium?
- What's the average days-on-market for RENTAL listings here right now (not sales)? A rising rental-DOM trend means longer vacancies and softer asking-rent achievability than the comps imply.
- What's the recent tenant-quality profile in this submarket — average credit score on applications, eviction rate, late-payment / NSF rate, and stable-employment percentage? A property-management company in the area should have these aggregated.
- How much new for-sale + rental construction is in the pipeline within 1–3 miles? Heavy new supply typically softens prices + rents 12–24 months out; constrained supply supports both.
Investment metrics
- 1% rule
- 1.18% ✓
- Cap rate
- 9.22%
- Cash-on-cash
- 10.46%
- DSCR
- 1.47
- GRM
- 7.0
CMA / ARV
- ARV (on-the-fly)
- $149,072
- Comps found
- 12
Show comp detail 12 sales within ~0.75 mi
| Address | Dist | Beds/Ba | Sqft | Sold | Price | $/sf | Match |
|---|---|---|---|---|---|---|---|
| 3225 M St SE #144 | 0.23mi | 3/2.0 | 1,248 (+1%) | 3mo | $155,000 | $124 | 85 |
| 602 29th St SE #39 | 0.23mi | 3/2.0 | 1,232 (0%) | 6mo | $155,000 | $126 | 84 |
| 3225 M St SE #145 | 0.14mi | 3/2.0 | 1,254 (+2%) | 7mo | $105,000 | $84 | 84 |
| 602 29th St SE #54 | 0.28mi | 3/2.0 | 1,232 (0%) | 6mo | $55,000 | $45 | 82 |
| 401 37th St SE #104 | 0.31mi | 4/2.0 (+1) | 1,248 (+1%) | 0mo | $180,000 | $144 | 78 |
| 210 37th St SE #130 | 0.45mi | 3/2.0 | 1,248 (+1%) | 2mo | $150,000 | $120 | 76 |
| 607 37th St SE #81 | 0.18mi | 4/2.0 (+1) | 1,296 (+5%) | 5mo | $115,000 | $89 | 74 |
| 607 37th St SE #77 | 0.18mi | 3/2.0 | 1,120 (-9%) | 4mo | $135,000 | $121 | 73 |
| 707 37th St SE #73 | 0.17mi | 2/2.0 (-1) | 1,152 (-6%) | 9mo | $130,000 | $113 | 69 |
| 707 37th St SE #36 | 0.17mi | 3/2.0 | 1,404 (+14%) | 9mo | $215,000 | $153 | 61 |
| 2902 B St SE | 0.53mi | 3/2.0 | 1,152 (-6%) | 5mo | $312,500 | $271 | 61 |
| 4248 A St SE #518 | 0.70mi | 3/2.0 | 1,344 (+9%) | 9mo | $145,000 | $108 | 45 |
Match score weights: distance 35% · size 25% · config 20% · recency 20%. Top-matched comps best support the ARV.
Projected returns pro-forma
-3.0% appreciation · 1.51% rent growth · sell at horizon
- IRR
- -2.3%
- Equity multiple
- 0.91×
- Total profit
- $-3,934
- Equity at exit
- $24,602
- IRR
- 5.7%
- Equity multiple
- 1.39×
- Total profit
- $18,242
- Equity at exit
- $14,266
Cash invested: $46,200 (down + closing). Projections, not guarantees.
Landlord ↔ Tenant lean methodology
- Overall (STATE)
- 28 Tenant-Leaning
- State Washington
- 28 Tenant-Leaning · D+8
- County
- — inherits STATE
- City
- — inherits STATE
ZIP-level market 98002
- Rents YoY
- 1.5%
- Active inventory
- 176
- Price-to-rent
- 7.0×
Monthly cashflow live
- Estimated rent
- $1,953 high interval (Pro) →
- Mortgage (P&I)
- −$865
- Tax est. 1.5%
- −$206 /mo · $2,475/yr
- Insurance
- −$69
- HOA
- −$0
- Vacancy / Maint / Mgmt
- −$410
- Net cashflow
- $403
Break-even live
Sensitivity live
| Price | -10% $517 | -5% $460 | +0% $403 | +5% $346 | +10% $289 |
|---|---|---|---|---|---|
| Rent | -10% $249 | -5% $326 | +0% $403 | +5% $480 | +10% $557 |
| Rate | -1.0pp $486 | -0.5pp $445 | base $403 | +0.5pp $360 | +1.0pp $317 |
UW: 25.0% down · 7.5% · 30yr · 1.5% tax · 5.0% vac · 8.0% maint · 8.0% mgmt
Financing live
Cash to close
- Down payment
- $41,250
- Closing costs
- $4,950
- Reserves months
- —
- Total cash needed
- —
Loan-product check · same deal, 3 products live
Conventional
25% down · 7.5% · 30yr
- Down + closing
- —
- Monthly P&I
- —
- Monthly cashflow
- —
- DSCR
- —
- Eligible?
- —
Personal DTI + credit; lowest rate.
DSCR
20% down · 8.5% · 30yr
- Down + closing
- —
- Monthly P&I
- —
- Monthly cashflow
- —
- DSCR
- —
- Eligible?
- —
No personal income docs; deal must DSCR.
Hard money
10% down · 12.0% · 12mo
- Down + closing
- —
- Monthly P&I
- —
- Monthly cashflow
- —
- DSCR
- —
- Eligible?
- —
Short-term bridge; refi at stabilization.
Rent comps 16 comps
| Address | Beds | Baths | Sqft | Rent | $/sqft | DOM | Units | Dist |
|---|---|---|---|---|---|---|---|---|
| 1014 37th St SE Apt 4 Auburn, WA | 2.0 | 2.0 | 1005 | $1,780 | $1.77 | 7d | 1 | 0.21mi |
| 1120 37th St SE Auburn, WA | 2.0 | 1.0 | 788 | $1,695 | $2.15 | 14d | 1 | 0.23mi |
| 2952 O St SE Unit F Auburn, WA | 2.0 | 1.0 | 1051 | $1,495 | $1.42 | 4d | 1 | 0.45mi |
| 2952 O St SE Unit D Auburn, WA | 2.0 | 1.0 | 795 | $1,375 | $1.73 | 4d | 1 | 0.45mi |
| 1526 29th St SE Auburn, WA | 2.0 | 1.0 | 912 | $1,595 | $1.75 | 26d | 1 | 0.51mi |
| 404 27th St SE Unit 19-1 Auburn, WA | 2.0 | 1.0 | 1000 | $1,750 | $1.75 | 14d | 1 | 0.51mi |
| 2455 F St SE Auburn, WA | 1.0–3.0 | 1.0–2.0 | 757 | $1,955 | $2.58 | 5d | 6 | 0.65mi |
| 4704 Mill Pond Dr SE #213 Auburn, WA | 2.0 | 2.0 | 1142 | $2,750 | $2.41 | 5d | 1 | 0.69mi |
| 732 4th Ave NE Pacific, WA | 2.0 | 1.0 | 850 | $1,805 | $2.12 | 7d | 2 | 0.80mi |
| 703 47th St SE Auburn, WA | 2.0 | 1.0–2.0 | 781 | $1,970 | $2.52 | 4d | 7 | 0.82mi |
| 402 21st St SE Auburn, WA | 1.0–2.0 | 1.0–1.5 | 747 | $1,695 | $2.27 | 17d | 4 | 0.84mi |
| 2020 F St SE Auburn, WA | 1.0–2.0 | 1.0 | 725 | $1,599 | $2.21 | 26d | 1 | 0.89mi |
| 418 17th St SE Unit 6C Auburn, WA | 2.0 | 2.0 | 1219 | $2,200 | $1.80 | 26d | 1 | 1.02mi |
| 1420 17th St SE Auburn, WA | 1.0–2.0 | 1.0 | 725 | $1,695 | $2.34 | 5d | 4 | 1.14mi |
| 102 Hawthorne Ave S Pacific, WA | 3.0 | 1.0 | 1285 | $2,950 | $2.30 | 0d | 1 | 1.35mi |
| 2901 Auburn Way S Auburn, WA | 1.0–2.0 | 1.0 | 667 | $2,175 | $3.26 | 0d | 20 | 1.42mi |
Listing history 12 events
-
2026-06-21days on market $165,000 Active 26 DOM
-
2026-06-18days on market $165,000 Active 23 DOM
-
2026-06-17days on market $165,000 Active 22 DOM
-
2026-06-16days on market $165,000 Active 21 DOM
-
2026-06-15days on market $165,000 Active 20 DOM
-
2026-06-13days on market $165,000 Active 18 DOM
-
2026-06-13days on market $165,000 Active 17 DOM
-
2026-06-09days on market $165,000 Active 14 DOM
-
2026-06-08days on market $165,000 Active 13 DOM
-
2026-06-07pricestatusdays on market $165,000 Active 12 DOM
-
2026-05-15status Pending
-
2026-05-05$174,900 Active
ⓘ Source: listings_history table (triggers on properties + properties_extension) + one-shot
backfill from property_details.listing_events for pre-trigger history.
Climate risk First Street
- Flood 1/10 Low FEMA zone X (unshaded) · 0% chance over 30 yrs
- Wildfire 2/10 Low
- Heat 3/10 Moderate 7 d/yr ≥87°F today · 15 d/yr by 30 yrs out
- Wind 1/10 Low
- Air quality 7/10 Severe 10 unhealthy d/yr today · 11 by 30 yrs out
Nearby sold comps map
Loading sold comps map…
Walkable amenities ~0.75 mi
Loading nearby amenities…
Taxation est. · year 1
- Rental income
- $23,440
- − Mortgage interest
- −$9,243
- − Property taxes
- −$2,475
- − Insurance
- −$825
- − Repairs & maintenance
- −$1,875
- − Management
- −$1,875
- − Depreciation
- −$4,800
- Taxable income
- $2,347
- Est. tax owed @ 24.0%
- −$563
- After-tax cash flow
- $4,271/yr
For passive investors: Depreciation is non-cash, so a rental often shows a tax loss while cash-flowing — sheltering income. Rental losses are passive: they offset passive income freely, and up to $25,000/yr can offset ordinary (W-2) income if you actively participate and your MAGI is under $100k (phasing out to $0 by $150k); unused losses carry forward. On sale, claimed depreciation is recaptured at up to 25%, and gains may owe capital-gains tax (a 1031 exchange can defer both). Figures are a year-1 estimate at your 24.0% rate — not tax advice; consult a CPA.
Condition & rehab AI · 12 photos
This well-maintained 3-bedroom, 2-bath manufactured home is move-in ready with a good condition score and minimal repairs needed.
Value-add opportunities
- Both Paint exterior — Enhances curb appeal and value
- Both Replace window treatments — Improves aesthetic and energy efficiency
- Both Upgrade flooring in bathrooms — Enhances resale value and comfort
Renovation cost estimate screening
Value-add ROI direction
- Both Paint exterior — Enhances curb appeal and value ↑
- Both Replace window treatments — Improves aesthetic and energy efficiency ↑
- Both Upgrade flooring in bathrooms — Enhances resale value and comfort ↑
ⓘ Cost ranges are severity-bucket heuristics (US national rule-of-thumb). Get contractor quotes + a written scope before underwriting a rehab budget.
Schools (NCES district)
- District
- Auburn School District
- NCES district ID
- 5300300
- Math proficiency
- 47% ▼ -3.00%
- Reading proficiency
- 56% ▼ -1.00%
- Median HH income
- $58,048
- Composite
- 46.73/100
- National rank
- #5240
- State rank
- #125 of 291 in WA
Livability — Auburn
- Score
- 81/100
- State rank
- #75
- US rank
- #1371
Category grades
Schools grade is shown separately in the Schools card above.
Census & demographics
- Census place
- Auburn, WA
- County
- King County · 2,251,916 people
- City population
- 74,969
- Metro
- Seattle-Tacoma-Bellevue, WA
- Population (ZIP)
- 37,509
- Household income
- $78,684
- Rent vs Own
- Severe rent burden
- 2202.0
Population outlook (King County) Hauer SSP2
- Today (2025)
- 2,576,485 people
- By 2030
- 2,803,316 · +8.8%
- By 2040
- 3,255,921 · +26.4%
- By 2050
- 3,706,444 · +43.9%
- By 2075
- 4,746,063 · +84.2%
- By 2100
- 5,407,730 · +109.9%
Race, ethnicity, and origin ACS 2023
- Neighborhood character
- Highly diverse neighborhood (Simpson 0.72)
- Race & ethnicity
- White 46% Hispanic / Latino 24% Two or more races 13% Black 12% Asian 6% Pacific Islander 4% Native American 2%
- Hispanic origin (detail)
- Mexican 20%
- Common ancestry
- Portuguese 4% Subsaharan African 4% Lithuanian 3%
- Foreign-born
- 24% · Canada, Vietnam
- Languages at home
- 63% English-only · Spanish 19% Russian/Polish/Slavic 6% Other Asian/Pacific 3%
Political lean MEDSL · King
- 2024 margin
- Solid D (+51.7) · D 74.2% · R 22.5% · Other 3.4%
- 2008→2024 swing
- +9.6pp toward D · 2008: 42.1pp · 2024: 51.7pp
- All cycles
- 2024: D+51.7 2020: D+52.7 2016: D+50.4 2012: D+39.9 2008: D+42.1
Not yet ingested
- Civics
- —
Market trends
- HPI YoY
- ▼ -677.96%
- Current HPI
- 298.0849
- Rent YoY
- ▲ 1.51%
- Metro
- Seattle-Tacoma-Bellevue, WA
- State GDP YoY
- ▲ 4.65%
- F500 in state
- 22
Industry mix (Fortune 500 HQ in WA)
| Industry | F500 HQs | Revenue |
|---|---|---|
| Retail | 2 | $269B |
|
||
| Technology / Retail | 1 | $638B |
|
||
| Technology | 1 | $245B |
|
||
| Telecommunications | 1 | $38B |
|
||
| Food / Beverage | 1 | $36B |
|
||
| Automotive / Trucks | 1 | $34B |
|
||
Price history
2 events — show timeline
- 2026-05-15 Pending — NWMLS as Distributed by MLS Grid
- 2026-05-05 Listed $174,900 NWMLS as Distributed by MLS Grid
Cash-flow waterfall
monthlySold comps — $/sqft
last 12 mo · ≤1 miLoading sold comps…