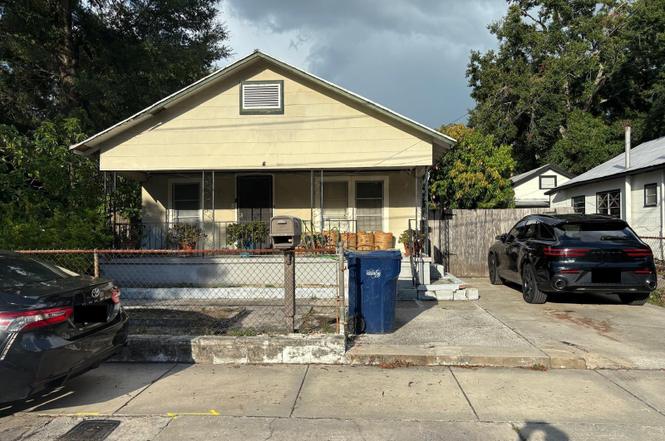
2909 N 11th St · Tampa, FL
Flood risk 1/10 · Minimal
- FEMA flood zone
- X (unshaded)
- Chance of flooding over 30 yrs
- 0.0%
- Est. flood insurance / yr
- $507 – $1,088
Fire risk 1/10 · Minimal
- Est. fire insurance / yr
- $947 – $1,759
Heat risk 10/10 · Severe
- Hot days now (above 107°F)
- 7 days/yr
- Hot days in 30 yrs
- 25 days/yr
Wind risk 9/10 · Severe
- Chance of severe wind over 30 yrs
- 99.0%
Air-quality risk 3/10 · Minor
- Unhealthy air days now
- 3 days/yr
- Unhealthy air days in 30 yrs
- 4 days/yr
Risk factors via First Street. Map © Google.
Why this score? — see what drove the C- grade
The composite is a weighted blend of 9 inputs, each scored 0–100. Each bar is that input's sub-score; the figure is the points it added to the 100-point composite (weight × sub-score).
- Cash flow +14.5/30.0
- Appreciation +10.0/10.0
- ARV discount +7.5/15.0
- DSCR +4.4/10.0
- Schools +4.2/10.0
- 1% rule +4.0/10.0
- Livability +4.0/5.0
- Rent growth +2.6/5.0
- Condition / age +2.5/5.0
$189,900
🖨 Deal sheet 📄 Offer letter ✓ Due diligence
Listing remarks
Under contract-accepting backup offers. Investor Special in Historic Ybor! Excellent opportunity to rehab, build, or hold in one of Tampa’s fastest-growing areas. This large lot (~5,500 SF) is zoned YC-8, allowing for single-family use with potential to add an Accessory Dwelling Unit (ADU) for additional rental income. There's also a detached block structure in the back with existing slab—ideal for future conversion or storage. The main home offers 2 bedrooms, 1 bathroom, tile flooring, and a functional layout ready for a full renovation. Features include cabinets, laundry hookups, dual vanities, and plenty of storage, though updates are needed throughout. The lot is fenced, inc
Key facts
- Large lot
- Zoned yc-8
- Fenced lot
Tags
Neighborhood map
What this means for you Summary
Snapshot
- This is a 2-bed/1.0-bath single-family listed at $190k.
Deal economics
- At list price, monthly cash flow is $43 ($520/yr) — positive.
- The deal already cash-flows at list — no discount required.
- To meet the 1% rule (rent ≥ 1% of price), the offer needs to be $172k (9.6% below list).
- Recommended offer: $172k (9.6% below list) — sets the bar for 1% rule.
Location & tenants
- Location reads 79/100 on livability (#142 in FL, #2,135 nationally) — a middle-class / working-renter tenant base. Strengths: commute A+, housing A+, health & safety A+; Watch: schools C-, crime D+.
- Hillsborough (suburban): math 47% / reading 50% proficiency, ranked #41 of 73 in FL (top 56%) — families likely to look elsewhere, expect single-tenant / working-renter base with shorter leases.
- Market conditions: Rents flat; 187 active listings in the ZIP; 40 comparable units currently listed for rent nearby; rentals at typical pace (median 21d on market — plan ~3-4 weeks tenant-placement turnaround); lower-income renter base — watch delinquency; 9,053 units permitted in Hillsborough County in 2024 (4,555 in 5+ unit buildings).
- At $1,716/mo this rent would consume 56% of the median local household income ($37k/yr) (locally 1374% of renters already pay >50% of income on rent) — very limited rent-growth headroom before tenants either downsize or default.
Forward outlook
- In year one you build about $20k of equity ($1k loan paydown + $19k appreciation (10.0% local appreciation)).
- Hillsborough County population projected at +37% by 2050 — long-run rental-demand tailwind backs the buy-and-hold thesis.
- At projected returns (10.0% appreciation + 0.6% rent growth), your $53k cash investment doubles in ~3 years — after that, you're playing with house money.
- By year 2, paydown + projected appreciation supports a ~$33k cash-out refi (75% LTV) — recoverable capital for the next deal without selling this one.
Negotiation context
- It's been on market 74 days — a 6% lower offer ($179k) is reasonable based on typical stale-listing flexibility.
- 3 sale attempts since 7y ago; this cycle's ask has dropped $25k (12%) from the opening price — seller is motivated, your offer sets the floor, not the list.
- Current owner paid $44k; list at $190k implies a 337% gain — meaningful room to come down on a strong offer.
Risks & watch-outs
- Watch-outs: built in 1939 — expect roof / HVAC / electrical / plumbing capex.
- Climate carrying-cost: severe wind risk, 99% chance of damaging wind over 30y; extreme-heat days projected 7→25/yr by 2055 (HVAC capex compounding) — expect insurance premiums to compound above CPI over the hold.
Questions for the listing agent
- It's been on market 74 days. Have you received any prior offers? Is the seller open to a 10% concession, seller financing, or rate buy-down credit?
- Built in 1939 — when were the roof, HVAC, electrical panel, plumbing, and water heater last replaced?
- Why hasn't it sold? Are there any deal-killer items the seller is aware of (foundation, flood, title, zoning, code violations)?
- Is there a deadline driving the sale (1031 exchange, divorce, estate, relocation)? That informs how much negotiation room exists.
- Crime grade is D in this area — have there been break-ins, vandalism, or insurance claims at this property in the last 3 years? What carrier currently insures it and at what premium?
- What's the average days-on-market for RENTAL listings here right now (not sales)? A rising rental-DOM trend means longer vacancies and softer asking-rent achievability than the comps imply.
- What's the recent tenant-quality profile in this submarket — average credit score on applications, eviction rate, late-payment / NSF rate, and stable-employment percentage? A property-management company in the area should have these aggregated.
- How much new for-sale + rental construction is in the pipeline within 1–3 miles? Heavy new supply typically softens prices + rents 12–24 months out; constrained supply supports both.
Investment metrics
- 1% rule
- 0.90% ✗
- Cap rate
- 6.57%
- Cash-on-cash
- 0.98%
- DSCR
- 1.04
- GRM
- 9.2
CMA / ARV
No comps found within radius.
Projected returns pro-forma
10.0% appreciation · 0.58% rent growth · sell at horizon
- IRR
- 24.2%
- Equity multiple
- 2.92×
- Total profit
- $102,133
- Equity at exit
- $171,077
- IRR
- 20.8%
- Equity multiple
- 6.48×
- Total profit
- $291,155
- Equity at exit
- $368,934
Cash invested: $53,172 (down + closing). Projections, not guarantees.
Landlord ↔ Tenant lean methodology
- Overall (STATE)
- 87 Strongly Landlord-Friendly
- State Florida
- 87 Strongly Landlord-Friendly · R+3
- County
- — inherits STATE
- City
- — inherits STATE
ZIP-level market 33605
- Home prices YoY
- 3.7%
- Rents YoY
- 0.6%
- Active inventory
- 187
- Price-to-rent
- 9.2×
Monthly cashflow live
- Estimated rent
- $1,716 high interval (Pro) →
- Mortgage (P&I)
- −$996
- Tax est. 1.5%
- −$237 /mo · $2,848/yr
- Insurance
- −$79
- HOA
- −$0
- Vacancy / Maint / Mgmt
- −$360
- Net cashflow
- $43
Break-even live
UW: 25.0% down · 7.5% · 30yr · 1.5% tax · 5.0% vac · 8.0% maint · 8.0% mgmt
Financing live
Cash to close
- Down payment
- $47,475
- Closing costs
- $5,697
- Reserves months
- —
- Total cash needed
- —
Loan-product check · same deal, 3 products live
Conventional
25% down · 7.5% · 30yr
- Down + closing
- —
- Monthly P&I
- —
- Monthly cashflow
- —
- DSCR
- —
- Eligible?
- —
Personal DTI + credit; lowest rate.
DSCR
20% down · 8.5% · 30yr
- Down + closing
- —
- Monthly P&I
- —
- Monthly cashflow
- —
- DSCR
- —
- Eligible?
- —
No personal income docs; deal must DSCR.
Hard money
10% down · 12.0% · 12mo
- Down + closing
- —
- Monthly P&I
- —
- Monthly cashflow
- —
- DSCR
- —
- Eligible?
- —
Short-term bridge; refi at stabilization.
Rent comps 40 comps
| Address | Beds | Baths | Sqft | Rent | $/sqft | DOM | Units | Dist |
|---|---|---|---|---|---|---|---|---|
| 1211 E 18th Ave Unit 2 Tampa, FL | 2.0 | 1.0 | 725 | $1,800 | $2.48 | 17d | 1 | 0.13mi |
| 1003 E 22nd Ave Tampa, FL | 2.0 | 1.0 | 1062 | $1,639 | $1.54 | 4d | 1 | 0.15mi |
| 912 E Saint Clair St Tampa, FL | 2.0 | 1.0 | 1000 | $1,900 | $1.90 | 24d | 1 | 0.16mi |
| 1302 E 21st Ave Tampa, FL | 1.0–2.0 | 1.0–2.0 | 800 | $1,408 | $1.76 | 4d | 9 | 0.20mi |
| 1003 E 15th Ave Tampa, FL | 1.0 | 1.0 | 750 | $1,275 | $1.70 | 24d | 1 | 0.21mi |
| 1221 E Columbus Dr Tampa, FL | 2.0 | 1.0 | 1000 | $1,499 | $1.50 | 24d | 1 | 0.22mi |
| 1307 E 17th Ave Unit El Cafecito Loft Tampa, FL | 1.0 | 1.0 | 600 | $1,450 | $2.42 | 24d | 1 | 0.22mi |
| 1301 E Columbus Dr Unit 1 Tampa, FL | 1.0 | 1.0 | 750 | $1,995 | $2.66 | 24d | 1 | 0.23mi |
| 2817 N Taliaferro Ave Unit 3 Tampa, FL | 1.0 | 1.0 | 650 | $1,275 | $1.96 | 17d | 1 | 0.27mi |
| 2817 N Taliaferro Ave Tampa, FL | 1.0 | 1.0 | 650 | $1,275 | $1.96 | 24d | 1 | 0.27mi |
| 2907 N 15th St Unit D Tampa, FL | 3.0 | 2.0 | 888 | $1,850 | $2.08 | 4d | 1 | 0.32mi |
| 1212 E 25th Ave Tampa, FL | 2.0 | 1.0 | 1035 | $1,490 | $1.44 | 19d | 1 | 0.33mi |
| 1006 E 26th Ave Tampa, FL | 2.0 | 1.0 | 1000 | $1,630 | $1.63 | 4d | 1 | 0.37mi |
| 2810 N 16th St Tampa, FL | 2.0 | 1.0 | 1066 | $2,550 | $2.39 | 12d | 1 | 0.38mi |
| 3005 Sanchez St Unit 5 Tampa, FL | 2.0 | 1.0 | 750 | $1,050 | $1.40 | 2d | 1 | 0.39mi |
| 3005 Sanchez St Unit 3 Tampa, FL | 1.0 | 1.0 | 550 | $995 | $1.81 | 24d | 1 | 0.39mi |
| 3005 Sanchez St Apt 4 Tampa, FL | 1.0 | 1.0 | 550 | $900 | $1.64 | 2d | 1 | 0.39mi |
| 933 E 11th Ave Tampa, FL | 2.0 | 1.0 | 904 | $1,590 | $1.76 | 24d | 1 | 0.40mi |
| 1607 E 18th Ave Tampa, FL | 2.0 | 1.0 | 869 | $2,600 | $2.99 | 12d | 1 | 0.42mi |
| 503 E Columbus Dr Unit 1 Tampa, FL | 2.0 | 1.5 | 1000 | $2,400 | $2.40 | 24d | 1 | 0.45mi |
| 3411 N 13th St Tampa, FL | 3.0 | 2.0 | 978 | $1,895 | $1.94 | 24d | 1 | 0.46mi |
| 1105 E 28th Ave Tampa, FL | 3.0 | 1.0 | 744 | $1,525 | $2.05 | 4d | 1 | 0.47mi |
| 2909 N 17th St Tampa, FL | 2.0 | 1.0 | 750 | $1,350 | $1.80 | 21d | 1 | 0.50mi |
| 418 E Amelia Ave Unit A Tampa, FL | 3.0 | 2.0 | 1050 | $1,800 | $1.71 | 24d | 1 | 0.51mi |
| 418 E Amelia Ave Unit C Tampa, FL | 2.0 | 1.0 | 700 | $1,500 | $2.14 | 24d | 1 | 0.51mi |
| 418 E Amelia Ave Unit G Tampa, FL | 2.0 | 2.0 | 750 | $1,600 | $2.13 | 11d | 1 | 0.51mi |
| 418 E Amelia Ave Unit D Tampa, FL | 2.0 | 1.0 | 700 | $1,300 | $1.86 | 11d | 1 | 0.51mi |
| 1716 E Columbus Dr Unit A Tampa, FL | 2.0 | 1.0 | 924 | $1,800 | $1.95 | 24d | 1 | 0.53mi |
| 709 E James St Tampa, FL | 2.0 | 1.0 | 768 | $1,695 | $2.21 | 12d | 1 | 0.57mi |
| 311 E Floribraska Ave Unit A Tampa, FL | 2.0 | 2.0 | 800 | $2,250 | $2.81 | 17d | 1 | 0.60mi |
| 809 E Baker St Unit A Tampa, FL | 3.0 | 1.0 | 1083 | $2,200 | $2.03 | 24d | 1 | 0.62mi |
| 310 E Frances Ave Unit C Tampa, FL | 2.0 | 1.0 | 925 | $500 | $0.54 | 17d | 1 | 0.63mi |
| 1720 Nick Nuccio Pkwy Tampa, FL | 3.0 | 1.0–3.0 | 955 | $3,170 | $3.32 | 24d | 40 | 0.64mi |
| 1014 E 31st Ave Unit B Tampa, FL | 1.0 | 1.0 | 550 | $995 | $1.81 | 24d | 1 | 0.68mi |
| 1014 E 31st Ave Unit A Tampa, FL | 2.0 | 1.0 | 600 | $1,149 | $1.92 | 24d | 1 | 0.68mi |
| 1620 Nuccio Pkwy Tampa, FL | 2.0 | 1.0–2.0 | 770 | $3,438 | $4.46 | 1d | 308 | 0.68mi |
| 1605 E 29th Ave Tampa, FL | 3.0 | 1.0 | 870 | $1,800 | $2.07 | 20d | 1 | 0.70mi |
| 1810 E Palm Ave #5304 Tampa, FL | 1.0 | 1.0 | 867 | $1,595 | $1.84 | 4d | 1 | 0.71mi |
| 2006 E Columbus Dr Unit A Tampa, FL | 2.0 | 1.0 | 896 | $1,495 | $1.67 | 1d | 1 | 0.72mi |
| 2702 N Florida Ave Unit 8 Tampa, FL | 1.0 | 1.0 | 550 | $1,300 | $2.36 | 24d | 1 | 0.72mi |
Listing history 9 events
-
2025-09-16status Pending
-
2025-07-15status Active
-
2025-07-15price $189,900
-
2025-06-27$215,000 Active
-
2019-10-29historical
-
2019-09-20price $98,000
-
2019-09-03$119,000 Active
-
2002-05-06soldstatus $43,500
-
1987-09-01soldstatus $19,000
ⓘ Source: listings_history table (triggers on properties + properties_extension) + one-shot
backfill from property_details.listing_events for pre-trigger history.
Climate risk First Street
- Flood 1/10 Low FEMA zone X (unshaded) · 0% chance over 30 yrs
- Wildfire 1/10 Low
- Heat 10/10 Extreme 7 d/yr ≥107°F today · 25 d/yr by 30 yrs out
- Wind 9/10 Extreme 99% chance of damaging wind over 30 yrs
- Air quality 3/10 Moderate 3 unhealthy d/yr today · 4 by 30 yrs out
Nearby sold comps map
Loading sold comps map…
Walkable amenities ~0.75 mi
Loading nearby amenities…
Taxation est. · year 1
- Rental income
- $20,593
- − Mortgage interest
- −$10,637
- − Property taxes
- −$2,848
- − Insurance
- −$950
- − Repairs & maintenance
- −$1,647
- − Management
- −$1,647
- − Depreciation
- −$5,524
- Taxable loss
- −$2,661
- Est. tax savings @ 24.0%
- +$639
- After-tax cash flow
- $1,159/yr
For passive investors: Depreciation is non-cash, so a rental often shows a tax loss while cash-flowing — sheltering income. Rental losses are passive: they offset passive income freely, and up to $25,000/yr can offset ordinary (W-2) income if you actively participate and your MAGI is under $100k (phasing out to $0 by $150k); unused losses carry forward. On sale, claimed depreciation is recaptured at up to 25%, and gains may owe capital-gains tax (a 1031 exchange can defer both). Figures are a year-1 estimate at your 24.0% rate — not tax advice; consult a CPA.
Schools (NCES district)
- District
- Hillsborough
- NCES district ID
- 1200870
- Math proficiency
- 47% ▼ -8.00%
- Reading proficiency
- 50% ▼ -4.00%
- Median HH income
- $50,622
- Composite
- 41.6/100
- National rank
- #3435
- State rank
- #41 of 73 in FL
Livability — Tampa
- Score
- 79/100
- State rank
- #142
- US rank
- #2135
Category grades
Schools grade is shown separately in the Schools card above.
Census & demographics
- Census place
- Tampa, FL
- County
- Hillsborough County · 1,540,968 people
- City population
- 523,346
- Metro
- Tampa-St. Petersburg-Clearwater, FL
- Population (ZIP)
- 16,030
- Household income
- $36,975
- Rent vs Own
- Severe rent burden
- 1374.0
Population outlook (Hillsborough County) Hauer SSP2
- Today (2025)
- 1,607,022 people
- By 2030
- 1,733,968 · +7.9%
- By 2040
- 1,979,565 · +23.2%
- By 2050
- 2,203,427 · +37.1%
- By 2075
- 2,667,893 · +66.0%
- By 2100
- 2,891,558 · +79.9%
Race, ethnicity, and origin ACS 2023
- Neighborhood character
- Diverse neighborhood (Simpson 0.66)
- Race & ethnicity
- Black 48% Hispanic / Latino 28% Two or more races 18% White 17% Asian 1%
- Hispanic origin (detail)
- Mexican 6% Puerto Rican 8% Cuban 6% Dominican 1%
- Common ancestry
- Hispanic 2% Romanian 1% Lithuanian 1%
- Foreign-born
- 17% · Canada, Vietnam, Jamaica
- Languages at home
- 72% English-only · Spanish 24% French/Haitian/Cajun 3% Other Asian/Pacific 1%
Political lean MEDSL · Hillsborough
- 2024 margin
- Toss-up / Even · D 47.8% · R 50.9% · Other 1.3%
- 2008→2024 swing
- -10.2pp toward R · 2008: 7.1pp · 2024: -3.1pp
- All cycles
- 2024: R+3.1 2020: D+6.9 2016: D+6.8 2012: D+6.7 2008: D+7.1
Not yet ingested
- Civics
- —
Market trends
- HPI YoY
- ▲ 17.43%
- Current HPI
- 494.1871
- Rent YoY
- ▲ 0.58%
- Metro
- Tampa-St. Petersburg-Clearwater, FL
- State GDP YoY
- ▲ 3.28%
- F500 in state
- 36
Industry mix (Fortune 500 HQ in FL)
| Industry | F500 HQs | Revenue |
|---|---|---|
| Industrial Technology | 2 | $29B |
|
||
| Insurance | 2 | $17B |
|
||
| Retail | 1 | $60B |
|
||
| Technology Distribution | 1 | $58B |
|
||
| Homebuilding | 1 | $35B |
|
||
| Technology Manufacturing | 1 | $35B |
|
||
Price history
+899.5% since first listed9 events — show timeline
- 2025-09-16 Pending — Stellar MLS as Distributed by MLS Grid
- 2025-07-15 Relisted — Stellar MLS as Distributed by MLS Grid
- 2025-07-15 Price Changed $189,900 Stellar MLS as Distributed by MLS Grid
- 2025-06-27 Listed $215,000 Stellar MLS as Distributed by MLS Grid
- 2019-10-29 Listing Removed — Stellar MLS as Distributed by MLS Grid
- 2019-09-20 Price Changed $98,000 Stellar MLS as Distributed by MLS Grid
- 2019-09-03 Listed $119,000 Stellar MLS as Distributed by MLS Grid
- 2002-05-06 Sold (Public Records) $43,500 Public Records
- 1987-09-01 Sold (Public Records) $19,000 Public Records
Property tax history
+12.4%/yrLatest (2025): $307 · +9.7% YoY. Source: county tax records.
Cash-flow waterfall
monthlySold comps — $/sqft
last 12 mo · ≤1 miLoading sold comps…