 🏷️ Likely Rental
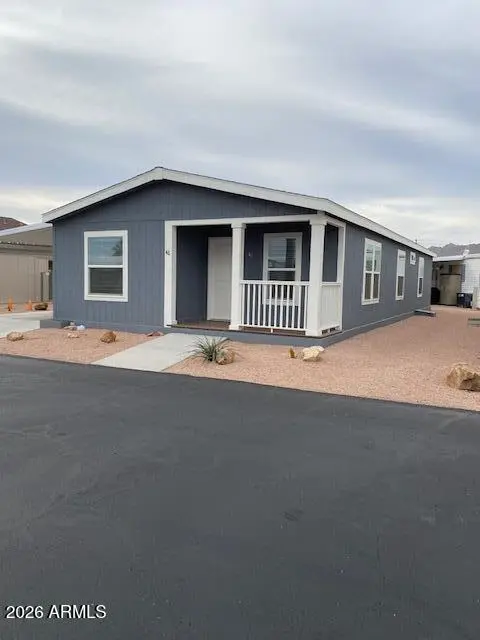
1280 N Ironwood Dr #46 · Apache Junction, AZ
Flood risk 1/10 · Minimal
- FEMA flood zone
- X (shaded)
- Chance of flooding over 30 yrs
- 0.0%
- Est. flood insurance / yr
- $507 – $1,088
Fire risk 5/10 · Moderate
- Est. fire insurance / yr
- $610 – $1,132
Heat risk 8/10 · Major
- Hot days now (above 111°F)
- 6 days/yr
- Hot days in 30 yrs
- 15 days/yr
Wind risk 1/10 · Minimal
- Chance of severe wind over 30 yrs
- —
Air-quality risk 3/10 · Minor
- Unhealthy air days now
- 2 days/yr
- Unhealthy air days in 30 yrs
- 3 days/yr
Risk factors via First Street. Map © Google.
Why this score? — see what drove the B- grade
The composite is a weighted blend of 9 inputs, each scored 0–100. Each bar is that input's sub-score; the figure is the points it added to the 100-point composite (weight × sub-score).
- Cash flow +30.0/30.0
- 1% rule +10.0/10.0
- DSCR +10.0/10.0
- ARV discount +7.5/15.0
- Condition / age +4.0/5.0
- Livability +3.3/5.0
- Rent growth +1.6/5.0
- Schools +1.5/10.0
- Appreciation +0.0/10.0
$99,500
🖨 Deal sheet 📄 Offer letter ✓ Due diligence
Listing remarks
Looking at the 55+ parks? This home is a fantastic opportunity for you! Minutes away from shopping, and many activities, including hiking, water sports on the nearby Canyon Lake or Salt River, and many other options in the area. Easy access to both US 60 and Loop 202. This park has one of the more economical lot rents in the area coming in under $700 per month. Amenities include a community pool, with fire pit/pergola area, and clubhouse, to name a couple. Seller is able to finance, so be sure to ask about terms. Come take a look at your new home!
Key facts
- Parking
- Community pool
- Built 2024
Property features AI
Finance
- Other:
- Financial info: Current financing: Other
- HOA & community: Land lease: $695 monthly; Association fee includes sewer; Community pool; Land lease community
Exterior
- Parking: 1 covered parking space; 1 carport space
- Security:
- Utilities: City water; Private sewer
- Home design: Manufactured/mobile home; Leasehold ownership; Asphalt road access
- Construction: Vinyl siding; Wood frame construction; Composition roof; Builder-reported building area
- Exterior features: Gravel/stone front yard; Gravel/stone backyard; Private maintained road
Interior
- Kitchen: Refrigerator; Dishwasher
- Bedrooms: 3 possible bedrooms
- Flooring: Laminate flooring
- Bathrooms: 2 full bathrooms
- Heating & cooling: Central air conditioning; Has heating
- Interior features: Kitchen island; Full bath in primary bedroom; Storage
- Laundry & utility:
Neighborhood map
What this means for you Summary
Snapshot
- This is a 3-bed/2.0-bath manufactured listed at $100k. Condition is rated good.
Deal economics
- At list price, monthly cash flow is $909 ($11k/yr) — positive.
- The deal already cash-flows at list — no discount required.
- Meets the 1% rule at list price ($2k rent vs $100k).
- Recommended offer: $97k (3.0% below list) — sets the bar for market timing.
- Cap rate 17.3% vs local median 3.5% in Apache Junction — top-decile yield for the area; either an underpriced asset or a hidden risk that comps aren't pricing in. Stress-test before assuming the spread holds.
Location & tenants
- Location reads 66/100 on livability (#70 in AZ) — a middle-class / working-renter tenant base. Strengths: cost of living A+, housing A+; Watch: crime D+, schools F, amenities F.
- Apache Junction Unified District (4443) (suburban): math 15% / reading 20% proficiency, ranked #195 of 249 in AZ (top 78%) — low school quality limits family demand, transient renter base, plan for 1-2y turnover.
- Market conditions: Rents falling (-3.5%/yr); 455 active listings in the ZIP; 8 comparable units currently listed for rent nearby; rentals at typical pace (median 25d on market — plan ~3-4 weeks tenant-placement turnaround); 9,504 units permitted in Pinal County in 2024 (776 in 5+ unit buildings).
- This rent runs 42% of the median local income ($58k/yr) — at the standard rent-burdened threshold; future hikes will face affordability resistance.
Forward outlook
- Local home prices are declining (-3.0%/yr); year-one equity from $688 of loan paydown is wiped out by about $3k of value loss. Plan a longer hold.
- At projected returns (-3.0% appreciation + 0.0% rent growth), your $28k cash investment doubles in ~4 years — after that, you're playing with house money.
Negotiation context
- It's been on market 38 days — a 3% lower offer ($97k) is reasonable based on typical stale-listing flexibility.
Risks & watch-outs
- Climate carrying-cost: moderate wildfire risk; extreme-heat days projected 6→15/yr by 2055 (HVAC capex compounding) — expect insurance premiums to compound above CPI over the hold.
Questions for the listing agent
- It's been on market 38 days. Have you received any prior offers? Is the seller open to a 3% concession, seller financing, or rate buy-down credit?
- Is there a deadline driving the sale (1031 exchange, divorce, estate, relocation)? That informs how much negotiation room exists.
- Schools are F-rated, which usually means shorter tenancies and higher turnover. Who's the typical renter profile here, and what's been the actual vacancy rate?
- Crime grade is D in this area — have there been break-ins, vandalism, or insurance claims at this property in the last 3 years? What carrier currently insures it and at what premium?
- What's the average days-on-market for RENTAL listings here right now (not sales)? A rising rental-DOM trend means longer vacancies and softer asking-rent achievability than the comps imply.
- What's the recent tenant-quality profile in this submarket — average credit score on applications, eviction rate, late-payment / NSF rate, and stable-employment percentage? A property-management company in the area should have these aggregated.
- How much new for-sale + rental construction is in the pipeline within 1–3 miles? Heavy new supply typically softens prices + rents 12–24 months out; constrained supply supports both.
Investment metrics
- 1% rule
- 2.03% ✓
- Cap rate
- 17.26%
- Cash-on-cash
- 39.16%
- DSCR
- 2.74
- GRM
- 4.1
CMA / ARV
- ARV (on-the-fly)
- $279,760
- Comps found
- 12
Show comp detail 12 sales within ~0.75 mi
| Address | Dist | Beds/Ba | Sqft | Sold | Price | $/sf | Match |
|---|---|---|---|---|---|---|---|
| 1231 W Roundup St | 0.29mi | 3/2.0 | 1,405 (+4%) | 6mo | $328,000 | $233 | 74 |
| 1280 N Ironwood Dr #6 | 0.00mi | 2/2.0 (-1) | 1,152 (-14%) | 4mo | $45,600 | $40 | 68 |
| 2292 N Ironwood Dr #129 | 0.62mi | 3/2.0 | 1,344 (-0%) | 9mo | $83,000 | $62 | 63 |
| 2685 W Foothill St | 0.75mi | 3/2.0 | 1,378 (+2%) | 0mo | $305,000 | $221 | 61 |
| 1479 N Delaware Dr | 0.42mi | 2/2.0 (-1) | 1,248 (-7%) | 8mo | $311,000 | $249 | 57 |
| 488 N Saguaro Dr | 0.50mi | 3/1.5 | 1,201 (-11%) | 2mo | $260,000 | $216 | 55 |
| 2292 N Ironwood Dr #128 | 0.63mi | 3/2.0 | 1,232 (-8%) | 3mo | $84,000 | $68 | 54 |
| 1113 W Manzanita St | 0.36mi | 3/2.0 | 1,537 (+14%) | 8mo | $320,000 | $208 | 53 |
| 2292 N Ironwood Dr #127 | 0.62mi | 2/2.0 (-1) | 1,232 (-8%) | 3mo | $70,300 | $57 | 50 |
| 2292 N Ironwood Dr #08 | 0.63mi | 3/2.0 | 1,200 (-11%) | 5mo | $79,000 | $66 | 49 |
| 2158 N Gold Dr | 0.58mi | 2/2.0 (-1) | 1,248 (-7%) | 9mo | $286,000 | $229 | 48 |
| 2625 W Manzanita St | 0.59mi | 3/2.0 | 1,537 (+14%) | 3mo | $104,000 | $68 | 46 |
Match score weights: distance 35% · size 25% · config 20% · recency 20%. Top-matched comps best support the ARV.
Projected returns pro-forma
-3.0% appreciation · 0.0% rent growth · sell at horizon
- IRR
- 31.9%
- Equity multiple
- 2.29×
- Total profit
- $35,883
- Equity at exit
- $14,836
- IRR
- 37.4%
- Equity multiple
- 3.98×
- Total profit
- $83,033
- Equity at exit
- $8,603
Cash invested: $27,860 (down + closing). Projections, not guarantees.
Landlord ↔ Tenant lean methodology
- Overall (STATE)
- 87 Strongly Landlord-Friendly
- State Arizona
- 87 Strongly Landlord-Friendly · R+3
- County
- — inherits STATE
- City
- — inherits STATE
ZIP-level market 85120
- Home prices YoY
- -29.0%
- Rents YoY
- -3.5%
- Active inventory
- 455
- Price-to-rent
- 4.1×
Monthly cashflow live
- Estimated rent
- $2,021 high interval (Pro) →
- Mortgage (P&I)
- −$522
- Tax est. 1.5%
- −$124 /mo · $1,492/yr
- Insurance
- −$41
- HOA
- −$0
- Vacancy / Maint / Mgmt
- −$424
- Net cashflow
- $909
Break-even live
UW: 25.0% down · 7.5% · 30yr · 1.5% tax · 5.0% vac · 8.0% maint · 8.0% mgmt
Financing live
Cash to close
- Down payment
- $24,875
- Closing costs
- $2,985
- Reserves months
- —
- Total cash needed
- —
Loan-product check · same deal, 3 products live
Conventional
25% down · 7.5% · 30yr
- Down + closing
- —
- Monthly P&I
- —
- Monthly cashflow
- —
- DSCR
- —
- Eligible?
- —
Personal DTI + credit; lowest rate.
DSCR
20% down · 8.5% · 30yr
- Down + closing
- —
- Monthly P&I
- —
- Monthly cashflow
- —
- DSCR
- —
- Eligible?
- —
No personal income docs; deal must DSCR.
Hard money
10% down · 12.0% · 12mo
- Down + closing
- —
- Monthly P&I
- —
- Monthly cashflow
- —
- DSCR
- —
- Eligible?
- —
Short-term bridge; refi at stabilization.
Rent comps 8 comps
| Address | Beds | Baths | Sqft | Rent | $/sqft | DOM | Units | Dist |
|---|---|---|---|---|---|---|---|---|
| 1877 W Overland St Apache Junction, AZ | 3.0 | 2.0 | 1420 | $1,999 | $1.41 | 16d | 1 | 0.20mi |
| 651 N Ironwood Dr Apache Junction, AZ | 3.0 | 2.5 | 1748 | $2,408 | $1.38 | 5d | 13 | 0.43mi |
| 2185 W Ohio St Apache Junction, AZ | 2.0 | 1.0 | 1000 | $1,295 | $1.29 | 4d | 1 | 0.58mi |
| 2292 N Ironwood Dr Apache Junction, AZ | 2.0 | 2.0 | 1152 | $1,475 | $1.28 | 24d | 1 | 0.62mi |
| 455 N Delaware Dr Unit 7 Apache Junction, AZ | 2.0 | 2.0 | 1060 | $1,900 | $1.79 | 24d | 1 | 0.67mi |
| 1440 N Idaho Rd Apache Junction, AZ | 1.0–2.0 | 1.0–1.5 | 1010 | $1,900 | $1.88 | 24d | 3 | 1.02mi |
| 455 S Delaware Dr Unit 179 Apache Junction, AZ | 2.0 | 2.0 | 1060 | $2,395 | $2.26 | 24d | 1 | 1.22mi |
| 455 S Delaware Dr Apache Junction, AZ | 2.0 | 2.0 | 1060 | $2,048 | $1.93 | 20d | 2 | 1.22mi |
Listing history 9 events
-
2026-06-09days on market $99,500 Active 38 DOM
-
2026-06-08days on market $99,500 Active 37 DOM
-
2026-06-07days on market $99,500 Active 36 DOM
-
2026-06-04days on market $99,500 Active 33 DOM
-
2026-06-03days on market $99,500 Active 32 DOM
-
2026-06-02days on market $99,500 Active 31 DOM
-
2026-06-01days on market $99,500 Active 30 DOM
-
2026-05-31days on market $99,500 Active 29 DOM
-
2026-04-27$99,500 Active
ⓘ Source: listings_history table (triggers on properties + properties_extension) + one-shot
backfill from property_details.listing_events for pre-trigger history.
Climate risk First Street
- Flood 1/10 Low FEMA zone X (shaded) · 0% chance over 30 yrs
- Wildfire 5/10 Major
- Heat 8/10 Severe 6 d/yr ≥111°F today · 15 d/yr by 30 yrs out
- Wind 1/10 Low
- Air quality 3/10 Moderate 2 unhealthy d/yr today · 3 by 30 yrs out
Nearby sold comps map
Loading sold comps map…
Walkable amenities ~0.75 mi
Loading nearby amenities…
Taxation est. · year 1
- Rental income
- $24,253
- − Mortgage interest
- −$5,574
- − Property taxes
- −$1,492
- − Insurance
- −$498
- − Repairs & maintenance
- −$1,940
- − Management
- −$1,940
- − Depreciation
- −$2,895
- Taxable income
- $9,915
- Est. tax owed @ 24.0%
- −$2,380
- After-tax cash flow
- $8,529/yr
For passive investors: Depreciation is non-cash, so a rental often shows a tax loss while cash-flowing — sheltering income. Rental losses are passive: they offset passive income freely, and up to $25,000/yr can offset ordinary (W-2) income if you actively participate and your MAGI is under $100k (phasing out to $0 by $150k); unused losses carry forward. On sale, claimed depreciation is recaptured at up to 25%, and gains may owe capital-gains tax (a 1031 exchange can defer both). Figures are a year-1 estimate at your 24.0% rate — not tax advice; consult a CPA.
Condition & rehab AI · 6 photos
This 55+ park home is in good condition with a good exterior and interior. It has a good foundation and structure, and the HVAC system appears to be in good condition. The home has a good curb appeal and landscaping. The home is move-in ready and has a good resale and rental potential.
Value-add opportunities
- Both Painting the exterior and interior walls — Fresh paint can enhance the curb appeal and interior aesthetics.
- Both Landscaping improvements — A well-maintained landscape can increase both resale and rental value.
- Both Upgrading the kitchen appliances — Modern appliances can attract more buyers and renters.
- Both Adding a smart home system — Smart home features can increase both resale and rental value by making the home more convenient and energy-efficient.
Renovation cost estimate screening
Value-add ROI direction
- Both Painting the exterior and interior walls — Fresh paint can enhance the curb appeal and interior aesthetics. ↑
- Both Landscaping improvements — A well-maintained landscape can increase both resale and rental value. ↑
- Both Upgrading the kitchen appliances — Modern appliances can attract more buyers and renters. ↑
- Both Adding a smart home system — Smart home features can increase both resale and rental value by making the home more convenient and energy-efficient. ↑
ⓘ Cost ranges are severity-bucket heuristics (US national rule-of-thumb). Get contractor quotes + a written scope before underwriting a rehab budget.
Schools (NCES district)
- District
- Apache Junction Unified District (4443)
- NCES district ID
- 0400790
- Math proficiency
- 15% ▼ -17.00%
- Reading proficiency
- 20% ▼ -13.00%
- Median HH income
- $44,930
- Composite
- 15.34/100
- National rank
- #9325
- State rank
- #195 of 249 in AZ
Livability — Apache Junction
- Score
- 66/100
- State rank
- #70
- US rank
- #11242
Category grades
Schools grade is shown separately in the Schools card above.
Census & demographics
- Census place
- Apache Junction, AZ
- County
- Pinal County · 399,947 people
- City population
- 56,611
- Metro
- Phoenix-Mesa-Chandler, AZ
- Population (ZIP)
- 31,191
- Household income
- $57,786
- Rent vs Own
- Severe rent burden
- 686.0
Population outlook (Pinal County) Hauer SSP2
- Today (2025)
- 437,574 people
- By 2030
- 446,903 · +2.1%
- By 2040
- 452,589 · +3.4%
- By 2050
- 444,126 · +1.5%
- By 2075
- 430,300 · -1.7%
- By 2100
- 393,536 · -10.1%
Race, ethnicity, and origin ACS 2023
- Neighborhood character
- Predominantly White (77%)
- Race & ethnicity
- White 77% Hispanic / Latino 16% Two or more races 10% Asian 1%
- Hispanic origin (detail)
- Mexican 13%
- Common ancestry
- Romanian 3% Lithuanian 3% Portuguese 3%
- Foreign-born
- 7% · Canada
- Languages at home
- 89% English-only · Spanish 8% Tagalog/Filipino 1%
Political lean MEDSL · Pinal
- 2024 margin
- Strong R (+22.1) · D 38.5% · R 60.6%
- 2008→2024 swing
- -7.6pp toward R · 2008: -14.5pp · 2024: -22.1pp
- All cycles
- 2024: R+22.1 2020: R+17.3 2016: R+19.3 2012: R+17.1 2008: R+14.5
Not yet ingested
- Civics
- —
Market trends
- HPI YoY
- ▼ -128.31%
- Current HPI
- 313.4666
- Rent YoY
- ▼ -3.50%
- Metro
- Phoenix-Mesa-Chandler, AZ
- State GDP YoY
- ▲ 4.54%
- F500 in state
- 20
Industry mix (Fortune 500 HQ in AZ)
| Industry | F500 HQs | Revenue |
|---|---|---|
| Technology | 2 | $13B |
|
||
| Mining / Metals | 1 | $23B |
|
||
| Environmental Services | 1 | $16B |
|
||
| Metals / Steel | 1 | $14B |
|
||
| Technology Distribution | 1 | $9B |
|
||
| Homebuilding | 1 | $8B |
|
||
Price history
1 event — show timeline
- 2026-04-27 Listed $99,500 ARMLS
Cash-flow waterfall
monthlySold comps — $/sqft
last 12 mo · ≤1 miLoading sold comps…