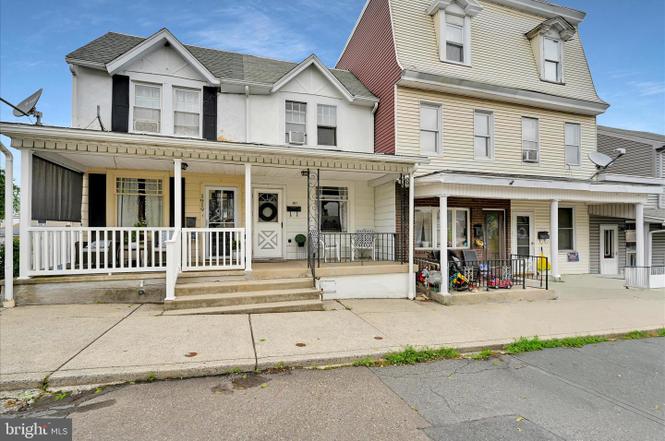
1917 W Walnut St · Ashland, PA
Flood risk 1/10 · Minimal
- FEMA flood zone
- X (unshaded)
- Chance of flooding over 30 yrs
- 0.0%
- Est. flood insurance / yr
- $473 – $860
Fire risk 3/10 · Minor
- Est. fire insurance / yr
- $511 – $949
Heat risk 4/10 · Minor
- Hot days now (above 94°F)
- 7 days/yr
- Hot days in 30 yrs
- 16 days/yr
Wind risk 3/10 · Minor
- Chance of severe wind over 30 yrs
- 6.0%
Air-quality risk 2/10 · Minimal
- Unhealthy air days now
- 1 days/yr
- Unhealthy air days in 30 yrs
- 2 days/yr
Risk factors via First Street. Map © Google.
Why this score? — see what drove the B grade
The composite is a weighted blend of 9 inputs, each scored 0–100. Each bar is that input's sub-score; the figure is the points it added to the 100-point composite (weight × sub-score).
- Cash flow +30.0/30.0
- 1% rule +10.0/10.0
- DSCR +10.0/10.0
- Appreciation +10.0/10.0
- Livability +3.2/5.0
- ARV discount +2.8/15.0
- Schools +2.8/10.0
- Rent growth +2.5/5.0
- Condition / age +2.5/5.0
$69,000
🖨 Deal sheet (PDF) 📄 Offer letter ✓ Due diligence
Listing remarks
Welcome home to this cheerful and move-in ready home on quiet Walnut Street in Ashland! Filled with natural light and decorated in tasteful, modern colors throughout, this well-maintained home offers spacious rooms, comfortable living areas, and a warm, inviting atmosphere from the moment you step inside. The large backyard provides plenty of space for outdoor fun, gardening, or a play area for the kids, while the expansive basement offers abundant storage and endless possibilities. Clean, bright, and ready for its next owner simply unpack and start enjoying all this wonderful home has to offer!
Key facts
- Large backyard
- Natural light
- Expansive basement
Tags
Property features AI
Exterior
- Parking: On-street parking
- Utilities: Public water; Public sewer
- Home design: Interior townhouse/rowhouse; Fee simple ownership; Estimated year built
- Construction: Vinyl siding; Block foundation; Architectural shingle roof
- Exterior features: 13 x 100 lot dimensions; Not in a federal flood zone
Interior
- Bedrooms: Three bedrooms on the upper level
- Bathrooms: One full bathroom
- Heating & cooling: Baseboard hot water heating; Oil-fired heating and hot water
- Interior features: Estimated living area; No basement
Neighborhood map
What this means for you Summary
Snapshot
- This is a 3-bed/1.0-bath townhouse listed at $69k.
Deal economics
- At list price, monthly cash flow is $267 ($3k/yr) — positive.
- The deal already cash-flows at list — no discount required.
- Meets the 1% rule at list price ($1k rent vs $69k).
Location & tenants
- Location reads 64/100 on livability (#1,179 in PA) — a middle-class / working-renter tenant base. Strengths: crime A+, cost of living A+, housing A+; Watch: amenities F, commute F, employment F.
- North Schuylkill SD (rural): math 19% / reading 48% proficiency, ranked #429 of 539 in PA (top 80%) — families likely to look elsewhere, expect single-tenant / working-renter base with shorter leases.
- Zoned schools: North Schuylkill Jshs (math 21% / reading 47%, grade F, #318 of 437 statewide, top 73%, 1,008 students, 51% FRL) — zoned schools average 51% FRL vs 35% district-wide (16 pts higher); higher-poverty schools than district average — tighter screening recommended.
- Market conditions: 48 active listings in the ZIP; 1 comparable units currently listed for rent nearby; 169 units permitted in Schuylkill County in 2024 (0 in 5+ unit buildings).
Forward outlook
- In year one you build about $7k of equity ($477 loan paydown + $7k appreciation (10.0% local appreciation)).
- Schuylkill County population projected at -16% by 2050 — secular population decline; favor cash flow + early exit over multi-decade hold.
- At projected returns (10.0% appreciation + 3.0% rent growth), your $19k cash investment doubles in ~2 years — after that, you're playing with house money.
- By year 5, paydown + projected appreciation supports a ~$34k cash-out refi (75% LTV) — recoverable capital for the next deal without selling this one.
Negotiation context
- Only 3 days on market — expect competitive offers; lowballing is unlikely to land.
Risks & watch-outs
- Watch-outs: property tax is 3.3% of price; built in 1900 — expect roof / HVAC / electrical / plumbing capex.
Questions for the listing agent
- Built in 1900 — when were the roof, HVAC, electrical panel, plumbing, and water heater last replaced?
- Property tax is high relative to price — has the assessment been appealed recently, and will the sale trigger a re-assessment?
- Is there a deadline driving the sale (1031 exchange, divorce, estate, relocation)? That informs how much negotiation room exists.
- Schools are D-rated, which usually means shorter tenancies and higher turnover. Who's the typical renter profile here, and what's been the actual vacancy rate?
- What's the average days-on-market for RENTAL listings here right now (not sales)? A rising rental-DOM trend means longer vacancies and softer asking-rent achievability than the comps imply.
- What's the recent tenant-quality profile in this submarket — average credit score on applications, eviction rate, late-payment / NSF rate, and stable-employment percentage? A property-management company in the area should have these aggregated.
- How much new for-sale + rental construction is in the pipeline within 1–3 miles? Heavy new supply typically softens prices + rents 12–24 months out; constrained supply supports both.
Investment metrics
- 1% rule
- 1.56% ✓
- Cap rate
- 10.93%
- Cash-on-cash
- 16.55%
- DSCR
- 1.74
- GRM
- 5.3
CMA / ARV
- ARV (on-the-fly)
- $62,525
- Comps found
- 10
Show comp detail 10 sales within ~0.75 mi
| Address | Dist | Beds/Ba | Sqft | Sold | Price | $/sf | Match |
|---|---|---|---|---|---|---|---|
| 1613 Walnut St | 0.17mi | 3/1.5 | 1,164 (+14%) | 2mo | $120,000 | $103 | 66 |
| 819 Market St | 0.59mi | 3/1.0 | 1,043 (+2%) | 10mo | $45,000 | $43 | 62 |
| 906 Walnut St | 0.55mi | 2/1.0 (-1) | 1,032 (+1%) | 9mo | $90,000 | $87 | 61 |
| 923 Brock St | 0.54mi | 2/1.0 (-1) | 990 (-3%) | 5mo | $26,000 | $26 | 60 |
| 1705 Market St | 0.18mi | 3/1.5 | 1,140 (+11%) | 15mo | $90,000 | $79 | 58 |
| 1306 Market St | 0.35mi | 3/1.5 | 1,085 (+6%) | 20mo | $55,000 | $51 | 56 |
| 1125 Market St | 0.44mi | 3/1.0 | 1,152 (+12%) | 7mo | $90,000 | $78 | 53 |
| 1329 Spruce St | 0.31mi | 3/1.5 | 1,112 (+8%) | 20mo | $68,000 | $61 | 53 |
| 1210 Walnut St | 0.39mi | 3/2.0 | 1,156 (+13%) | 14mo | $42,500 | $37 | 45 |
| 718 Brock St | 0.64mi | 4/1.5 (+1) | 1,098 (+7%) | 21mo | $50,000 | $46 | 34 |
Match score weights: distance 35% · size 25% · config 20% · recency 20%. Top-matched comps best support the ARV.
Projected returns pro-forma
10.0% appreciation · 3.0% rent growth · sell at horizon
- IRR
- 36.6%
- Equity multiple
- 3.83×
- Total profit
- $54,635
- Equity at exit
- $62,161
- IRR
- 31.5%
- Equity multiple
- 8.65×
- Total profit
- $147,703
- Equity at exit
- $134,052
Cash invested: $19,320 (down + closing). Projections, not guarantees.
Landlord ↔ Tenant lean methodology
- Overall (STATE)
- 62 Landlord-Friendly
- State Pennsylvania
- 62 Landlord-Friendly · EVEN
- County
- — inherits STATE
- City
- — inherits STATE
ZIP-level market 17921
- Home prices YoY
- 21.7%
- Active inventory
- 48
- Price-to-rent
- 5.3×
Monthly cashflow live
- Estimated rent
- $1,075 medium interval (Pro) →
- Mortgage (P&I)
- −$362
- Tax from tax record
- −$192 /mo · $2,306/yr
- Insurance
- −$29
- HOA
- −$0
- Vacancy / Maint / Mgmt
- −$226
- Net cashflow
- $267
Break-even live
Sensitivity live
| Price | -10% $306 | -5% $286 | +0% $267 | +5% $247 | +10% $227 |
|---|---|---|---|---|---|
| Rent | -10% $182 | -5% $224 | +0% $267 | +5% $309 | +10% $351 |
| Rate | -1.0pp $301 | -0.5pp $284 | base $267 | +0.5pp $249 | +1.0pp $230 |
UW: 25.0% down · 7.5% · 30yr · 1.5% tax · 5.0% vac · 8.0% maint · 8.0% mgmt
Financing live
Cash to close
- Down payment
- $17,250
- Closing costs
- $2,070
- Reserves months
- —
- Total cash needed
- —
Loan-product check · same deal, 3 products live
Conventional
25% down · 7.5% · 30yr
- Down + closing
- —
- Monthly P&I
- —
- Monthly cashflow
- —
- DSCR
- —
- Eligible?
- —
Personal DTI + credit; lowest rate.
DSCR
20% down · 8.5% · 30yr
- Down + closing
- —
- Monthly P&I
- —
- Monthly cashflow
- —
- DSCR
- —
- Eligible?
- —
No personal income docs; deal must DSCR.
Hard money
10% down · 12.0% · 12mo
- Down + closing
- —
- Monthly P&I
- —
- Monthly cashflow
- —
- DSCR
- —
- Eligible?
- —
Short-term bridge; refi at stabilization.
Rent comps 1 comps
| Address | Beds | Baths | Sqft | Rent | $/sqft | DOM | Units | Dist |
|---|---|---|---|---|---|---|---|---|
| 1313 Spruce St Ashland, PA | 2.0 | 1.0 | 1350 | $1,075 | $0.80 | 44d | 1 | 0.32mi |
Listing history 4 events
-
2026-06-18days on market $69,000 Active 3 DOM
-
2026-06-17days on market $69,000 Active 2 DOM
-
2026-06-16remarks 602-char remark
-
2026-06-16$69,000 Active 1 DOM
ⓘ Source: listings_history table (triggers on properties + properties_extension) + one-shot
backfill from property_details.listing_events for pre-trigger history.
Tax reassessment forecast PA · Partial reset (capped growth)
- Current annual tax
- $2,306 · $192/mo
- Projected year-2 tax
- $2,306 · $192/mo
- Expected delta
- $0/yr ($0/mo · 0.0%)
ⓘ Screening estimate from a state-policy table — verify with the county assessor before closing.
Climate risk First Street
- Flood 1/10 Low FEMA zone X (unshaded) · 0% chance over 30 yrs
- Wildfire 3/10 Moderate
- Heat 4/10 Moderate 7 d/yr ≥94°F today · 16 d/yr by 30 yrs out
- Wind 3/10 Moderate 6% chance of damaging wind over 30 yrs
- Air quality 2/10 Low 1 unhealthy d/yr today · 2 by 30 yrs out
Nearby sold comps map
Loading sold comps map…
Walkable amenities ~0.75 mi
Loading nearby amenities…
Taxation est. · year 1
- Rental income
- $12,900
- − Mortgage interest
- −$3,865
- − Property taxes
- −$2,306
- − Insurance
- −$345
- − Repairs & maintenance
- −$1,032
- − Management
- −$1,032
- − Depreciation
- −$2,007
- Taxable income
- $2,313
- Est. tax owed @ 24.0%
- −$555
- After-tax cash flow
- $2,643/yr
For passive investors: Depreciation is non-cash, so a rental often shows a tax loss while cash-flowing — sheltering income. Rental losses are passive: they offset passive income freely, and up to $25,000/yr can offset ordinary (W-2) income if you actively participate and your MAGI is under $100k (phasing out to $0 by $150k); unused losses carry forward. On sale, claimed depreciation is recaptured at up to 25%, and gains may owe capital-gains tax (a 1031 exchange can defer both). Figures are a year-1 estimate at your 24.0% rate — not tax advice; consult a CPA.
Schools (NCES district)
- District
- North Schuylkill SD
- NCES district ID
- 4210110
- Math proficiency
- 19% ▼ -14.00%
- Reading proficiency
- 48% ▼ -8.00%
- Median HH income
- $43,529
- Composite
- 28.37/100
- National rank
- #6770
- State rank
- #429 of 539 in PA
Livability — Ashland
- Score
- 64/100
- State rank
- #1179
- US rank
- #13787
Category grades
Schools grade is shown separately in the Schools card above.
Census & demographics
- Census place
- Ashland, PA
- Population (ZIP)
- 7,029
Population outlook (Schuylkill County) Hauer SSP2
- Today (2025)
- 137,447 people
- By 2030
- 133,121 · -3.1%
- By 2040
- 124,172 · -9.7%
- By 2050
- 115,611 · -15.9%
- By 2075
- 100,796 · -26.7%
- By 2100
- 86,667 · -36.9%
Race, ethnicity, and origin ACS 2023
- Neighborhood character
- Predominantly White (83%)
- Race & ethnicity
- White 83% Black 10% Hispanic / Latino 4% Two or more races 3%
- Common ancestry
- Romanian 10% Iranian 4% Polish 3%
- Foreign-born
- 1% · Canada
- Languages at home
- 95% English-only · Spanish 4% Other Indo-European 1%
Political lean MEDSL · Schuylkill
- 2024 margin
- Solid R (+42.1) · D 28.5% · R 70.6%
- 2008→2024 swing
- -33.4pp toward R · 2008: -8.7pp · 2024: -42.1pp
- All cycles
- 2024: R+42.1 2020: R+39.9 2016: R+43.4 2012: R+13.4 2008: R+8.7
Not yet ingested
- Civics
- —
Market trends
- HPI YoY
- ▲ 62.11%
- Current HPI
- 347.8425
- Rent YoY
- —
- Metro
- —
- State GDP YoY
- ▲ 1.68%
- F500 in state
- 34
Industry mix (Fortune 500 HQ in PA)
| Industry | F500 HQs | Revenue |
|---|---|---|
| Healthcare | 2 | $309B |
|
||
| Insurance | 2 | $27B |
|
||
| Telecommunications / Media | 1 | $124B |
|
||
| Industrial Distribution | 1 | $22B |
|
||
| Financial Services | 1 | $20B |
|
||
| Chemicals / Materials | 1 | $18B |
|
||
Price history
1 event — show timeline
- 2026-06-15 Listed $69,000 BRIGHT MLS
Property tax history
+9.0%/yrLatest (2026): $2,306 · +94.7% YoY. Source: county tax records.
Cash-flow waterfall
monthlySold comps — $/sqft
last 12 mo · ≤1 miLoading sold comps…