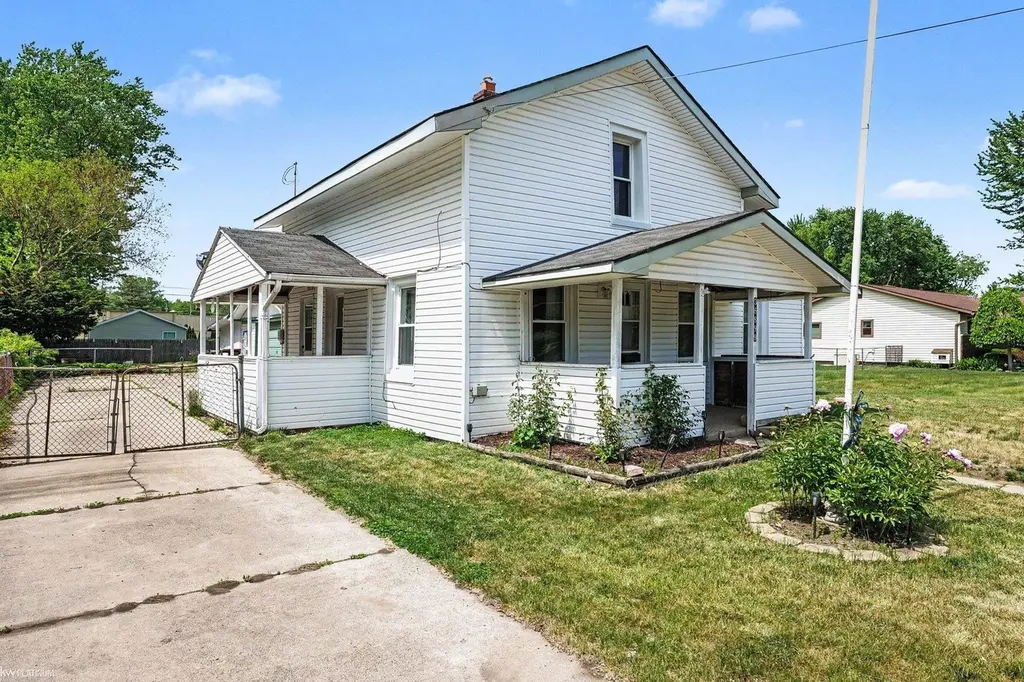
36899 Main St · New Baltimore, MI
Flood risk 1/10 · Minimal
- FEMA flood zone
- X (unshaded)
- Chance of flooding over 30 yrs
- 0.0%
- Est. flood insurance / yr
- $473 – $860
Fire risk 1/10 · Minimal
- Est. fire insurance / yr
- $784 – $1,456
Heat risk 3/10 · Minor
- Hot days now (above 96°F)
- 7 days/yr
- Hot days in 30 yrs
- 15 days/yr
Wind risk 1/10 · Minimal
- Chance of severe wind over 30 yrs
- —
Air-quality risk 4/10 · Minor
- Unhealthy air days now
- 4 days/yr
- Unhealthy air days in 30 yrs
- 6 days/yr
Risk factors via First Street. Map © Google.
Why this score? — see what drove the C grade
The composite is a weighted blend of 9 inputs, each scored 0–100. Each bar is that input's sub-score; the figure is the points it added to the 100-point composite (weight × sub-score).
- Cash flow +18.8/30.0
- ARV discount +15.0/15.0
- DSCR +5.9/10.0
- 1% rule +5.0/10.0
- Schools +4.4/10.0
- Livability +4.2/5.0
- Rent growth +2.5/5.0
- Condition / age +2.5/5.0
- Appreciation +0.0/10.0
$179,900
🖨 Deal sheet 📄 Offer letter ✓ Due diligence
Listing remarks MLS
Opportunity awaits on historic Main Street in New Baltimore! This charming fixer-upper is packed with potential and perfectly positioned just one block from the lake. Offering approximately 1,300 square feet, three bedrooms, two full baths, and a large detached garage, this home is ready for your vision and personal touch. Enjoy the convenience of being within walking distance to downtown New Baltimore’s beach, restaurants, shopping, and waterfront attractions. Whether you’re looking for an investment opportunity, weekend retreat, or place to call home, this property offers an unbeatable location and endless possibilities. For added peace of mind, the seller is including a complimentary one year home warranty.
Key facts
- 8,276 sq ft lot
- 2 garage spots
- Built 1940
Tags
Property features AI
Finance
- Other: Subdivision: A/P # 02 NEW BALTIMORE; Cross streets: Green Street / County Line
- HOA & community: Homeowners association present
Exterior
- Parking: Detached 2-car garage; Additional garage structures
- Utilities: Public water; Public sewer
- Home design: Single family residence; Two levels
- Construction: Vinyl siding
- Exterior features: Fenced yard; Public maintained road
Interior
- Kitchen: Oven; Range; Refrigerator
- Bedrooms: Total rooms: 9
- Bathrooms: 2 full bathrooms
- Heating & cooling: Forced air heating; Natural gas heating; No central cooling
- Interior features: Eat-in kitchen; Pantry; Crawl space basement
- Laundry & utility: Gas water heater
Neighborhood map
What this means for you Summary
Snapshot
- This is a 3-bed/1.0-bath single-family listed at $180k.
Deal economics
- At list price, monthly cash flow is $182 ($2k/yr) — positive.
- The deal already cash-flows at list — no discount required.
- Meets the 1% rule at list price ($2k rent vs $180k).
- Cap rate 7.5% vs local median 2.5% in New Baltimore — top-decile yield for the area; either an underpriced asset or a hidden risk that comps aren't pricing in. Stress-test before assuming the spread holds.
Location & tenants
- Location reads 85/100 on livability (#30 in MI, #597 nationally) — a professional / high-income tenant draw. Strengths: crime A+, employment A+, cost of living A+; Watch: health & safety D+, amenities F.
- Anchor Bay School District (suburban): math 44% / reading 54% proficiency, ranked #91 of 540 in MI (top 17%) — families likely to look elsewhere, expect single-tenant / working-renter base with shorter leases; only 20% free/reduced lunch — higher-income household profile.
- Market conditions: 236 active listings in the ZIP; 1 comparable units currently listed for rent nearby; solid renter incomes; 1,321 units permitted in Macomb County in 2024 (86 in 5+ unit buildings).
Forward outlook
- Local home prices are declining (-3.0%/yr); year-one equity from $1k of loan paydown is wiped out by about $5k of value loss. Plan a longer hold.
- Macomb County population projected at +9% by 2050 — modest demand growth; plan on rents tracking national, not racing it.
Negotiation context
- Only 5 days on market — expect competitive offers; lowballing is unlikely to land.
- 6 sale attempts since 21y ago with the ask held roughly flat each time — persistent listings suggest the price (not the market) is what's stuck; bring a comps-based counter.
- Current owner paid $32k; list at $180k implies a 462% gain — meaningful room to come down on a strong offer.
Risks & watch-outs
- Watch-outs: built in 1940 — expect roof / HVAC / electrical / plumbing capex.
Questions for the listing agent
- Built in 1940 — when were the roof, HVAC, electrical panel, plumbing, and water heater last replaced?
- Is there a deadline driving the sale (1031 exchange, divorce, estate, relocation)? That informs how much negotiation room exists.
- Schools are B-rated — typically a magnet for longer-tenancy family renters. What's the average tenant stay here, and is there a school-zone premium baked into asking?
- What's the average days-on-market for RENTAL listings here right now (not sales)? A rising rental-DOM trend means longer vacancies and softer asking-rent achievability than the comps imply.
- What's the recent tenant-quality profile in this submarket — average credit score on applications, eviction rate, late-payment / NSF rate, and stable-employment percentage? A property-management company in the area should have these aggregated.
- How much new for-sale + rental construction is in the pipeline within 1–3 miles? Heavy new supply typically softens prices + rents 12–24 months out; constrained supply supports both.
Investment metrics
- 1% rule
- 1.00% ✓
- Cap rate
- 7.50%
- Cash-on-cash
- 4.33%
- DSCR
- 1.19
- GRM
- 8.3
CMA / ARV
- ARV (on-the-fly)
- $247,760
- Comps found
- 12
Show comp detail 12 sales within ~0.75 mi
| Address | Dist | Beds/Ba | Sqft | Sold | Price | $/sf | Match |
|---|---|---|---|---|---|---|---|
| 50848 Ashley St | 0.14mi | 3/2.5 | 1,356 (+4%) | 11mo | $330,000 | $243 | 72 |
| 50759 Holt St | 0.25mi | 3/1.0 | 1,172 (-10%) | 0mo | $205,000 | $175 | 71 |
| 50697 Elsey St | 0.53mi | 3/1.0 | 1,344 (+3%) | 3mo | $207,300 | $154 | 68 |
| 52890 James St | 0.50mi | 3/1.0 | 1,272 (-2%) | 10mo | $242,000 | $190 | 64 |
| 51145 Clay St | 0.60mi | 3/1.0 | 1,324 (+2%) | 9mo | $150,400 | $114 | 62 |
| 50725 Baltimore St | 0.23mi | 3/1.5 | 1,450 (+11%) | 8mo | $750,000 | $517 | 62 |
| 51248 Maria St | 0.47mi | 3/1.0 | 1,193 (-8%) | 3mo | $217,500 | $182 | 61 |
| 51470 Washington St | 0.49mi | 3/2.5 | 1,266 (-3%) | 10mo | $300,000 | $237 | 58 |
| 51440 Washington St | 0.48mi | 3/1.0 | 1,218 (-7%) | 13mo | $240,000 | $197 | 56 |
| 50677 Elsey St | 0.53mi | 3/1.0 | 1,431 (+10%) | 22mo | $242,500 | $169 | 41 |
| 51126 Rose St | 0.69mi | 2/1.0 (-1) | 1,400 (+7%) | 12mo | $220,000 | $157 | 41 |
| 38125 Murdick Dr | 0.75mi | 3/1.5 | 1,190 (-9%) | 16mo | $250,000 | $210 | 35 |
Match score weights: distance 35% · size 25% · config 20% · recency 20%. Top-matched comps best support the ARV.
Projected returns pro-forma
-3.0% appreciation · 3.0% rent growth · sell at horizon
- IRR
- -9.5%
- Equity multiple
- 0.65×
- Total profit
- $-17,550
- Equity at exit
- $26,824
- IRR
- -0.1%
- Equity multiple
- 0.99×
- Total profit
- $-263
- Equity at exit
- $15,554
Cash invested: $50,372 (down + closing). Projections, not guarantees.
Landlord ↔ Tenant lean methodology
- Overall (STATE)
- 62 Landlord-Friendly
- State Michigan
- 62 Landlord-Friendly · EVEN
- County
- — inherits STATE
- City
- — inherits STATE
ZIP-level market 48047
- Active inventory
- 236
- Price-to-rent
- 8.3×
Monthly cashflow live
- Estimated rent
- $1,807 medium interval (Pro) →
- Mortgage (P&I)
- −$943
- Tax from tax record
- −$227 /mo · $2,729/yr
- Insurance
- −$75
- HOA
- −$0
- Vacancy / Maint / Mgmt
- −$379
- Net cashflow
- $182
Break-even live
UW: 25.0% down · 7.5% · 30yr · 1.5% tax · 5.0% vac · 8.0% maint · 8.0% mgmt
Financing live
Cash to close
- Down payment
- $44,975
- Closing costs
- $5,397
- Reserves months
- —
- Total cash needed
- —
Loan-product check · same deal, 3 products live
Conventional
25% down · 7.5% · 30yr
- Down + closing
- —
- Monthly P&I
- —
- Monthly cashflow
- —
- DSCR
- —
- Eligible?
- —
Personal DTI + credit; lowest rate.
DSCR
20% down · 8.5% · 30yr
- Down + closing
- —
- Monthly P&I
- —
- Monthly cashflow
- —
- DSCR
- —
- Eligible?
- —
No personal income docs; deal must DSCR.
Hard money
10% down · 12.0% · 12mo
- Down + closing
- —
- Monthly P&I
- —
- Monthly cashflow
- —
- DSCR
- —
- Eligible?
- —
Short-term bridge; refi at stabilization.
Rent comps 1 comps
| Address | Beds | Baths | Sqft | Rent | $/sqft | DOM | Units | Dist |
|---|---|---|---|---|---|---|---|---|
| 7061 Bethuy Rd Ira Township, MI | 1.0–4.0 | 1.0–2.0 | 1204 | $1,576 | $1.31 | 3d | 1 | 1.38mi |
Listing history 5 events
-
2026-06-13statusdays on market $179,900 Pending 5 DOM
-
2026-06-09days on market $179,900 Active 4 DOM
-
2026-06-08days on market $179,900 Active 3 DOM
-
2026-06-07remarks 699-char remark
-
2026-06-07$179,900 Active 2 DOM
ⓘ Source: listings_history table (triggers on properties + properties_extension) + one-shot
backfill from property_details.listing_events for pre-trigger history.
Tax reassessment forecast MI · Partial reset (capped growth)
- Current annual tax
- $2,729 · $227/mo
- Projected year-2 tax
- $2,750 · $229/mo
- Expected delta
- +$21/yr (+$2/mo · 0.8%)
ⓘ Screening estimate from a state-policy table — verify with the county assessor before closing.
Climate risk First Street
- Flood 1/10 Low FEMA zone X (unshaded) · 0% chance over 30 yrs
- Wildfire 1/10 Low
- Heat 3/10 Moderate 7 d/yr ≥96°F today · 15 d/yr by 30 yrs out
- Wind 1/10 Low
- Air quality 4/10 Moderate 4 unhealthy d/yr today · 6 by 30 yrs out
Nearby sold comps map
Loading sold comps map…
Walkable amenities ~0.75 mi
Loading nearby amenities…
Taxation est. · year 1
- Rental income
- $21,683
- − Mortgage interest
- −$10,077
- − Property taxes
- −$2,729
- − Insurance
- −$900
- − Repairs & maintenance
- −$1,735
- − Management
- −$1,735
- − Depreciation
- −$5,233
- Taxable loss
- −$725
- Est. tax savings @ 24.0%
- +$174
- After-tax cash flow
- $2,355/yr
For passive investors: Depreciation is non-cash, so a rental often shows a tax loss while cash-flowing — sheltering income. Rental losses are passive: they offset passive income freely, and up to $25,000/yr can offset ordinary (W-2) income if you actively participate and your MAGI is under $100k (phasing out to $0 by $150k); unused losses carry forward. On sale, claimed depreciation is recaptured at up to 25%, and gains may owe capital-gains tax (a 1031 exchange can defer both). Figures are a year-1 estimate at your 24.0% rate — not tax advice; consult a CPA.
Schools (NCES district)
- District
- Anchor Bay School District
- NCES district ID
- 2602790
- Math proficiency
- 44% ▼ -12.00%
- Reading proficiency
- 54% ▼ -7.00%
- Median HH income
- $70,173
- Composite
- 43.85/100
- National rank
- #2925
- State rank
- #91 of 540 in MI
Livability — New Baltimore
- Score
- 85/100
- State rank
- #30
- US rank
- #597
Category grades
Schools grade is shown separately in the Schools card above.
Census & demographics
- Census place
- New Baltimore, MI
- County
- Macomb County · 638,552 people
- Metro
- Detroit-Warren-Dearborn, MI
- Population (ZIP)
- 40,302
- Household income
- $94,890
- Rent vs Own
- Severe rent burden
- 529.0
Population outlook (Macomb County) Hauer SSP2
- Today (2025)
- 925,296 people
- By 2030
- 948,226 · +2.5%
- By 2040
- 983,961 · +6.3%
- By 2050
- 1,010,200 · +9.2%
- By 2075
- 1,076,222 · +16.3%
- By 2100
- 1,077,065 · +16.4%
Race, ethnicity, and origin ACS 2023
- Neighborhood character
- Predominantly White (85%)
- Race & ethnicity
- White 85% Two or more races 6% Black 5% Hispanic / Latino 4% Asian 2%
- Common ancestry
- Romanian 16% Lithuanian 6% Slovak 3%
- Foreign-born
- 3% · Canada
- Languages at home
- 96% English-only · Spanish 1% Other Indo-European 1% Russian/Polish/Slavic 1%
Political lean MEDSL · Macomb
- 2024 margin
- R (+13.7) · D 42.2% · R 55.9% · Other 1.9%
- 2008→2024 swing
- -22.3pp toward R · 2008: 8.6pp · 2024: -13.7pp
- All cycles
- 2024: R+13.7 2020: R+8.1 2016: R+11.6 2012: D+4.0 2008: D+8.6
Not yet ingested
- Civics
- —
Market trends
- HPI YoY
- ▼ -265.06%
- Current HPI
- 216.5914
- Rent YoY
- —
- Metro
- Detroit-Warren-Dearborn, MI
- State GDP YoY
- ▲ 1.37%
- F500 in state
- 28
Industry mix (Fortune 500 HQ in MI)
| Industry | F500 HQs | Revenue |
|---|---|---|
| Automotive Parts | 3 | $48B |
|
||
| Automotive | 2 | $372B |
|
||
| Chemicals | 1 | $45B |
|
||
| Automotive Retail | 1 | $29B |
|
||
| Healthcare / Medical Devices | 1 | $23B |
|
||
| Automotive Technology | 1 | $20B |
|
||
Price history
+136.7% since first listed12 events — show timeline
- 2026-06-05 Listed $179,900 MiRealSource-MiMLS
- 2026-06-05 Listed $179,900 REALCOMP
- 2010-03-19 Sold (MLS) $32,000 MiRealSource-MiMLS
- 2010-03-19 Sold (MLS) $32,000 REALCOMP
- 2009-10-27 Listing Removed — MiRealSource-MiMLS
- 2009-10-08 Listed $64,900 MiRealSource-MiMLS
- 2009-10-08 Listed $64,900 REALCOMP
- 2006-02-13 Listing Removed — REALCOMP
- 2006-02-13 Listing Removed — MiRealSource-MiMLS
- 2005-08-28 Listed $149,999 REALCOMP
- 2005-08-25 Listed $149,999 MiRealSource-MiMLS
- 2000-09-08 Sold (Public Records) $76,000 Public Records
Property tax history
+2.2%/yrLatest (2025): $2,729 · +2.8% YoY. Source: county tax records.
Cash-flow waterfall
monthlySold comps — $/sqft
last 12 mo · ≤1 miLoading sold comps…