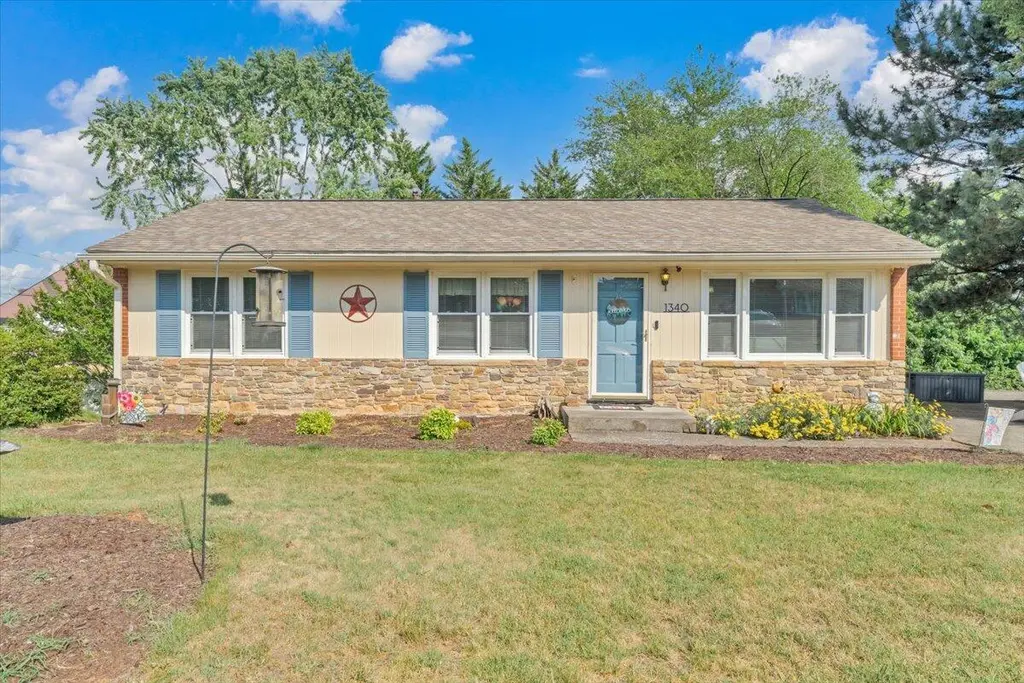
1340 Nover Ave · Hollins, VA
Flood risk 1/10 · Minimal
- FEMA flood zone
- X (unshaded)
- Chance of flooding over 30 yrs
- 0.0%
- Est. flood insurance / yr
- $507 – $1,088
Fire risk 4/10 · Minor
- Est. fire insurance / yr
- $666 – $1,236
Heat risk 5/10 · Moderate
- Hot days now (above 100°F)
- 7 days/yr
- Hot days in 30 yrs
- 19 days/yr
Wind risk 2/10 · Minimal
- Chance of severe wind over 30 yrs
- 1.0%
Air-quality risk 1/10 · Minimal
- Unhealthy air days now
- 0 days/yr
- Unhealthy air days in 30 yrs
- 0 days/yr
Risk factors via First Street. Map © Google.
Why this score? — see what drove the F grade
The composite is a weighted blend of 9 inputs, each scored 0–100. Each bar is that input's sub-score; the figure is the points it added to the 100-point composite (weight × sub-score).
- ARV discount +8.7/15.0
- Cash flow +6.9/30.0
- Schools +6.4/10.0
- Livability +3.8/5.0
- Rent growth +2.5/5.0
- Condition / age +2.5/5.0
- 1% rule +1.1/10.0
- DSCR +1.1/10.0
- Appreciation +0.0/10.0
$250,000
🖨 Deal sheet (PDF) 📄 Offer letter ✓ Due diligence
Listing remarks
Fantastic opportunity to get instant equity with this 3 BD, 1.5 BA ranch in North County. The main level includes living room, large eat-in kitchen, three bedrooms, 1.5 baths along with hardwood floors and replacement windows. The full, walkout basement has a gas-log fireplace, laundry room and provides opportunity for creating additional finished living space. Recent upgrades include new roof in 2018, new HVVAC system in 2022, electrical upgrade, numerous plumbing upgrades and a new garbage disposal in 2025. You'll love the large deck overlooking the mostly level back yard and the wide driveway which easily holds 4 vehicles. Inspections welcome for informational purposes only.
Key facts
- Large deck
- Laundry room
- Gas-log fireplace
Tags
Property features AI
Exterior
- Parking: 3 open parking spaces
- Home design: Residential property; Built in 1964
- Construction: 9,583.2 sq ft lot (approximately 0.22 acres)
- Exterior features: Off-street parking
Interior
- Bedrooms: 3 bedrooms (all on the main level)
- Flooring: Concrete flooring; Vinyl flooring; Wood flooring
- Bathrooms: 1 full bathroom; 1 half bathroom
- Heating & cooling: Forced air gas heating; Home has cooling
- Interior features: Storage; Wood doors; Insulated, tilt-in windows
Neighborhood map
What this means for you Summary
Snapshot
- This is a 3-bed/1.5-bath single-family listed at $250k.
Deal economics
- At list price, monthly cash flow is $-378 ($-5k/yr) — negative.
- To cash-flow at today's rent, offer at most $183k (26.7% below list).
- To meet the 1% rule (rent ≥ 1% of price), the offer needs to be $153k (38.8% below list).
- Recommended offer: $153k (38.8% below list) — sets the bar for 1% rule.
Location & tenants
- Location reads 75/100 on livability (#126 in VA, #4,055 nationally) — a middle-class / working-renter tenant base. Strengths: cost of living A+, housing A+, health & safety A+; Watch: amenities F, commute F.
- Roanoke County Public School District (suburban): math 71% / reading 78% proficiency, ranked #9 of 131 in VA (top 7%) — strong family-tenant draw, lease renewals of 3-5y typical.
- Zoned schools: Burlington Elementary (math 47% / reading 62%, grade C, #650 of 1,108 statewide, top 62%, 483 students, 78% FRL); Northside Middle (math 63% / reading 68%, grade A-, #116 of 342 statewide, top 35%, 627 students, 53% FRL); Northside High (math 80% / reading 87%, grade A, #30 of 319 statewide, top 10%, 950 students, 47% FRL) — zoned schools average 60% FRL vs 22% district-wide (38 pts higher); higher-poverty schools than district average — tighter screening recommended.
- Market conditions: 180 active listings in the ZIP; 5 comparable units currently listed for rent nearby; rentals at typical pace (median 15d on market — plan ~3-4 weeks tenant-placement turnaround); solid renter incomes; 360 units permitted in Roanoke County in 2024 (228 in 5+ unit buildings).
Forward outlook
- Local home prices are declining (-3.0%/yr); year-one equity from $2k of loan paydown is wiped out by about $8k of value loss. Plan a longer hold.
- Roanoke County population projected at +5% by 2050 — modest demand growth; plan on rents tracking national, not racing it.
Negotiation context
- Only 8 days on market — expect competitive offers; lowballing is unlikely to land.
- Current owner paid $59k; list at $250k implies a 324% gain — meaningful room to come down on a strong offer.
Risks & watch-outs
- Climate carrying-cost: extreme-heat days projected 7→19/yr by 2055 (HVAC capex compounding) — expect insurance premiums to compound above CPI over the hold.
Questions for the listing agent
- What do current leases actually rent for vs. the listed asking? Can we see a recent rent roll and the last 12 months of T-12 income?
- Built in 1964 — when were the roof, HVAC, electrical panel, plumbing, and water heater last replaced?
- Is there a deadline driving the sale (1031 exchange, divorce, estate, relocation)? That informs how much negotiation room exists.
- The area grade is low — what's the realistic commute time and amenity access for the typical tenant pool here? Any planned neighborhood developments (good or bad) we should know about?
- What's the average days-on-market for RENTAL listings here right now (not sales)? A rising rental-DOM trend means longer vacancies and softer asking-rent achievability than the comps imply.
- What's the recent tenant-quality profile in this submarket — average credit score on applications, eviction rate, late-payment / NSF rate, and stable-employment percentage? A property-management company in the area should have these aggregated.
- How much new for-sale + rental construction is in the pipeline within 1–3 miles? Heavy new supply typically softens prices + rents 12–24 months out; constrained supply supports both.
Investment metrics
- 1% rule
- 0.61% ✗
- Cap rate
- 4.48%
- Cash-on-cash
- -6.49%
- DSCR
- 0.71
- GRM
- 13.6
CMA / ARV
- ARV (on-the-fly)
- $256,620
- Comps found
- 3
Show comp detail 3 sales within ~0.75 mi
| Address | Dist | Beds/Ba | Sqft | Sold | Price | $/sf | Match |
|---|---|---|---|---|---|---|---|
| 1150 Starmount Ave | 0.31mi | 3/1.0 | 1,100 (+1%) | 2mo | $300,000 | $273 | 81 |
| 7206 Red Cedar Cir | 0.50mi | 2/1.5 (-1) | 1,087 (-0%) | 1mo | $209,950 | $193 | 70 |
| 6854 Autumn Wood Ln | 0.52mi | 3/2.0 | 1,050 (-4%) | 8mo | $247,000 | $235 | 61 |
Match score weights: distance 35% · size 25% · config 20% · recency 20%. Top-matched comps best support the ARV.
Projected returns pro-forma
-3.0% appreciation · 3.0% rent growth · sell at horizon
- IRR
- -27.5%
- Equity multiple
- 0.08×
- Total profit
- $-64,675
- Equity at exit
- $37,276
- IRR
- -26.0%
- Equity multiple
- -0.25×
- Total profit
- $-87,607
- Equity at exit
- $21,615
Cash invested: $70,000 (down + closing). Projections, not guarantees.
Landlord ↔ Tenant lean methodology
- Overall (STATE)
- 55 Moderately Landlord-Leaning
- State Virginia
- 55 Moderately Landlord-Leaning · D+2
- County
- — inherits STATE
- City
- — inherits STATE
ZIP-level market 24019
- Active inventory
- 180
- Price-to-rent
- 13.6×
Monthly cashflow live
- Estimated rent
- $1,531 high interval (Pro) →
- Mortgage (P&I)
- −$1,311
- Tax from tax record
- −$173 /mo · $2,074/yr
- Insurance
- −$104
- HOA
- −$0
- Vacancy / Maint / Mgmt
- −$322
- Net cashflow
- $-378
Break-even live
Sensitivity live
| Price | -10% $-237 | -5% $-308 | +0% $-378 | +5% $-449 | +10% $-520 |
|---|---|---|---|---|---|
| Rent | -10% $-499 | -5% $-439 | +0% $-378 | +5% $-318 | +10% $-257 |
| Rate | -1.0pp $-253 | -0.5pp $-315 | base $-378 | +0.5pp $-443 | +1.0pp $-509 |
UW: 25.0% down · 7.5% · 30yr · 1.5% tax · 5.0% vac · 8.0% maint · 8.0% mgmt
Financing live
Cash to close
- Down payment
- $62,500
- Closing costs
- $7,500
- Reserves months
- —
- Total cash needed
- —
Loan-product check · same deal, 3 products live
Conventional
25% down · 7.5% · 30yr
- Down + closing
- —
- Monthly P&I
- —
- Monthly cashflow
- —
- DSCR
- —
- Eligible?
- —
Personal DTI + credit; lowest rate.
DSCR
20% down · 8.5% · 30yr
- Down + closing
- —
- Monthly P&I
- —
- Monthly cashflow
- —
- DSCR
- —
- Eligible?
- —
No personal income docs; deal must DSCR.
Hard money
10% down · 12.0% · 12mo
- Down + closing
- —
- Monthly P&I
- —
- Monthly cashflow
- —
- DSCR
- —
- Eligible?
- —
Short-term bridge; refi at stabilization.
Rent comps 5 comps
| Address | Beds | Baths | Sqft | Rent | $/sqft | DOM | Units | Dist |
|---|---|---|---|---|---|---|---|---|
| 6441 Archcrest Dr Hollins, VA | 1.0–2.0 | 1.0–2.0 | 932 | $1,549 | $1.66 | 15d | 8 | 0.07mi |
| 713 Lakeview Cir Roanoke, VA | 2.0 | 1.0 | 854 | $1,425 | $1.67 | 15d | 1 | 0.40mi |
| 7114 South Dr Roanoke, VA | 3.0 | 1.0 | 1060 | $1,750 | $1.65 | 23d | 1 | 0.44mi |
| 6500 Carefree Ln Apt 13 Hollins, VA | 2.0 | 1.0 | 1100 | $1,125 | $1.02 | 15d | 1 | 0.45mi |
| 6525 Greenway Dr Roanoke, VA | 1.0–3.0 | 1.0–1.5 | 1071 | $1,875 | $1.75 | 15d | 14 | 1.13mi |
Listing history 7 events
-
2026-06-22days on market $250,000 Active 8 DOM
-
2026-06-18days on market $250,000 Active 5 DOM
-
2026-06-17days on market $250,000 Active 4 DOM
-
2026-06-16days on market $250,000 Active 3 DOM
-
2026-06-15days on market $250,000 Active 2 DOM
-
2026-06-14remarks 686-char remark
-
2026-06-14$250,000 Active 1 DOM
ⓘ Source: listings_history table (triggers on properties + properties_extension) + one-shot
backfill from property_details.listing_events for pre-trigger history.
Tax reassessment forecast VA · Resets to sale price
- Current annual tax
- $2,074 · $173/mo
- Projected year-2 tax
- $2,074 · $173/mo
- Expected delta
- $0/yr ($0/mo · 0.0%)
ⓘ Screening estimate from a state-policy table — verify with the county assessor before closing.
Climate risk First Street
- Flood 1/10 Low FEMA zone X (unshaded) · 0% chance over 30 yrs
- Wildfire 4/10 Moderate
- Heat 5/10 Major 7 d/yr ≥100°F today · 19 d/yr by 30 yrs out
- Wind 2/10 Low 100% chance of damaging wind over 30 yrs
- Air quality 1/10 Low 0 unhealthy d/yr today · 0 by 30 yrs out
Nearby sold comps map
Loading sold comps map…
Walkable amenities ~0.75 mi
Loading nearby amenities…
Taxation est. · year 1
- Rental income
- $18,374
- − Mortgage interest
- −$14,004
- − Property taxes
- −$2,074
- − Insurance
- −$1,250
- − Repairs & maintenance
- −$1,470
- − Management
- −$1,470
- − Depreciation
- −$7,273
- Taxable loss
- −$9,167
- Est. tax savings @ 24.0%
- +$2,200
- After-tax cash flow
- $-2,341/yr
For passive investors: Depreciation is non-cash, so a rental often shows a tax loss while cash-flowing — sheltering income. Rental losses are passive: they offset passive income freely, and up to $25,000/yr can offset ordinary (W-2) income if you actively participate and your MAGI is under $100k (phasing out to $0 by $150k); unused losses carry forward. On sale, claimed depreciation is recaptured at up to 25%, and gains may owe capital-gains tax (a 1031 exchange can defer both). Figures are a year-1 estimate at your 24.0% rate — not tax advice; consult a CPA.
Schools (NCES district)
- District
- Roanoke County Public School District
- NCES district ID
- 5103330
- Math proficiency
- 71% ▼ -19.00%
- Reading proficiency
- 78% ▼ -6.00%
- Median HH income
- $60,526
- Composite
- 64.08/100
- National rank
- #578
- State rank
- #9 of 131 in VA
Livability — Hollins
- Score
- 75/100
- State rank
- #126
- US rank
- #4055
Category grades
Schools grade is shown separately in the Schools card above.
Census & demographics
- Census place
- Hollins, VA
- County
- Roanoke County · 67,305 people
- City population
- 29,212
- Metro
- Roanoke, VA
- Population (ZIP)
- 28,585
- Household income
- $77,870
- Rent vs Own
- Severe rent burden
- 512.0
Population outlook (Roanoke County) Hauer SSP2
- Today (2025)
- 98,162 people
- By 2030
- 99,793 · +1.7%
- By 2040
- 101,965 · +3.9%
- By 2050
- 103,328 · +5.3%
- By 2075
- 108,641 · +10.7%
- By 2100
- 104,845 · +6.8%
Race, ethnicity, and origin ACS 2023
- Neighborhood character
- Predominantly White (76%)
- Race & ethnicity
- White 76% Black 13% Two or more races 4% Hispanic / Latino 4% Asian 3%
- Common ancestry
- Serbian 2% Slovak 2% Romanian 1%
- Foreign-born
- 7% · Canada, Vietnam, China
- Languages at home
- 93% English-only · Spanish 3% Other Indo-European 1% Other Asian/Pacific 1%
Political lean MEDSL · Roanoke
- 2024 margin
- Strong R (+22.5) · D 38.2% · R 60.7% · Other 1.1%
- 2008→2024 swing
- -1.4pp toward R · 2008: -21.1pp · 2024: -22.5pp
- All cycles
- 2024: R+22.5 2020: R+21.8 2016: R+28.1 2012: R+25.6 2008: R+21.1
Not yet ingested
- Civics
- —
Market trends
- HPI YoY
- ▼ -236.33%
- Current HPI
- 179.1326
- Rent YoY
- —
- Metro
- Roanoke, VA
- State GDP YoY
- ▲ 2.40%
- F500 in state
- 50
Industry mix (Fortune 500 HQ in VA)
| Industry | F500 HQs | Revenue |
|---|---|---|
| Aerospace / Defense | 4 | $236B |
|
||
| Technology / Defense | 3 | $32B |
|
||
| Financial Services | 2 | $176B |
|
||
| Utilities | 2 | $27B |
|
||
| Insurance | 2 | $25B |
|
||
| Technology | 2 | $15B |
|
||
Price history
+363.0% since first listed3 events — show timeline
- 2026-06-08 Listed $250,000 MLSRV
- 1991-01-01 Sold (Public Records) $59,000 Public Records
- 1985-11-01 Sold (Public Records) $54,000 Public Records
Property tax history
+3.6%/yrLatest (2025): $2,074 · +8.6% YoY. Source: county tax records.
Cash-flow waterfall
monthlySold comps — $/sqft
last 12 mo · ≤1 miLoading sold comps…