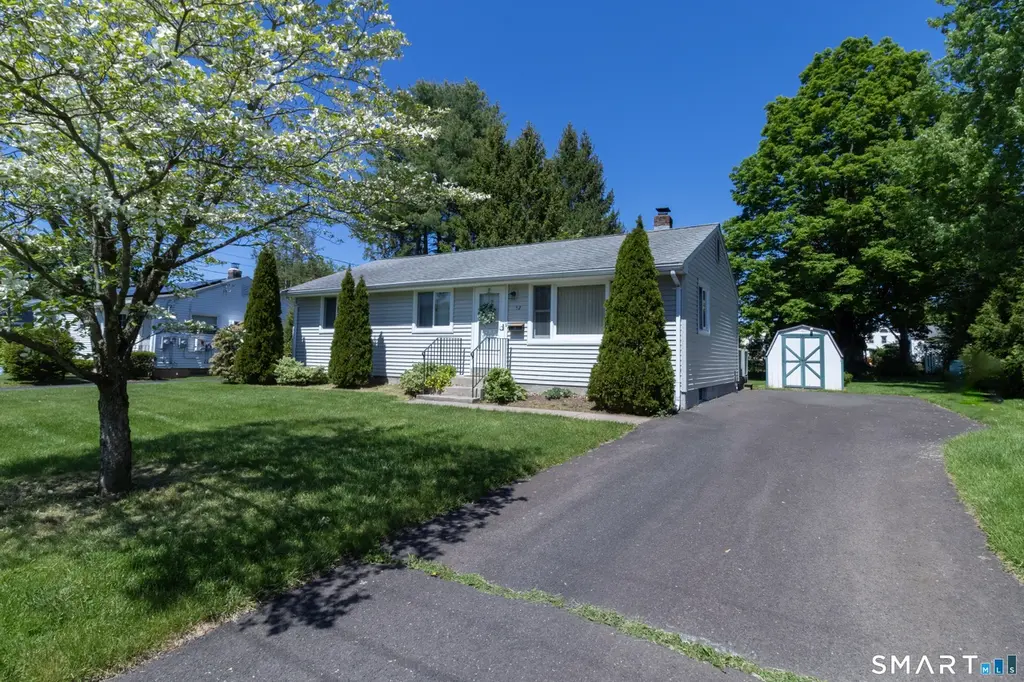
52 Overhill Dr · Kensington, CT
Flood risk 1/10 · Minimal
- FEMA flood zone
- X (unshaded)
- Chance of flooding over 30 yrs
- 0.0%
- Est. flood insurance / yr
- $473 – $860
Fire risk 1/10 · Minimal
- Est. fire insurance / yr
- $829 – $1,539
Heat risk 5/10 · Moderate
- Hot days now (above 98°F)
- 7 days/yr
- Hot days in 30 yrs
- 15 days/yr
Wind risk 6/10 · Moderate
- Chance of severe wind over 30 yrs
- 27.0%
Air-quality risk 3/10 · Minor
- Unhealthy air days now
- 3 days/yr
- Unhealthy air days in 30 yrs
- 4 days/yr
Risk factors via First Street. Map © Google.
Why this score? — see what drove the D grade
The composite is a weighted blend of 9 inputs, each scored 0–100. Each bar is that input's sub-score; the figure is the points it added to the 100-point composite (weight × sub-score).
- Cash flow +11.0/30.0
- ARV discount +10.1/15.0
- Schools +4.8/10.0
- Livability +4.0/5.0
- DSCR +3.2/10.0
- 1% rule +3.1/10.0
- Rent growth +2.5/5.0
- Condition / age +2.5/5.0
- Appreciation +0.0/10.0
$325,000
🖨 Deal sheet 📄 Offer letter ✓ Due diligence
Listing remarks
Welcome to 52 Overhill Drive! This cozy three bedroom, one bath ranch is situated on a level, treed lot located in Kensington and within walking distance to the high school. The living room and bedrooms have hardwood floors and some of those rooms currently have wall to wall carpet over the wood. The roof, siding and windows have been updated. Central air has been another improvement installed in 2019. The large deck off of the kitchen adds to the enjoyment of this private yard. Conveniently positioned at the end of the driveway is a shed ideal for storage of lawnmowers or summer furniture. The full basement has a portion of it partially finished and the balance of the space has a laundry a
Key facts
- 0.23 acre lot
- 3 parking spots
- Built 1954
Property features AI
Finance
- Other: Nearby amenities: golf course, health club, library, medical facilities, park, playground/tot lot, public pool, shopping/mall
Exterior
- Parking: Private paved driveway; Off-street paved parking; 3 total parking spaces
- Utilities: Public water connected; Public sewer connected; Oil hot water with fuel tank in basement; Thermopane windows; Storm doors and storm windows
- Home design: Single-family home; Frame construction; Gray exterior siding
- Construction: Asphalt shingle roof; Vinyl siding; Concrete foundation
- Exterior features: Deck; Shed; Gutters; Outdoor lighting; Lightly wooded, level lot
Interior
- Kitchen: Oven/Range; Microwave; Refrigerator
- Bedrooms: 3 bedrooms
- Bathrooms: 1 full bathroom
- Heating & cooling: Hot water heating (oil-fired); Programmable thermostat
- Interior features: Cable available; Basement partially finished with storage and concrete floor; Attic with hatch access
- Laundry & utility: Laundry in basement (lower level)
Neighborhood map
What this means for you Summary
Snapshot
- This is a 3-bed/1.0-bath single-family listed at $325k.
Deal economics
- At list price, monthly cash flow is $-138 ($-2k/yr) — negative.
- To cash-flow at today's rent, offer at most $301k (7.5% below list).
- To meet the 1% rule (rent ≥ 1% of price), the offer needs to be $263k (19.2% below list).
- Recommended offer: $263k (19.2% below list) — sets the bar for 1% rule.
Location & tenants
- Location reads 81/100 on livability (#20 in CT, #1,490 nationally) — a professional / high-income tenant draw. Strengths: crime A+, employment A+, housing A+; Watch: cost of living C-, amenities D-, commute F.
- Berlin School District (suburban): math 47% / reading 58% proficiency, ranked #69 of 153 in CT (top 45%) — acceptable for families but not a draw, mixed tenant base, ~2y average lease; only 10% free/reduced lunch — higher-income household profile.
- Zoned schools: Berlin High School (math 38% / reading 69%, grade C-, #78 of 194 statewide, top 40%, 858 students, 18% FRL).
- Market conditions: 63 active listings in the ZIP; 2 comparable units currently listed for rent nearby; high-income renter base; 1,867 units permitted in Capitol Planning Region in 2024 (1,399 in 5+ unit buildings).
Forward outlook
- Local home prices are declining (-3.0%/yr); year-one equity from $2k of loan paydown is wiped out by about $10k of value loss. Plan a longer hold.
Negotiation context
- Only 6 days on market — expect competitive offers; lowballing is unlikely to land.
Risks & watch-outs
- Watch-outs: built in 1954 — expect roof / HVAC / electrical / plumbing capex.
- Climate carrying-cost: major wind risk, 27% chance of damaging wind over 30y; extreme-heat days projected 7→15/yr by 2055 (HVAC capex compounding) — expect insurance premiums to compound above CPI over the hold.
Questions for the listing agent
- What do current leases actually rent for vs. the listed asking? Can we see a recent rent roll and the last 12 months of T-12 income?
- Built in 1954 — when were the roof, HVAC, electrical panel, plumbing, and water heater last replaced?
- Is there a deadline driving the sale (1031 exchange, divorce, estate, relocation)? That informs how much negotiation room exists.
- Schools are B-rated — typically a magnet for longer-tenancy family renters. What's the average tenant stay here, and is there a school-zone premium baked into asking?
- The area grade is low — what's the realistic commute time and amenity access for the typical tenant pool here? Any planned neighborhood developments (good or bad) we should know about?
- What's the average days-on-market for RENTAL listings here right now (not sales)? A rising rental-DOM trend means longer vacancies and softer asking-rent achievability than the comps imply.
- What's the recent tenant-quality profile in this submarket — average credit score on applications, eviction rate, late-payment / NSF rate, and stable-employment percentage? A property-management company in the area should have these aggregated.
- How much new for-sale + rental construction is in the pipeline within 1–3 miles? Heavy new supply typically softens prices + rents 12–24 months out; constrained supply supports both.
Investment metrics
- 1% rule
- 0.81% ✗
- Cap rate
- 5.78%
- Cash-on-cash
- -1.81%
- DSCR
- 0.92
- GRM
- 10.3
CMA / ARV
- ARV (median comp)
- $344,865
- List price
- $325,000
- Delta
- -5.76%
- Verdict
- FAIR
- Comps
- 20 within 1.0 mi
Show comp detail 5 sales within ~0.75 mi
| Address | Dist | Beds/Ba | Sqft | Sold | Price | $/sf | Match |
|---|---|---|---|---|---|---|---|
| 156 Overhill Dr | 0.10mi | 3/1.0 | 960 (0%) | 10mo | $289,900 | $302 | 87 |
| 80 Skinner Rd | 0.67mi | 3/1.0 | 960 (0%) | 13mo | $355,000 | $370 | 58 |
| 17 David Dr | 0.63mi | 3/1.0 | 1,008 (+5%) | 23mo | $326,000 | $323 | 43 |
| 51 Skinner Rd | 0.63mi | 3/1.0 | 1,008 (+5%) | 23mo | $310,000 | $308 | 43 |
| 280 Fairview Dr | 0.58mi | 3/1.0 | 816 (-15%) | 10mo | $295,000 | $362 | 39 |
Match score weights: distance 35% · size 25% · config 20% · recency 20%. Top-matched comps best support the ARV.
Projected returns pro-forma
-3.0% appreciation · 3.0% rent growth · sell at horizon
- IRR
- -19.3%
- Equity multiple
- 0.33×
- Total profit
- $-61,407
- Equity at exit
- $48,459
- IRR
- -12.0%
- Equity multiple
- 0.29×
- Total profit
- $-64,680
- Equity at exit
- $28,100
Cash invested: $91,000 (down + closing). Projections, not guarantees.
Landlord ↔ Tenant lean methodology
- Overall (STATE)
- 27 Tenant-Leaning
- State Connecticut
- 27 Tenant-Leaning · D+7
- County
- — inherits STATE
- City
- — inherits STATE
ZIP-level market 06037
- Home prices YoY
- -32.9%
- Active inventory
- 63
- Price-to-rent
- 10.3×
Monthly cashflow live
- Estimated rent
- $2,625 medium interval (Pro) →
- Mortgage (P&I)
- −$1,704
- Tax from tax record
- −$372 /mo · $4,463/yr
- Insurance
- −$135
- HOA
- −$0
- Vacancy / Maint / Mgmt
- −$551
- Net cashflow
- $-138
Break-even live
UW: 25.0% down · 7.5% · 30yr · 1.5% tax · 5.0% vac · 8.0% maint · 8.0% mgmt
Financing live
Cash to close
- Down payment
- $81,250
- Closing costs
- $9,750
- Reserves months
- —
- Total cash needed
- —
Loan-product check · same deal, 3 products live
Conventional
25% down · 7.5% · 30yr
- Down + closing
- —
- Monthly P&I
- —
- Monthly cashflow
- —
- DSCR
- —
- Eligible?
- —
Personal DTI + credit; lowest rate.
DSCR
20% down · 8.5% · 30yr
- Down + closing
- —
- Monthly P&I
- —
- Monthly cashflow
- —
- DSCR
- —
- Eligible?
- —
No personal income docs; deal must DSCR.
Hard money
10% down · 12.0% · 12mo
- Down + closing
- —
- Monthly P&I
- —
- Monthly cashflow
- —
- DSCR
- —
- Eligible?
- —
Short-term bridge; refi at stabilization.
Rent comps 2 comps
| Address | Beds | Baths | Sqft | Rent | $/sqft | DOM | Units | Dist |
|---|---|---|---|---|---|---|---|---|
| 883 Worthington Rdg Unit 2nd Floor Kensington, CT | 2.0 | 1.0 | 800 | $2,200 | $2.75 | 43d | 1 | 0.42mi |
| 1044 Farmington Ave Berlin, CT | 2.0 | 1.0 | 978 | $2,150 | $2.20 | 43d | 1 | 0.68mi |
Listing history 2 events
-
2026-05-16$325,000 Active 1113-char remark
-
2026-05-15historical $325,000 1113-char remark
ⓘ Source: listings_history table (triggers on properties + properties_extension) + one-shot
backfill from property_details.listing_events for pre-trigger history.
Tax reassessment forecast CT · Partial reset (capped growth)
- Current annual tax
- $4,463 · $372/mo
- Projected year-2 tax
- $5,709 · $476/mo
- Expected delta
- +$1,246/yr (+$104/mo · 27.9%)
ⓘ Screening estimate from a state-policy table — verify with the county assessor before closing.
Climate risk First Street
- Flood 1/10 Low FEMA zone X (unshaded) · 0% chance over 30 yrs
- Wildfire 1/10 Low
- Heat 5/10 Major 7 d/yr ≥98°F today · 15 d/yr by 30 yrs out
- Wind 6/10 Major 27% chance of damaging wind over 30 yrs
- Air quality 3/10 Moderate 3 unhealthy d/yr today · 4 by 30 yrs out
Nearby sold comps map
Loading sold comps map…
Walkable amenities ~0.75 mi
Loading nearby amenities…
Taxation est. · year 1
- Rental income
- $31,505
- − Mortgage interest
- −$18,205
- − Property taxes
- −$4,463
- − Insurance
- −$1,625
- − Repairs & maintenance
- −$2,520
- − Management
- −$2,520
- − Depreciation
- −$9,455
- Taxable loss
- −$7,283
- Est. tax savings @ 24.0%
- +$1,748
- After-tax cash flow
- $97/yr
For passive investors: Depreciation is non-cash, so a rental often shows a tax loss while cash-flowing — sheltering income. Rental losses are passive: they offset passive income freely, and up to $25,000/yr can offset ordinary (W-2) income if you actively participate and your MAGI is under $100k (phasing out to $0 by $150k); unused losses carry forward. On sale, claimed depreciation is recaptured at up to 25%, and gains may owe capital-gains tax (a 1031 exchange can defer both). Figures are a year-1 estimate at your 24.0% rate — not tax advice; consult a CPA.
Schools (NCES district)
- District
- Berlin School District
- NCES district ID
- 0900210
- Math proficiency
- 47% ▼ -12.00%
- Reading proficiency
- 58% ▼ -8.00%
- Median HH income
- $87,497
- Composite
- 48.4/100
- National rank
- #2136
- State rank
- #69 of 153 in CT
Livability — Kensington
- Score
- 81/100
- State rank
- #20
- US rank
- #1490
Category grades
Schools grade is shown separately in the Schools card above.
Census & demographics
- Census place
- Kensington, CT
- County
- Hartford County · 754,208 people
- Metro
- Hartford-East Hartford-Middletown, CT
- Population (ZIP)
- 19,173
- Household income
- $116,042
- Rent vs Own
- Severe rent burden
- 294.0
Population outlook (Capitol County) Hauer SSP2
- By 2040
- 1,063,519
Race, ethnicity, and origin ACS 2023
- Neighborhood character
- Predominantly White (86%)
- Race & ethnicity
- White 86% Hispanic / Latino 7% Two or more races 5% Asian 5%
- Hispanic origin (detail)
- Puerto Rican 2% Cuban 2%
- Common ancestry
- Romanian 23% Lithuanian 8% Danish 2%
- Foreign-born
- 10% · Canada, China
- Languages at home
- 85% English-only · Russian/Polish/Slavic 6% Spanish 3% Other Indo-European 2%
Political lean MEDSL · Capitol
- 2024 margin
- Strong D (+21.9) · D 60.1% · R 38.2% · Other 1.7%
- All cycles
- 2024: D+21.9
Not yet ingested
- Civics
- —
Market trends
- HPI YoY
- ▼ -145.47%
- Current HPI
- 296.2808
- Rent YoY
- —
- Metro
- Hartford-East Hartford-Middletown, CT
- State GDP YoY
- ▲ 1.06%
- F500 in state
- 38
Industry mix (Fortune 500 HQ in CT)
| Industry | F500 HQs | Revenue |
|---|---|---|
| Industrial Machinery | 4 | $38B |
|
||
| Insurance | 3 | $71B |
|
||
| Financial Services | 2 | $25B |
|
||
| Transportation / Logistics | 2 | $18B |
|
||
| Healthcare | 1 | $247B |
|
||
| Telecommunications | 1 | $55B |
|
||
Price history
+0.0% since first listed3 events — show timeline
- 2026-05-21 Pending — Smart MLS
- 2026-05-16 Listed $325,000 Smart MLS
- 2026-05-15 Coming Soon $325,000 Smart MLS
Property tax history
+2.2%/yrLatest (2025): $4,463 · +1.5% YoY. Source: county tax records.
Cash-flow waterfall
monthlySold comps — $/sqft
last 12 mo · ≤1 miLoading sold comps…