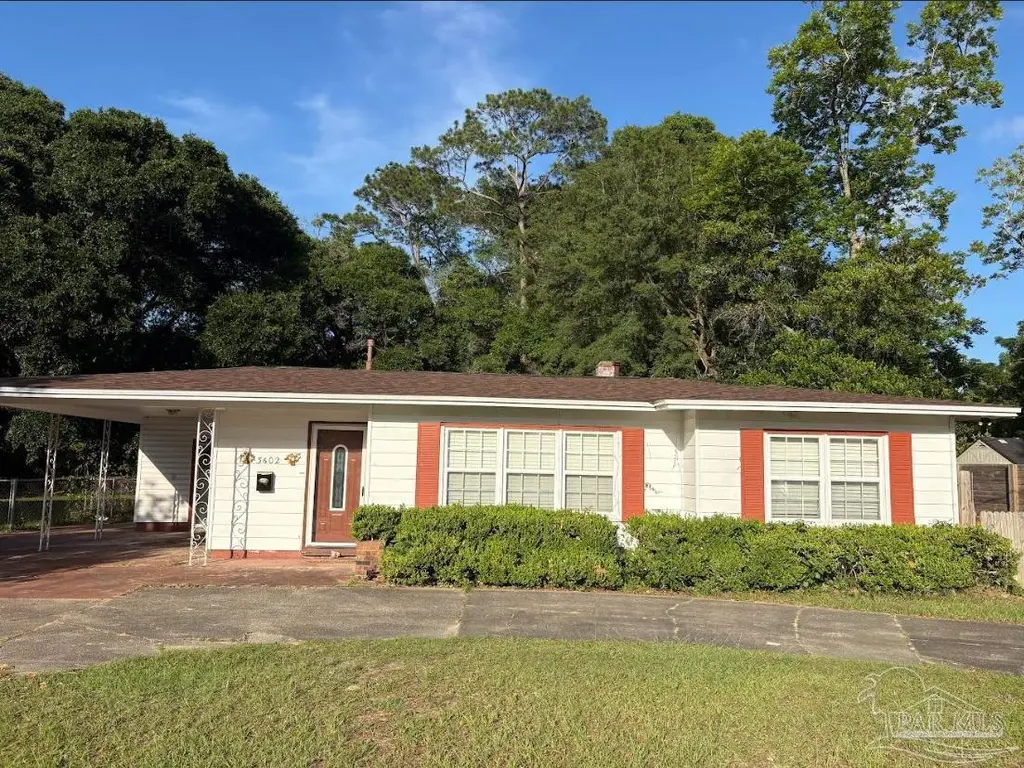
3602 N 9th Ave · Pensacola, FL
Flood risk 4/10 · Minor
- FEMA flood zone
- X (unshaded)
- Chance of flooding over 30 yrs
- 0.2%
- Est. flood insurance / yr
- $507 – $1,088
Fire risk 1/10 · Minimal
- Est. fire insurance / yr
- $947 – $1,759
Heat risk 10/10 · Severe
- Hot days now (above 105°F)
- 7 days/yr
- Hot days in 30 yrs
- 22 days/yr
Wind risk 9/10 · Severe
- Chance of severe wind over 30 yrs
- 99.0%
Air-quality risk 2/10 · Minimal
- Unhealthy air days now
- 0 days/yr
- Unhealthy air days in 30 yrs
- 1 days/yr
Risk factors via First Street. Map © Google.
Why this score? — see what drove the B grade
The composite is a weighted blend of 9 inputs, each scored 0–100. Each bar is that input's sub-score; the figure is the points it added to the 100-point composite (weight × sub-score).
- Cash flow +26.4/30.0
- ARV discount +15.0/15.0
- DSCR +9.0/10.0
- 1% rule +6.6/10.0
- Livability +4.2/5.0
- Schools +3.6/10.0
- Rent growth +3.3/5.0
- Condition / age +2.5/5.0
- Appreciation +0.0/10.0
$179,900
🖨 Deal sheet 📄 Offer letter ✓ Due diligence
Listing remarks
Motivated seller! Conveniently located near shopping, dining, medical facilities, downtown Pensacola, and just a short drive to Pensacola’s renowned beaches, this property presents a compelling opportunity for owner-occupants, investors, or buyers seeking flexible space and additional utility. This well-maintained 3-bedroom, 2-bath home offers a functional layout with spacious living areas, a generously sized kitchen with stainless steel appliances and gas cooking, updated bath finishes, durable flooring throughout much of the home, and a large bonus/flex room ideal for entertaining, recreation, a home office, or additional living use. The property also includes detached accessory/sto
Key facts
- Gas cooking
- 9,147 sq ft lot
- Parking
Tags
Property features AI
Finance
- Other: Lot size approximately 0.21 acres; Building area approximately 1,310 square feet
- HOA & community: No homeowners association
Exterior
- Parking: Carport; Driveway; One covered parking space (one total parking space)
- Utilities: Public sewer; Circuit breaker electrical service
- Home design: Single-story frame home; Slab foundation; Resale property; Not attached to other units; Homestead exempt
- Construction: Frame construction; Built on a slab; One level
- Exterior features: Shingle roof; Paved public road access; Public water
Interior
- Kitchen: Electric water heater
- Flooring: Tile
- Bathrooms: Two full bathrooms
- Heating & cooling: Central heating; Central air; Ceiling fans
- Interior features: Tile flooring; Remodeled bathrooms; Kitchen and dining combined; Kitchen not updated
Neighborhood map
What this means for you Summary
Snapshot
- This is a 3-bed/1.0-bath single-family listed at $180k.
Deal economics
- At list price, monthly cash flow is $473 ($6k/yr) — positive.
- The deal already cash-flows at list — no discount required.
- Meets the 1% rule at list price ($2k rent vs $180k).
- Recommended offer: $177k (1.5% below list) — sets the bar for market timing.
- Cap rate 9.4% vs local median 3.6% in Pensacola — top-decile yield for the area; either an underpriced asset or a hidden risk that comps aren't pricing in. Stress-test before assuming the spread holds.
Location & tenants
- Location reads 83/100 on livability (#53 in FL, #924 nationally) — a professional / high-income tenant draw. Strengths: commute A+, cost of living A+, housing A+.
- Escambia (suburban): math 40% / reading 45% proficiency, ranked #56 of 73 in FL (top 77%) — families likely to look elsewhere, expect single-tenant / working-renter base with shorter leases.
- Market conditions: Rents rising (+3.4%/yr); 240 active listings in the ZIP; 11 comparable units currently listed for rent nearby; rentals at typical pace (median 24d on market — plan ~3-4 weeks tenant-placement turnaround); 1,479 units permitted in Escambia County in 2024 (0 in 5+ unit buildings).
- This rent runs 35% of the median local income ($71k/yr) — at the standard rent-burdened threshold; future hikes will face affordability resistance.
Forward outlook
- Local home prices are declining (-3.0%/yr); year-one equity from $1k of loan paydown is wiped out by about $5k of value loss. Plan a longer hold.
- Escambia County population projected at +13% by 2050 — modest demand growth; plan on rents tracking national, not racing it.
- At projected returns (-3.0% appreciation + 3.4% rent growth), your $50k cash investment doubles in ~10 years — after that, you're playing with house money.
Negotiation context
- It's been on market 20 days — a 2% lower offer ($177k) is reasonable based on typical stale-listing flexibility.
- Current owner paid $135k; 33% above their basis — modest negotiation headroom, anchor on the comps not their cost.
Risks & watch-outs
- Watch-outs: built in 1950 — expect roof / HVAC / electrical / plumbing capex.
- Climate carrying-cost: severe wind risk, 99% chance of damaging wind over 30y; extreme-heat days projected 7→22/yr by 2055 (HVAC capex compounding) — expect insurance premiums to compound above CPI over the hold.
Questions for the listing agent
- Built in 1950 — when were the roof, HVAC, electrical panel, plumbing, and water heater last replaced?
- Is there a deadline driving the sale (1031 exchange, divorce, estate, relocation)? That informs how much negotiation room exists.
- What's the average days-on-market for RENTAL listings here right now (not sales)? A rising rental-DOM trend means longer vacancies and softer asking-rent achievability than the comps imply.
- What's the recent tenant-quality profile in this submarket — average credit score on applications, eviction rate, late-payment / NSF rate, and stable-employment percentage? A property-management company in the area should have these aggregated.
- How much new for-sale + rental construction is in the pipeline within 1–3 miles? Heavy new supply typically softens prices + rents 12–24 months out; constrained supply supports both.
Investment metrics
- 1% rule
- 1.16% ✓
- Cap rate
- 9.45%
- Cash-on-cash
- 11.27%
- DSCR
- 1.50
- GRM
- 7.2
CMA / ARV
- ARV (on-the-fly)
- $253,632
- Comps found
- 12
Show comp detail 12 sales within ~0.75 mi
| Address | Dist | Beds/Ba | Sqft | Sold | Price | $/sf | Match |
|---|---|---|---|---|---|---|---|
| 3151 Torres Ave | 0.15mi | 3/1.0 | 1,234 (-7%) | 6mo | $48,000 | $39 | 78 |
| 25 Escalona Ave | 0.19mi | 3/2.0 | 1,406 (+6%) | 6mo | $270,000 | $192 | 72 |
| 3003 Torres Ave | 0.26mi | 3/1.0 | 1,440 (+9%) | 3mo | $123,000 | $85 | 71 |
| 1007 E Hayes St | 0.29mi | 3/2.0 | 1,247 (-6%) | 3mo | $210,000 | $168 | 71 |
| 211 E Anderson St | 0.52mi | 3/2.0 | 1,286 (-3%) | 3mo | $249,000 | $194 | 65 |
| 609 E Fisher | 0.47mi | 3/2.0 | 1,400 (+6%) | 1mo | $295,000 | $211 | 64 |
| 2911 N Miller St | 0.64mi | 3/2.0 | 1,345 (+2%) | 2mo | $240,000 | $178 | 61 |
| 175 Mango St | 0.70mi | 3/1.0 | 1,300 (-2%) | 6mo | $224,500 | $173 | 60 |
| 1118 E Fisher St | 0.47mi | 3/2.0 | 1,447 (+10%) | 3mo | $430,000 | $297 | 55 |
| 2911 N Hayne St | 0.49mi | 4/2.0 (+1) | 1,206 (-9%) | 2mo | $168,000 | $139 | 52 |
| 1300 E Fisher St | 0.55mi | 2/2.0 (-1) | 1,438 (+9%) | 2mo | $295,000 | $205 | 49 |
| 3090 N 15th Ave | 0.59mi | 4/2.0 (+1) | 1,482 (+12%) | 3mo | $300,000 | $202 | 40 |
Match score weights: distance 35% · size 25% · config 20% · recency 20%. Top-matched comps best support the ARV.
Projected returns pro-forma
-3.0% appreciation · 3.39% rent growth · sell at horizon
- IRR
- 0.9%
- Equity multiple
- 1.04×
- Total profit
- $1,776
- Equity at exit
- $26,824
- IRR
- 10.9%
- Equity multiple
- 1.87×
- Total profit
- $43,674
- Equity at exit
- $15,554
Cash invested: $50,372 (down + closing). Projections, not guarantees.
Landlord ↔ Tenant lean methodology
- Overall (STATE)
- 87 Strongly Landlord-Friendly
- State Florida
- 87 Strongly Landlord-Friendly · R+3
- County
- — inherits STATE
- City
- — inherits STATE
ZIP-level market 32503
- Rents YoY
- 3.4%
- Active inventory
- 240
- Price-to-rent
- 7.2×
Monthly cashflow live
- Estimated rent
- $2,083 high interval (Pro) →
- Mortgage (P&I)
- −$943
- Tax from tax record
- −$154 /mo · $1,847/yr
- Insurance
- −$75
- HOA
- −$0
- Vacancy / Maint / Mgmt
- −$437
- Net cashflow
- $473
Break-even live
UW: 25.0% down · 7.5% · 30yr · 1.5% tax · 5.0% vac · 8.0% maint · 8.0% mgmt
Financing live
Cash to close
- Down payment
- $44,975
- Closing costs
- $5,397
- Reserves months
- —
- Total cash needed
- —
Loan-product check · same deal, 3 products live
Conventional
25% down · 7.5% · 30yr
- Down + closing
- —
- Monthly P&I
- —
- Monthly cashflow
- —
- DSCR
- —
- Eligible?
- —
Personal DTI + credit; lowest rate.
DSCR
20% down · 8.5% · 30yr
- Down + closing
- —
- Monthly P&I
- —
- Monthly cashflow
- —
- DSCR
- —
- Eligible?
- —
No personal income docs; deal must DSCR.
Hard money
10% down · 12.0% · 12mo
- Down + closing
- —
- Monthly P&I
- —
- Monthly cashflow
- —
- DSCR
- —
- Eligible?
- —
Short-term bridge; refi at stabilization.
Rent comps 11 comps
| Address | Beds | Baths | Sqft | Rent | $/sqft | DOM | Units | Dist |
|---|---|---|---|---|---|---|---|---|
| 3131 N 10th Ave Pensacola, FL | 3.0 | 1.5 | 1085 | $1,700 | $1.57 | 23d | 1 | 0.21mi |
| 1121 E Maxwell St Pensacola, FL | 3.0 | 2.5 | 1716 | $3,550 | $2.07 | 23d | 1 | 0.85mi |
| 2115 N 12th Ave Pensacola, FL | 2.0 | 1.5 | 950 | $1,800 | $1.89 | 13d | 1 | 0.86mi |
| 3014 Magnolia Ave Pensacola, FL | 3.0 | 2.0 | 1650 | $2,750 | $1.67 | 23d | 1 | 0.87mi |
| 2008 N 8th Ave Pensacola, FL | 3.0 | 2.0 | 1058 | $1,250 | $1.18 | 13d | 1 | 0.92mi |
| 4400 N 9th Ave Pensacola, FL | 3.0 | 1.5 | 1713 | $2,000 | $1.17 | 23d | 1 | 1.00mi |
| 1414 E Mallory St Pensacola, FL | 3.0 | 2.0 | 1323 | $3,400 | $2.57 | 23d | 1 | 1.22mi |
| 531 Ditmar St Unit B Pensacola, FL | 2.0 | 1.0 | 1094 | $1,450 | $1.33 | 23d | 1 | 1.25mi |
| 407 W Jordan St Unit NA Pensacola, FL | 3.0 | 2.0 | 1300 | $2,200 | $1.69 | 23d | 1 | 1.30mi |
| 721 W Jordan St Pensacola, FL | 3.0 | 2.0 | 1030 | $1,895 | $1.84 | 23d | 1 | 1.37mi |
| 1704 E Lee St Pensacola, FL | 3.0 | 2.0 | 1226 | $2,295 | $1.87 | 23d | 1 | 1.50mi |
Listing history 15 events
-
2026-06-18days on market $179,900 Active 20 DOM
-
2026-06-17days on market $179,900 Active 19 DOM
-
2026-06-16days on market $179,900 Active 18 DOM
-
2026-06-15days on market $179,900 Active 17 DOM
-
2026-06-14days on market $179,900 Active 15 DOM
-
2026-06-10days on market $179,900 Active 12 DOM
-
2026-06-09days on market $179,900 Active 11 DOM
-
2026-06-08days on market $179,900 Active 10 DOM
-
2026-06-07days on market $179,900 Active 9 DOM
-
2026-06-03days on market $179,900 Active 5 DOM
-
2026-06-02days on market $179,900 Active 4 DOM
-
2026-06-01days on market $179,900 Active 3 DOM
-
2026-05-31days on market $179,900 Active 2 DOM
-
2026-05-31remarks 693-char remark
-
2026-05-31$179,900 Active 1 DOM
ⓘ Source: listings_history table (triggers on properties + properties_extension) + one-shot
backfill from property_details.listing_events for pre-trigger history.
Tax reassessment forecast FL · Resets to sale price
- Current annual tax
- $1,847 · $154/mo
- Projected year-2 tax
- $1,847 · $154/mo
- Expected delta
- $0/yr ($0/mo · 0.0%)
ⓘ Screening estimate from a state-policy table — verify with the county assessor before closing.
Climate risk First Street
- Flood 4/10 Moderate FEMA zone X (unshaded) · 20% chance over 30 yrs
- Wildfire 1/10 Low
- Heat 10/10 Extreme 7 d/yr ≥105°F today · 22 d/yr by 30 yrs out
- Wind 9/10 Extreme 99% chance of damaging wind over 30 yrs
- Air quality 2/10 Low 0 unhealthy d/yr today · 1 by 30 yrs out
Nearby sold comps map
Loading sold comps map…
Walkable amenities ~0.75 mi
Loading nearby amenities…
Taxation est. · year 1
- Rental income
- $24,991
- − Mortgage interest
- −$10,077
- − Property taxes
- −$1,847
- − Insurance
- −$900
- − Repairs & maintenance
- −$1,999
- − Management
- −$1,999
- − Depreciation
- −$5,233
- Taxable income
- $2,935
- Est. tax owed @ 24.0%
- −$704
- After-tax cash flow
- $4,971/yr
For passive investors: Depreciation is non-cash, so a rental often shows a tax loss while cash-flowing — sheltering income. Rental losses are passive: they offset passive income freely, and up to $25,000/yr can offset ordinary (W-2) income if you actively participate and your MAGI is under $100k (phasing out to $0 by $150k); unused losses carry forward. On sale, claimed depreciation is recaptured at up to 25%, and gains may owe capital-gains tax (a 1031 exchange can defer both). Figures are a year-1 estimate at your 24.0% rate — not tax advice; consult a CPA.
Schools (NCES district)
- District
- Escambia
- NCES district ID
- 1200510
- Math proficiency
- 40% ▼ -9.00%
- Reading proficiency
- 45% ▼ -4.00%
- Median HH income
- $44,649
- Composite
- 36.04/100
- National rank
- #4773
- State rank
- #56 of 73 in FL
Livability — Pensacola
- Score
- 83/100
- State rank
- #53
- US rank
- #924
Category grades
Schools grade is shown separately in the Schools card above.
Census & demographics
- Census place
- Pensacola, FL
- County
- Escambia County · 301,722 people
- City population
- 237,636
- Metro
- Pensacola-Ferry Pass-Brent, FL
- Population (ZIP)
- 33,559
- Household income
- $71,411
- Rent vs Own
- Severe rent burden
- 948.0
Population outlook (Escambia County) Hauer SSP2
- Today (2025)
- 334,637 people
- By 2030
- 345,779 · +3.3%
- By 2040
- 364,828 · +9.0%
- By 2050
- 378,514 · +13.1%
- By 2075
- 403,220 · +20.5%
- By 2100
- 386,125 · +15.4%
Race, ethnicity, and origin ACS 2023
- Neighborhood character
- Predominantly White (68%)
- Race & ethnicity
- White 68% Black 20% Two or more races 6% Hispanic / Latino 5% Asian 2%
- Common ancestry
- Lithuanian 3% Italian 2% Romanian 2%
- Foreign-born
- 5% · Canada, China
- Languages at home
- 93% English-only · Spanish 3% Arabic 1% Tagalog/Filipino 1%
Political lean MEDSL · Escambia
- 2024 margin
- R (+19.5) · D 39.7% · R 59.2% · Other 1.1%
- 2008→2024 swing
- -0.2pp no change · 2008: -19.3pp · 2024: -19.5pp
- All cycles
- 2024: R+19.5 2020: R+15.1 2016: R+20.6 2012: R+20.6 2008: R+19.3
Not yet ingested
- Civics
- —
Market trends
- HPI YoY
- ▼ -300.02%
- Current HPI
- 294.4873
- Rent YoY
- ▲ 3.39%
- Metro
- Pensacola-Ferry Pass-Brent, FL
- State GDP YoY
- ▲ 3.28%
- F500 in state
- 36
Industry mix (Fortune 500 HQ in FL)
| Industry | F500 HQs | Revenue |
|---|---|---|
| Industrial Technology | 2 | $29B |
|
||
| Insurance | 2 | $17B |
|
||
| Retail | 1 | $60B |
|
||
| Technology Distribution | 1 | $58B |
|
||
| Homebuilding | 1 | $35B |
|
||
| Technology Manufacturing | 1 | $35B |
|
||
Price history
+482.2% since first listed4 events — show timeline
- 2026-05-29 Listed $179,900 PARMLS
- 2025-12-11 Sold (Public Records) $135,000 Public Records
- 1992-02-01 Sold (Public Records) $29,100 Public Records
- 1978-01-01 Sold (Public Records) $30,900 Public Records
Property tax history
+6.9%/yrLatest (2025): $1,847 · +4.2% YoY. Source: county tax records.
Cash-flow waterfall
monthlySold comps — $/sqft
last 12 mo · ≤1 miLoading sold comps…