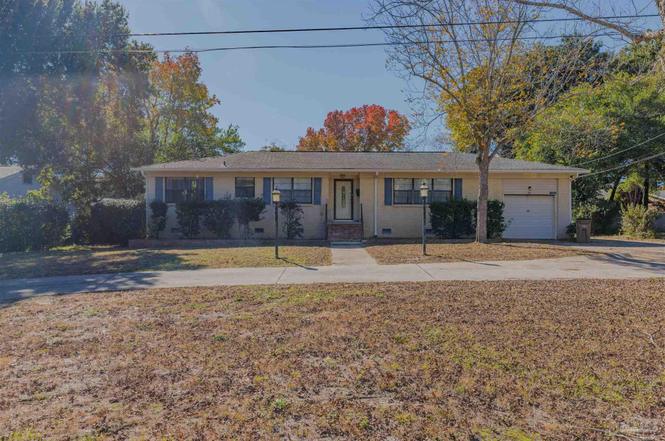
2035 Summit Blvd · Pensacola, FL
Flood risk 1/10 · Minimal
- FEMA flood zone
- X (unshaded)
- Chance of flooding over 30 yrs
- 0.0%
- Est. flood insurance / yr
- $507 – $1,088
Fire risk 1/10 · Minimal
- Est. fire insurance / yr
- $947 – $1,759
Heat risk 10/10 · Severe
- Hot days now (above 105°F)
- 7 days/yr
- Hot days in 30 yrs
- 22 days/yr
Wind risk 9/10 · Severe
- Chance of severe wind over 30 yrs
- 99.0%
Air-quality risk 1/10 · Minimal
- Unhealthy air days now
- 0 days/yr
- Unhealthy air days in 30 yrs
- 0 days/yr
Risk factors via First Street. Map © Google.
Why this score? — see what drove the C grade
The composite is a weighted blend of 9 inputs, each scored 0–100. Each bar is that input's sub-score; the figure is the points it added to the 100-point composite (weight × sub-score).
- Cash flow +19.6/30.0
- ARV discount +15.0/15.0
- DSCR +6.2/10.0
- 1% rule +5.5/10.0
- Livability +4.2/5.0
- Schools +3.6/10.0
- Rent growth +3.3/5.0
- Condition / age +2.5/5.0
- Appreciation +0.0/10.0
$239,000
🖨 Deal sheet 📄 Offer letter ✓ Due diligence
Listing remarks
INVESTOR ALERT! Major price reduction. Perfect home for the home renovator!! This charming 4-bedroom, 3-bath home offers both comfort and potential in a highly convenient location close to shops, dining, schools, and major amenities. Warm wood floors flow throughout the main living areas, creating an inviting and timeless feel. A standout feature is the enclosed Florida room—bright, versatile, and perfect for year-round enjoyment. It’s an ideal space for a cozy lounge, home office, playroom, or indoor garden retreat. The home’s layout provides plenty of flexibility for families, guests, or multi-generational living. With a bit of updating, this property has excellent pote
Key facts
- Two shed
- Large lot
- 0.37 acre lot
Tags
Property features AI
Finance
- HOA & community: No association
Exterior
- Parking: Carport (covered) - converted garage included; 1 total parking space
- Utilities: Public water; Circuit breaker electric with copper wiring; Cable available
- Home design: Single-story (one level); Detached property; Resale home; Insulation and insulated walls
- Construction: Frame construction; Slab foundation
- Exterior features: Chain link fencing; Yard building; Public maintained road access; Composition roof
Interior
- Kitchen: Dishwasher; Refrigerator; Electric water heater
- Bedrooms: Master bedroom on the first floor
- Flooring: Hardwood; Carpet
- Bathrooms: 3 full bathrooms; Bathrooms not updated
- Heating & cooling: Central heating; Central air conditioning
- Interior features: Sun room; Storage; Blinds and drapes
- Laundry & utility: Washer/dryer hookups
Neighborhood map
What this means for you Summary
Snapshot
- This is a 4-bed/2.0-bath single-family listed at $239k.
Deal economics
- At list price, monthly cash flow is $278 ($3k/yr) — positive.
- The deal already cash-flows at list — no discount required.
- Meets the 1% rule at list price ($3k rent vs $239k).
- Recommended offer: $210k (12.0% below list) — sets the bar for market timing.
- Cap rate 7.7% vs local median 3.6% in Pensacola — top-decile yield for the area; either an underpriced asset or a hidden risk that comps aren't pricing in. Stress-test before assuming the spread holds.
Location & tenants
- Location reads 83/100 on livability (#53 in FL, #924 nationally) — a professional / high-income tenant draw. Strengths: commute A+, cost of living A+, housing A+.
- Escambia (suburban): math 40% / reading 45% proficiency, ranked #56 of 73 in FL (top 77%) — families likely to look elsewhere, expect single-tenant / working-renter base with shorter leases.
- Market conditions: Rents rising (+3.4%/yr); 240 active listings in the ZIP; 6 comparable units currently listed for rent nearby; rentals at typical pace (median 24d on market — plan ~3-4 weeks tenant-placement turnaround); 1,479 units permitted in Escambia County in 2024 (0 in 5+ unit buildings).
- This rent runs 42% of the median local income ($71k/yr) — at the standard rent-burdened threshold; future hikes will face affordability resistance.
Forward outlook
- Local home prices are declining (-3.0%/yr); year-one equity from $2k of loan paydown is wiped out by about $7k of value loss. Plan a longer hold.
- Escambia County population projected at +13% by 2050 — modest demand growth; plan on rents tracking national, not racing it.
Negotiation context
- It's been on market 151 days — a 12% lower offer ($210k) is reasonable based on typical stale-listing flexibility.
Risks & watch-outs
- Watch-outs: built in 1958 — expect roof / HVAC / electrical / plumbing capex.
- Climate carrying-cost: severe wind risk, 99% chance of damaging wind over 30y; extreme-heat days projected 7→22/yr by 2055 (HVAC capex compounding) — expect insurance premiums to compound above CPI over the hold.
Questions for the listing agent
- It's been on market 151 days. Have you received any prior offers? Is the seller open to a 12% concession, seller financing, or rate buy-down credit?
- Built in 1958 — when were the roof, HVAC, electrical panel, plumbing, and water heater last replaced?
- Why hasn't it sold? Are there any deal-killer items the seller is aware of (foundation, flood, title, zoning, code violations)?
- Is there a deadline driving the sale (1031 exchange, divorce, estate, relocation)? That informs how much negotiation room exists.
- What's the average days-on-market for RENTAL listings here right now (not sales)? A rising rental-DOM trend means longer vacancies and softer asking-rent achievability than the comps imply.
- What's the recent tenant-quality profile in this submarket — average credit score on applications, eviction rate, late-payment / NSF rate, and stable-employment percentage? A property-management company in the area should have these aggregated.
- How much new for-sale + rental construction is in the pipeline within 1–3 miles? Heavy new supply typically softens prices + rents 12–24 months out; constrained supply supports both.
Investment metrics
- 1% rule
- 1.05% ✓
- Cap rate
- 7.69%
- Cash-on-cash
- 4.98%
- DSCR
- 1.22
- GRM
- 7.9
CMA / ARV
- ARV (on-the-fly)
- $368,745
- Comps found
- 12
Show comp detail 12 sales within ~0.75 mi
| Address | Dist | Beds/Ba | Sqft | Sold | Price | $/sf | Match |
|---|---|---|---|---|---|---|---|
| 2035 Summit Blvd | 0.00mi | 4/3.0 | 1,891 (0%) | 1mo | $220,000 | $116 | 95 |
| 1834 Peyton Dr | 0.08mi | 3/2.0 (-1) | 1,755 (-7%) | 3mo | $360,000 | $205 | 77 |
| 1910 Copley Dr | 0.04mi | 3/2.0 (-1) | 1,792 (-5%) | 9mo | $365,000 | $204 | 76 |
| 2005 Peyton Dr | 0.17mi | 3/2.0 (-1) | 1,763 (-7%) | 1mo | $287,900 | $163 | 75 |
| 2021 Morningside Dr | 0.22mi | 4/2.0 | 1,760 (-7%) | 6mo | $330,000 | $188 | 73 |
| 1072 Gerhardt Dr | 0.33mi | 3/2.0 (-1) | 1,876 (-1%) | 7mo | $365,000 | $195 | 72 |
| 1813 Copley Dr | 0.21mi | 3/2.0 (-1) | 1,796 (-5%) | 5mo | $295,500 | $165 | 72 |
| 3970 Piedmont Rd | 0.54mi | 4/2.0 | 1,972 (+4%) | 1mo | $350,000 | $177 | 67 |
| 1920 Hallmark Dr | 0.27mi | 3/2.0 (-1) | 1,757 (-7%) | 7mo | $425,000 | $242 | 65 |
| 243 Dean Rd | 0.44mi | 3/2.0 (-1) | 1,818 (-4%) | 7mo | $350,000 | $193 | 62 |
| 2325 Summit Blvd | 0.36mi | 4/2.0 | 2,152 (+14%) | 2mo | $425,000 | $197 | 58 |
| 3920 Dunwody Dr | 0.51mi | 4/3.0 | 2,128 (+12%) | 1mo | $450,000 | $211 | 50 |
Match score weights: distance 35% · size 25% · config 20% · recency 20%. Top-matched comps best support the ARV.
Projected returns pro-forma
-3.0% appreciation · 3.39% rent growth · sell at horizon
- IRR
- -8.1%
- Equity multiple
- 0.70×
- Total profit
- $-19,980
- Equity at exit
- $35,636
- IRR
- 2.0%
- Equity multiple
- 1.15×
- Total profit
- $9,760
- Equity at exit
- $20,664
Cash invested: $66,920 (down + closing). Projections, not guarantees.
Landlord ↔ Tenant lean methodology
- Overall (STATE)
- 87 Strongly Landlord-Friendly
- State Florida
- 87 Strongly Landlord-Friendly · R+3
- County
- — inherits STATE
- City
- — inherits STATE
ZIP-level market 32503
- Rents YoY
- 3.4%
- Active inventory
- 240
- Price-to-rent
- 7.9×
Monthly cashflow live
- Estimated rent
- $2,512 high interval (Pro) →
- Mortgage (P&I)
- −$1,253
- Tax from tax record
- −$354 /mo · $4,243/yr
- Insurance
- −$100
- HOA
- −$0
- Vacancy / Maint / Mgmt
- −$527
- Net cashflow
- $278
Break-even live
UW: 25.0% down · 7.5% · 30yr · 1.5% tax · 5.0% vac · 8.0% maint · 8.0% mgmt
Financing live
Cash to close
- Down payment
- $59,750
- Closing costs
- $7,170
- Reserves months
- —
- Total cash needed
- —
Loan-product check · same deal, 3 products live
Conventional
25% down · 7.5% · 30yr
- Down + closing
- —
- Monthly P&I
- —
- Monthly cashflow
- —
- DSCR
- —
- Eligible?
- —
Personal DTI + credit; lowest rate.
DSCR
20% down · 8.5% · 30yr
- Down + closing
- —
- Monthly P&I
- —
- Monthly cashflow
- —
- DSCR
- —
- Eligible?
- —
No personal income docs; deal must DSCR.
Hard money
10% down · 12.0% · 12mo
- Down + closing
- —
- Monthly P&I
- —
- Monthly cashflow
- —
- DSCR
- —
- Eligible?
- —
Short-term bridge; refi at stabilization.
Rent comps 6 comps
| Address | Beds | Baths | Sqft | Rent | $/sqft | DOM | Units | Dist |
|---|---|---|---|---|---|---|---|---|
| 3791 Maule Rd Pensacola, FL | 4.0 | 3.0 | 2000 | $3,250 | $1.62 | 23d | 1 | 0.86mi |
| 4400 N 9th Ave Pensacola, FL | 3.0 | 1.5 | 1713 | $2,000 | $1.17 | 23d | 1 | 0.91mi |
| 3547 Firestone Blvd Pensacola, FL | 4.0 | 2.0 | 2000 | $2,695 | $1.35 | 23d | 1 | 1.04mi |
| 3545 Hopestill Rd Pensacola, FL | 4.0 | 2.0 | 1984 | $2,400 | $1.21 | 23d | 1 | 1.15mi |
| 711 Underwood Ave Pensacola, FL | 3.0 | 1.0–2.5 | 950 | $1,718 | $1.81 | 13d | 25 | 1.23mi |
| 3014 Magnolia Ave Pensacola, FL | 3.0 | 2.0 | 1650 | $2,750 | $1.67 | 23d | 1 | 1.29mi |
Listing history 6 events
-
2026-05-15status Pending
-
2026-05-03historical Contingent
-
2026-04-20price $239,000
-
2026-03-19price $269,000
-
2026-01-09price $285,000
-
2025-12-15$299,000 Active
ⓘ Source: listings_history table (triggers on properties + properties_extension) + one-shot
backfill from property_details.listing_events for pre-trigger history.
Tax reassessment forecast FL · Resets to sale price
- Current annual tax
- $4,243 · $354/mo
- Projected year-2 tax
- $4,243 · $354/mo
- Expected delta
- $0/yr ($0/mo · 0.0%)
ⓘ Screening estimate from a state-policy table — verify with the county assessor before closing.
Climate risk First Street
- Flood 1/10 Low FEMA zone X (unshaded) · 0% chance over 30 yrs
- Wildfire 1/10 Low
- Heat 10/10 Extreme 7 d/yr ≥105°F today · 22 d/yr by 30 yrs out
- Wind 9/10 Extreme 99% chance of damaging wind over 30 yrs
- Air quality 1/10 Low 0 unhealthy d/yr today · 0 by 30 yrs out
Nearby sold comps map
Loading sold comps map…
Walkable amenities ~0.75 mi
Loading nearby amenities…
Taxation est. · year 1
- Rental income
- $30,141
- − Mortgage interest
- −$13,388
- − Property taxes
- −$4,243
- − Insurance
- −$1,195
- − Repairs & maintenance
- −$2,411
- − Management
- −$2,411
- − Depreciation
- −$6,953
- Taxable loss
- −$461
- Est. tax savings @ 24.0%
- +$111
- After-tax cash flow
- $3,443/yr
For passive investors: Depreciation is non-cash, so a rental often shows a tax loss while cash-flowing — sheltering income. Rental losses are passive: they offset passive income freely, and up to $25,000/yr can offset ordinary (W-2) income if you actively participate and your MAGI is under $100k (phasing out to $0 by $150k); unused losses carry forward. On sale, claimed depreciation is recaptured at up to 25%, and gains may owe capital-gains tax (a 1031 exchange can defer both). Figures are a year-1 estimate at your 24.0% rate — not tax advice; consult a CPA.
Schools (NCES district)
- District
- Escambia
- NCES district ID
- 1200510
- Math proficiency
- 40% ▼ -9.00%
- Reading proficiency
- 45% ▼ -4.00%
- Median HH income
- $44,649
- Composite
- 36.04/100
- National rank
- #4773
- State rank
- #56 of 73 in FL
Livability — Pensacola
- Score
- 83/100
- State rank
- #53
- US rank
- #924
Category grades
Schools grade is shown separately in the Schools card above.
Census & demographics
- Census place
- Pensacola, FL
- County
- Escambia County · 301,722 people
- City population
- 237,636
- Metro
- Pensacola-Ferry Pass-Brent, FL
- Population (ZIP)
- 33,559
- Household income
- $71,411
- Rent vs Own
- Severe rent burden
- 948.0
Population outlook (Escambia County) Hauer SSP2
- Today (2025)
- 334,637 people
- By 2030
- 345,779 · +3.3%
- By 2040
- 364,828 · +9.0%
- By 2050
- 378,514 · +13.1%
- By 2075
- 403,220 · +20.5%
- By 2100
- 386,125 · +15.4%
Race, ethnicity, and origin ACS 2023
- Neighborhood character
- Predominantly White (68%)
- Race & ethnicity
- White 68% Black 20% Two or more races 6% Hispanic / Latino 5% Asian 2%
- Common ancestry
- Lithuanian 3% Italian 2% Romanian 2%
- Foreign-born
- 5% · Canada, China
- Languages at home
- 93% English-only · Spanish 3% Arabic 1% Tagalog/Filipino 1%
Political lean MEDSL · Escambia
- 2024 margin
- R (+19.5) · D 39.7% · R 59.2% · Other 1.1%
- 2008→2024 swing
- -0.2pp no change · 2008: -19.3pp · 2024: -19.5pp
- All cycles
- 2024: R+19.5 2020: R+15.1 2016: R+20.6 2012: R+20.6 2008: R+19.3
Not yet ingested
- Civics
- —
Market trends
- HPI YoY
- ▼ -300.02%
- Current HPI
- 294.4873
- Rent YoY
- ▲ 3.39%
- Metro
- Pensacola-Ferry Pass-Brent, FL
- State GDP YoY
- ▲ 3.28%
- F500 in state
- 36
Industry mix (Fortune 500 HQ in FL)
| Industry | F500 HQs | Revenue |
|---|---|---|
| Industrial Technology | 2 | $29B |
|
||
| Insurance | 2 | $17B |
|
||
| Retail | 1 | $60B |
|
||
| Technology Distribution | 1 | $58B |
|
||
| Homebuilding | 1 | $35B |
|
||
| Technology Manufacturing | 1 | $35B |
|
||
Price history
-20.1% since first listed6 events — show timeline
- 2026-05-15 Pending — PARMLS
- 2026-05-03 Contingent — PARMLS
- 2026-04-20 Price Changed $239,000 PARMLS
- 2026-03-19 Price Changed $269,000 PARMLS
- 2026-01-09 Price Changed $285,000 PARMLS
- 2025-12-15 Listed $299,000 PARMLS
Property tax history
+40.6%/yrLatest (2025): $4,243 · +2201.8% YoY. Source: county tax records.
Cash-flow waterfall
monthlySold comps — $/sqft
last 12 mo · ≤1 miLoading sold comps…