 🏗️ New Construction
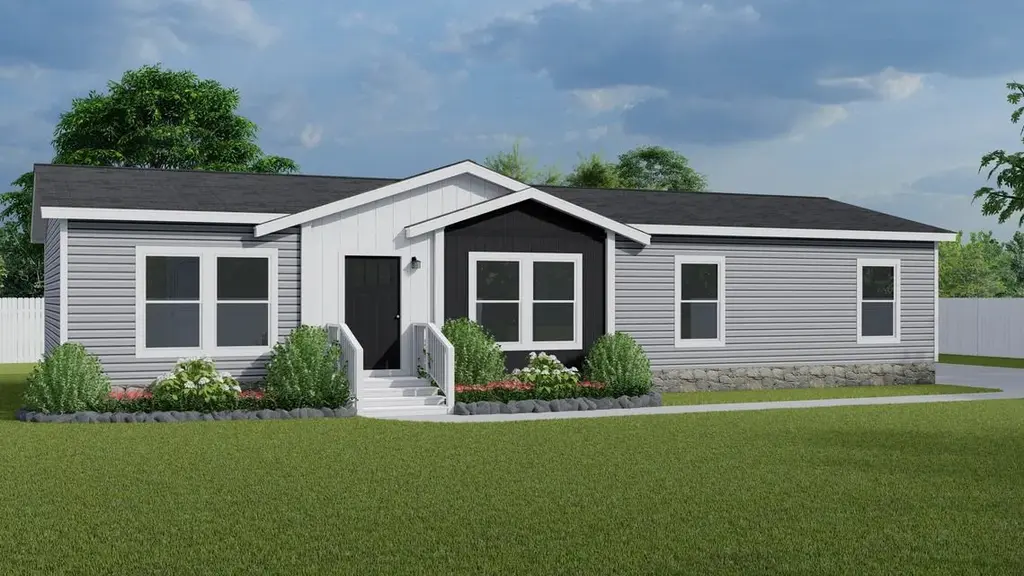
Sterling Plan · Kyle, TX
Flood risk 1/10 · Minimal
- FEMA flood zone
- X (unshaded)
- Chance of flooding over 30 yrs
- 0.0%
- Est. flood insurance / yr
- $507 – $1,088
Fire risk 4/10 · Minor
- Est. fire insurance / yr
- $1,222 – $2,270
Heat risk 8/10 · Major
- Hot days now (above 108°F)
- 7 days/yr
- Hot days in 30 yrs
- 20 days/yr
Wind risk 8/10 · Major
- Chance of severe wind over 30 yrs
- 80.0%
Air-quality risk 1/10 · Minimal
- Unhealthy air days now
- 0 days/yr
- Unhealthy air days in 30 yrs
- 0 days/yr
Risk factors via First Street. Map © Google.
Why this score? — see what drove the F grade
The composite is a weighted blend of 9 inputs, each scored 0–100. Each bar is that input's sub-score; the figure is the points it added to the 100-point composite (weight × sub-score).
- ARV discount +7.5/15.0
- Condition / age +4.0/5.0
- Livability +3.8/5.0
- Schools +3.5/10.0
- Rent growth +2.4/5.0
- Cash flow +1.6/30.0
- 1% rule +0.0/10.0
- DSCR +0.0/10.0
- Appreciation +0.0/10.0
$109,995
🖨 Deal sheet 📄 Offer letter ✓ Due diligence
Listing remarks MLS
Discover the perfect balance of space and sustainability with the Sterling. This 3-bedroom, 2-bathroom home offers a flexible layout and modern amenities. Enjoy the freedom to customize your living space with a versatile bonus room that can adapt to your family's needs. Built with Clayton's innovative eBuilt system, the Sterling incorporates over 25 eco-friendly features without compromising on comfort or style. Experience the benefits of reduced energy consumption and a smaller environmental footprint.
Key facts
- Listed 71 days
Neighborhood map
What this means for you Summary
Snapshot
- This is a 3-bed/2.0-bath manufactured listed at $110k. Condition is rated good.
Deal economics
- At list price, monthly cash flow is $-2k ($-23k/yr) — negative.
- The deal already cash-flows at list — no discount required.
- Meets the 1% rule at list price ($2k rent vs $110k).
- Recommended offer: $103k (6.0% below list) — sets the bar for market timing.
- Cap rate 1.6% vs local median 3.3% in Kyle — below-typical yield; the buyer is paying a premium for something (appreciation thesis, condition, location) that the cap rate doesn't capture.
Location & tenants
- Location reads 75/100 on livability (#138 in TX, #3,993 nationally) — a middle-class / working-renter tenant base. Strengths: housing A+, health & safety A+, employment A; Watch: schools D, amenities F, commute F.
- Hays CISD (rural): math 35% / reading 41% proficiency, ranked #390 of 826 in TX (top 47%) — families likely to look elsewhere, expect single-tenant / working-renter base with shorter leases.
- Market conditions: Rents soft (-0.3%/yr); 1801 active listings in the ZIP; 29 comparable units currently listed for rent nearby; rentals at typical pace (median 15d on market — plan ~3-4 weeks tenant-placement turnaround); solid renter incomes; 5,270 units permitted in Hays County in 2024 (1,464 in 5+ unit buildings).
Forward outlook
- Local home prices are declining (-3.0%/yr); year-one equity from $3k of loan paydown is wiped out by about $15k of value loss. Plan a longer hold.
- Hays County population projected at +93% by 2050 — long-run rental-demand tailwind backs the buy-and-hold thesis.
Negotiation context
- It's been on market 71 days — a 6% lower offer ($103k) is reasonable based on typical stale-listing flexibility.
Risks & watch-outs
- Watch-outs: property tax is 6.8% of price.
- Climate carrying-cost: severe wind risk, 80% chance of damaging wind over 30y; extreme-heat days projected 7→20/yr by 2055 (HVAC capex compounding) — expect insurance premiums to compound above CPI over the hold.
Questions for the listing agent
- What do current leases actually rent for vs. the listed asking? Can we see a recent rent roll and the last 12 months of T-12 income?
- It's been on market 71 days. Have you received any prior offers? Is the seller open to a 6% concession, seller financing, or rate buy-down credit?
- Property tax is high relative to price — has the assessment been appealed recently, and will the sale trigger a re-assessment?
- Why hasn't it sold? Are there any deal-killer items the seller is aware of (foundation, flood, title, zoning, code violations)?
- Is there a deadline driving the sale (1031 exchange, divorce, estate, relocation)? That informs how much negotiation room exists.
- Schools are D-rated, which usually means shorter tenancies and higher turnover. Who's the typical renter profile here, and what's been the actual vacancy rate?
- The area grade is low — what's the realistic commute time and amenity access for the typical tenant pool here? Any planned neighborhood developments (good or bad) we should know about?
- What's the average days-on-market for RENTAL listings here right now (not sales)? A rising rental-DOM trend means longer vacancies and softer asking-rent achievability than the comps imply.
- What's the recent tenant-quality profile in this submarket — average credit score on applications, eviction rate, late-payment / NSF rate, and stable-employment percentage? A property-management company in the area should have these aggregated.
- How much new for-sale + rental construction is in the pipeline within 1–3 miles? Heavy new supply typically softens prices + rents 12–24 months out; constrained supply supports both.
Investment metrics
- 1% rule
- 0.38% ✗
- Cap rate
- 1.63%
- Cash-on-cash
- -16.65%
- DSCR
- 0.26
- GRM
- 21.8
CMA / ARV
- ARV (median comp)
- $499,837
- List price
- $109,995
- Delta
- -77.99%
- Verdict
- UNDERPRICED
- Comps
- 2 within 2.0 mi
Show comp detail 1 sale within ~0.75 mi
| Address | Dist | Beds/Ba | Sqft | Sold | Price | $/sf | Match |
|---|---|---|---|---|---|---|---|
| 93 White Bluff Dr | 0.04mi | 4/2.5 (+1) | 1,560 (+3%) | 12mo | $99,000 | $63 | 76 |
Match score weights: distance 35% · size 25% · config 20% · recency 20%. Top-matched comps best support the ARV.
Projected returns pro-forma
-3.0% appreciation · 0.0% rent growth · sell at horizon
- IRR
- -52.0%
- Equity multiple
- -0.50×
- Total profit
- $-210,226
- Equity at exit
- $74,527
- IRR
- —
- Equity multiple
- -1.60×
- Total profit
- $-363,849
- Equity at exit
- $43,217
Cash invested: $139,954 (down + closing). Projections, not guarantees.
Landlord ↔ Tenant lean methodology
- Overall (STATE)
- 87 Strongly Landlord-Friendly
- State Texas
- 87 Strongly Landlord-Friendly · R+5
- County
- — inherits STATE
- City
- — inherits STATE
ZIP-level market 78640
- Home prices YoY
- -33.8%
- Rents YoY
- -0.3%
- Active inventory
- 1801
- Price-to-rent
- 4.8×
Monthly cashflow live
- Estimated rent
- $1,915 high interval (Pro) →
- Mortgage (P&I)
- −$2,621
- Tax est. 1.5%
- −$625 /mo · $7,498/yr
- Insurance
- −$208
- HOA
- −$0
- Vacancy / Maint / Mgmt
- −$402
- Net cashflow
- $-1,941
Break-even live
UW: 25.0% down · 7.5% · 30yr · 1.5% tax · 5.0% vac · 8.0% maint · 8.0% mgmt
Financing live
Cash to close
- Down payment
- $124,959
- Closing costs
- $14,995
- Reserves months
- —
- Total cash needed
- —
Loan-product check · same deal, 3 products live
Conventional
25% down · 7.5% · 30yr
- Down + closing
- —
- Monthly P&I
- —
- Monthly cashflow
- —
- DSCR
- —
- Eligible?
- —
Personal DTI + credit; lowest rate.
DSCR
20% down · 8.5% · 30yr
- Down + closing
- —
- Monthly P&I
- —
- Monthly cashflow
- —
- DSCR
- —
- Eligible?
- —
No personal income docs; deal must DSCR.
Hard money
10% down · 12.0% · 12mo
- Down + closing
- —
- Monthly P&I
- —
- Monthly cashflow
- —
- DSCR
- —
- Eligible?
- —
Short-term bridge; refi at stabilization.
Rent comps 29 comps
| Address | Beds | Baths | Sqft | Rent | $/sqft | DOM | Units | Dist |
|---|---|---|---|---|---|---|---|---|
| 124 Hollis Ln Kyle, TX | 3.0 | 2.0 | 1610 | $1,945 | $1.21 | 15d | 1 | 0.28mi |
| 315 Nottingham Loop Kyle, TX | 3.0 | 2.0 | 1336 | $1,800 | $1.35 | 11d | 1 | 0.28mi |
| 100 Maplewood S Kyle, TX | 3.0 | 2.0 | 1685 | $1,700 | $1.01 | 44d | 1 | 0.51mi |
| 320 Goll ST Niederwald, TX | 1.0–2.0 | 1.0–2.0 | 1056 | $1,982 | $1.88 | 2d | 87 | 0.64mi |
| 314 Paddington Dr Kyle, TX | 3.0 | 2.0 | 1364 | $1,799 | $1.32 | 18d | 1 | 0.67mi |
| 232 Buttercup Way Kyle, TX | 3.0 | 2.0 | 1398 | $1,695 | $1.21 | 24d | 1 | 0.69mi |
| 387 Paddington Dr Kyle, TX | 4.0 | 2.0 | 1537 | $1,795 | $1.17 | 18d | 1 | 0.71mi |
| 210 Amberwood S Kyle, TX | 1.0–2.0 | 1.0–2.0 | 807 | $1,635 | $2.02 | 2d | 35 | 0.72mi |
| 119 Peppergrass Cv Kyle, TX | 4.0 | 2.5 | 2101 | $2,050 | $0.98 | 4d | 1 | 0.78mi |
| 220 Peppergrass Cv Kyle, TX | 3.0 | 2.5 | 1799 | $1,875 | $1.04 | 15d | 1 | 0.87mi |
| 364 Westminster Dr Kyle, TX | 4.0 | 2.0 | 1610 | $1,925 | $1.20 | 44d | 1 | 0.90mi |
| 3700 Dacy Ln Kyle, TX | 2.0–4.0 | 2.0 | 1182 | $1,332 | $1.13 | 4d | 1 | 0.93mi |
| 228 Pearl Lake Dr Kyle, TX | 3.0 | 2.0 | 1439 | $1,725 | $1.20 | 24d | 1 | 1.01mi |
| 228 Pearl Lake Dr Kyle, TX | 3.0 | 2.0 | 1439 | $1,725 | $1.20 | 22d | 1 | 1.01mi |
| 124 Lago Grande Dr Kyle, TX | 3.0 | 2.5 | 2024 | $1,995 | $0.99 | 44d | 1 | 1.12mi |
| 289 Lake Washington Dr Kyle, TX | 3.0 | 2.0 | 1389 | $1,699 | $1.22 | 12d | 1 | 1.13mi |
| 117 Mood Lake Dr Kyle, TX | 3.0 | 2.5 | 2120 | $2,170 | $1.02 | 2d | 1 | 1.18mi |
| 3400 Kyle Xing Kyle, TX | 1.0–2.0 | 1.0–2.0 | 950 | $2,040 | $2.15 | 2d | 19 | 1.23mi |
| 179 Sweetwater Dr Kyle, TX | 4.0 | 2.0 | 1773 | $1,995 | $1.13 | 12d | 1 | 1.25mi |
| 205 Mood Lake Dr Kyle, TX | 3.0 | 2.0 | 1419 | $1,595 | $1.12 | 24d | 1 | 1.27mi |
| 205 Mood Lake Dr Kyle, TX | 3.0 | 2.0 | 1419 | $1,595 | $1.12 | 22d | 1 | 1.27mi |
| 109 Granite Shoals Dr Kyle, TX | 3.0 | 2.0 | 1304 | $1,700 | $1.30 | 4d | 1 | 1.32mi |
| 3403 Kyle Xing Kyle, TX | 2.0 | 2.0 | 1257 | $1,934 | $1.54 | 20d | 1 | 1.36mi |
| 145 Greenbelt Reservoir Pass Unit 1546380P Kyle, TX | 4.0 | 2.0 | 1528 | $3,393 | $2.22 | 15d | 1 | 1.37mi |
| 204 Inks Ln Kyle, TX | 4.0 | 2.5 | 2150 | $1,995 | $0.93 | 12d | 1 | 1.38mi |
| 401 Town Lake Bnd Kyle, TX | 4.0 | 2.0 | 1785 | $2,250 | $1.26 | 44d | 1 | 1.43mi |
| 416 Purple Martin Ave Kyle, TX | 3.0 | 2.0 | 1311 | $1,800 | $1.37 | 24d | 1 | 1.43mi |
| 411 Town Lake Bnd Kyle, TX | 4.0 | 2.0 | 1681 | $2,025 | $1.20 | 18d | 1 | 1.43mi |
| 931 Brandi Cir Kyle, TX | 3.0 | 2.0 | 1343 | $1,750 | $1.30 | 4d | 1 | 1.44mi |
Listing history 14 events
-
2026-06-18days on market $109,995 Active 71 DOM
-
2026-06-17days on market $109,995 Active 70 DOM
-
2026-06-16days on market $109,995 Active 69 DOM
-
2026-06-15days on market $109,995 Active 68 DOM
-
2026-06-13days on market $109,995 Active 66 DOM
-
2026-06-09days on market $109,995 Active 62 DOM
-
2026-06-08days on market $109,995 Active 61 DOM
-
2026-06-07days on market $109,995 Active 60 DOM
-
2026-06-05days on market $109,995 Active 57 DOM
-
2026-06-03days on market $109,995 Active 56 DOM
-
2026-06-02days on market $109,995 Active 55 DOM
-
2026-06-01days on market $109,995 Active 54 DOM
-
2026-05-31days on market $109,995 Active 53 DOM
-
2026-04-08$109,995 Active 508-char remark
Show marketing remark (508 chars)
Discover the perfect balance of space and sustainability with the Sterling. This 3-bedroom, 2-bathroom home offers a flexible layout and modern amenities. Enjoy the freedom to customize your living space with a versatile bonus room that can adapt to your family's needs. Built with Clayton's innovative eBuilt system, the Sterling incorporates over 25 eco-friendly features without compromising on comfort or style. Experience the benefits of reduced energy consumption and a smaller environmental footprint.
ⓘ Source: listings_history table (triggers on properties + properties_extension) + one-shot
backfill from property_details.listing_events for pre-trigger history.
Climate risk First Street
- Flood 1/10 Low FEMA zone X (unshaded) · 0% chance over 30 yrs
- Wildfire 4/10 Moderate
- Heat 8/10 Severe 7 d/yr ≥108°F today · 20 d/yr by 30 yrs out
- Wind 8/10 Severe 80% chance of damaging wind over 30 yrs
- Air quality 1/10 Low 0 unhealthy d/yr today · 0 by 30 yrs out
Nearby sold comps map
Loading sold comps map…
Walkable amenities ~0.75 mi
Loading nearby amenities…
Taxation est. · year 1
- Rental income
- $22,980
- − Mortgage interest
- −$27,999
- − Property taxes
- −$7,498
- − Insurance
- −$2,499
- − Repairs & maintenance
- −$1,838
- − Management
- −$1,838
- − Depreciation
- −$14,541
- Taxable loss
- −$33,233
- Est. tax savings @ 24.0%
- +$7,976
- After-tax cash flow
- $-15,321/yr
For passive investors: Depreciation is non-cash, so a rental often shows a tax loss while cash-flowing — sheltering income. Rental losses are passive: they offset passive income freely, and up to $25,000/yr can offset ordinary (W-2) income if you actively participate and your MAGI is under $100k (phasing out to $0 by $150k); unused losses carry forward. On sale, claimed depreciation is recaptured at up to 25%, and gains may owe capital-gains tax (a 1031 exchange can defer both). Figures are a year-1 estimate at your 24.0% rate — not tax advice; consult a CPA.
Condition & rehab AI · 6 photos
This 3-bedroom, 2-bathroom home in Kyle, TX, is in excellent condition with modern amenities and a good curb appeal. It's ready for move-in and offers a great balance of space and sustainability.
Value-add opportunities
- Both Paint exterior walls — Enhances curb appeal and can increase both resale and rental value.
- Both Replace window treatments — Fresh window treatments can improve the home's aesthetic and increase its value.
- Both Upgrade flooring in bathrooms — Modern flooring can enhance the home's appeal and increase its value for both buyers and renters.
Renovation cost estimate screening
Value-add ROI direction
- Both Paint exterior walls — Enhances curb appeal and can increase both resale and rental value. ↑
- Both Replace window treatments — Fresh window treatments can improve the home's aesthetic and increase its value. ↑
- Both Upgrade flooring in bathrooms — Modern flooring can enhance the home's appeal and increase its value for both buyers and renters. ↑
ⓘ Cost ranges are severity-bucket heuristics (US national rule-of-thumb). Get contractor quotes + a written scope before underwriting a rehab budget.
Schools (NCES district)
- District
- Hays CISD
- NCES district ID
- 4800010
- Math proficiency
- 35% ▼ -15.00%
- Reading proficiency
- 41% ▼ -5.00%
- Median HH income
- $70,570
- Composite
- 34.78/100
- National rank
- #5118
- State rank
- #390 of 826 in TX
Livability — Kyle
- Score
- 75/100
- State rank
- #138
- US rank
- #3993
Category grades
Schools grade is shown separately in the Schools card above.
Census & demographics
- Census place
- Kyle, TX
- County
- Hays County · 280,138 people
- Metro
- Austin-Round Rock-Georgetown, TX
- Population (ZIP)
- 77,531
- Household income
- $90,075
- Rent vs Own
- Severe rent burden
- 2552.0
Population outlook (Hays County) Hauer SSP2
- Today (2025)
- 286,948 people
- By 2030
- 336,923 · +17.4%
- By 2040
- 441,894 · +54.0%
- By 2050
- 553,462 · +92.9%
- By 2075
- 838,261 · +192.1%
- By 2100
- 1,063,658 · +270.7%
Race, ethnicity, and origin ACS 2023
- Neighborhood character
- Diverse neighborhood (Simpson 0.56)
- Race & ethnicity
- Hispanic / Latino 55% White 36% Two or more races 29% Black 5% Native American 1%
- Hispanic origin (detail)
- Mexican 47% Puerto Rican 1%
- Common ancestry
- Italian 2% Slovak 2% Lithuanian 1%
- Foreign-born
- 13% · Canada
- Languages at home
- 63% English-only · Spanish 35%
Political lean MEDSL · Hays
- 2024 margin
- Lean D (+5.7) · D 52.1% · R 46.5% · Other 1.4%
- 2008→2024 swing
- +7.7pp toward D · 2008: -2.0pp · 2024: 5.7pp
- All cycles
- 2024: D+5.7 2020: D+10.8 2016: R+0.9 2012: R+10.4 2008: R+2.0
Not yet ingested
- Civics
- —
Market trends
- HPI YoY
- ▼ -92.64%
- Current HPI
- 181.7969
- Rent YoY
- ▼ -0.34%
- Metro
- Austin-Round Rock-Georgetown, TX
- State GDP YoY
- ▲ 3.95%
- F500 in state
- 110
Industry mix (Fortune 500 HQ in TX)
| Industry | F500 HQs | Revenue |
|---|---|---|
| Energy | 16 | $1,198B |
|
||
| Technology | 5 | $198B |
|
||
| Engineering / Construction | 4 | $72B |
|
||
| Energy Services | 3 | $60B |
|
||
| Utilities | 3 | $41B |
|
||
| Healthcare | 2 | $330B |
|
||
Price history
1 event — show timeline
- 2026-04-08 Listed $109,995 Zillow
Cash-flow waterfall
monthlySold comps — $/sqft
last 12 mo · ≤1 miLoading sold comps…