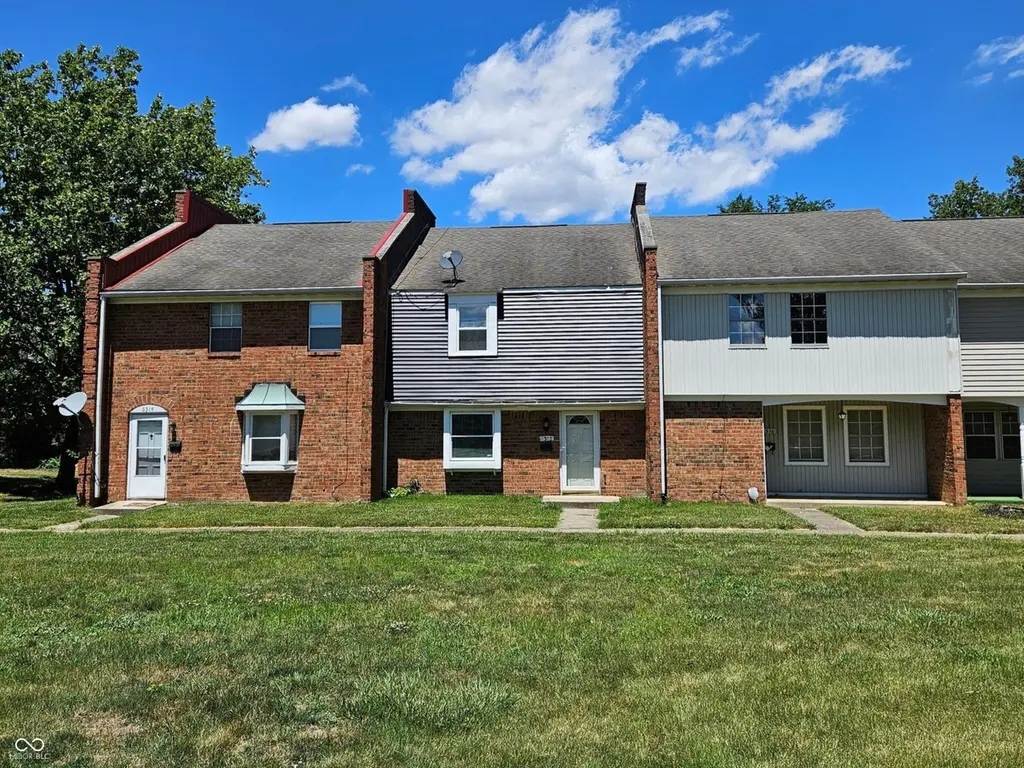
6312 Commons Dr · Indianapolis city (balance), IN
Flood risk 1/10 · Minimal
- FEMA flood zone
- X (unshaded)
- Chance of flooding over 30 yrs
- 0.0%
- Est. flood insurance / yr
- $507 – $1,088
Fire risk 1/10 · Minimal
- Est. fire insurance / yr
- $717 – $1,331
Heat risk 3/10 · Minor
- Hot days now (above 101°F)
- 7 days/yr
- Hot days in 30 yrs
- 19 days/yr
Wind risk 2/10 · Minimal
- Chance of severe wind over 30 yrs
- —
Air-quality risk 4/10 · Minor
- Unhealthy air days now
- 4 days/yr
- Unhealthy air days in 30 yrs
- 5 days/yr
Risk factors via First Street. Map © Google.
Why this score? — see what drove the D+ grade
The composite is a weighted blend of 9 inputs, each scored 0–100. Each bar is that input's sub-score; the figure is the points it added to the 100-point composite (weight × sub-score).
- Cash flow +23.5/30.0
- 1% rule +8.5/10.0
- DSCR +7.6/10.0
- Rent growth +3.5/5.0
- Livability +2.5/5.0
- Condition / age +2.5/5.0
- Schools +1.4/10.0
- ARV discount +0.2/15.0
- Appreciation +0.0/10.0
$115,000
🖨 Deal sheet 📄 Offer letter ✓ Due diligence
Listing remarks MLS
3 Bedroom 2 full bath. Tenant Rights. Unit is currently rented for $1100 and Market rent is $1250. HOA fee covers exterior Insurance and maintenance of Townhome.
Key facts
- $183 HOA
- Garage
- Built 1972
Property features AI
Finance
- Other: Approximately 0.13 acre lot; Two or more common walls
- HOA & community: Monthly HOA fee of $183 covering association, entrance/common area maintenance
Exterior
- Parking: Carport
- Utilities: Public water; Municipal sewer; Municipal solid waste service
- Home design: Attached residential condominium; Two levels; Horizontal condo (unit in a horizontal regime); Mandatory HOA membership
- Construction: Brick construction; Slab foundation
- Exterior features: Covered patio/porch
Interior
- Kitchen: Dishwasher; Microwave; Electric oven; Refrigerator; Gas water heater
- Bedrooms: Three bedrooms on the upper level
- Bathrooms: Two full bathrooms; One half bathroom (main level)
- Heating & cooling: Forced air heating (natural gas); Central air conditioning
- Interior features: Eat-in kitchen; Covered patio/porch
Neighborhood map
What this means for you Summary
Snapshot
- This is a 3-bed/2.5-bath condo listed at $115k.
Deal economics
- At list price, monthly cash flow is $215 ($3k/yr) — positive.
- The deal already cash-flows at list — no discount required.
- Meets the 1% rule at list price ($2k rent vs $115k).
- Cap rate 8.5% vs local median 4.4% in Indianapolis city (balance) — top-decile yield for the area; either an underpriced asset or a hidden risk that comps aren't pricing in. Stress-test before assuming the spread holds.
Location & tenants
- Location reads: area grade D — affects rentability + tenant quality, not the cash-flow math above.
- Indianapolis Public Schools (urban): math 14% / reading 20% proficiency, ranked #286 of 301 in IN (top 95%) — low school quality limits family demand, transient renter base, plan for 1-2y turnover; 77% free/reduced lunch — lower-income household profile, screen leases tightly.
- Market conditions: Rents rising fast (+4.1%/yr); 15 active listings in the ZIP; 14 comparable units currently listed for rent nearby; rentals at typical pace (median 21d on market — plan ~3-4 weeks tenant-placement turnaround); 1,906 units permitted in Marion County in 2024 (621 in 5+ unit buildings).
- This rent runs 31% of the median local income ($60k/yr) — at the standard rent-burdened threshold; future hikes will face affordability resistance.
Forward outlook
- Local home prices are declining (-3.0%/yr); year-one equity from $795 of loan paydown is wiped out by about $3k of value loss. Plan a longer hold.
- Marion County population projected at +18% by 2050 — long-run rental-demand tailwind backs the buy-and-hold thesis.
Negotiation context
- Only 5 days on market — expect competitive offers; lowballing is unlikely to land.
- 9 sale attempts since 23y ago with the ask held roughly flat each time — persistent listings suggest the price (not the market) is what's stuck; bring a comps-based counter.
- Current owner paid $92k; 25% above their basis — modest negotiation headroom, anchor on the comps not their cost.
Questions for the listing agent
- Built in 1972 — when were the roof, HVAC, electrical panel, plumbing, and water heater last replaced?
- What does the HOA fee cover, when was the last increase, and are there any pending special assessments or reserve-fund shortfalls?
- Any open or pending special assessments — roof, HVAC, plumbing, elevator, façade? What's the per-unit balance and payoff schedule, and is the seller paying it off at close or rolling it to the buyer?
- Is there a deadline driving the sale (1031 exchange, divorce, estate, relocation)? That informs how much negotiation room exists.
- The area grade is low — what's the realistic commute time and amenity access for the typical tenant pool here? Any planned neighborhood developments (good or bad) we should know about?
- What's the average days-on-market for RENTAL listings here right now (not sales)? A rising rental-DOM trend means longer vacancies and softer asking-rent achievability than the comps imply.
- What's the recent tenant-quality profile in this submarket — average credit score on applications, eviction rate, late-payment / NSF rate, and stable-employment percentage? A property-management company in the area should have these aggregated.
- How much new apartment / multifamily construction is in the pipeline within 1–3 miles? Heavy new supply (>2% of stock underway) typically softens rents 12–24 months out; light construction supports rent growth.
Investment metrics
- 1% rule
- 1.35% ✓
- Cap rate
- 8.54%
- Cash-on-cash
- 8.01%
- DSCR
- 1.36
- GRM
- 6.2
CMA / ARV
- ARV (median comp)
- $98,972
- List price
- $115,000
- Delta
- 16.19%
- Verdict
- OVERPRICED
- Comps
- 15 within 1.0 mi
Projected returns pro-forma
-3.0% appreciation · 4.13% rent growth · sell at horizon
- IRR
- -2.4%
- Equity multiple
- 0.91×
- Total profit
- $-3,001
- Equity at exit
- $17,147
- IRR
- 8.8%
- Equity multiple
- 1.72×
- Total profit
- $23,167
- Equity at exit
- $9,943
Cash invested: $32,200 (down + closing). Projections, not guarantees.
Landlord ↔ Tenant lean methodology
- Overall (STATE)
- 90 Strongly Landlord-Friendly
- State Indiana
- 90 Strongly Landlord-Friendly · R+11
- County
- — inherits STATE
- City
- — inherits STATE
ZIP-level market 46254
- Home prices YoY
- -33.6%
- Rents YoY
- 4.1%
- Active inventory
- 15
- Price-to-rent
- 6.2×
Monthly cashflow live
- Estimated rent
- $1,556 high interval (Pro) →
- Mortgage (P&I)
- −$603
- Tax from tax record
- −$180 /mo · $2,166/yr
- Insurance
- −$48
- HOA
- −$183
- Vacancy / Maint / Mgmt
- −$327
- Net cashflow
- $215
Break-even live
UW: 25.0% down · 7.5% · 30yr · 1.5% tax · 5.0% vac · 8.0% maint · 8.0% mgmt
Financing live
Cash to close
- Down payment
- $28,750
- Closing costs
- $3,450
- Reserves months
- —
- Total cash needed
- —
Loan-product check · same deal, 3 products live
Conventional
25% down · 7.5% · 30yr
- Down + closing
- —
- Monthly P&I
- —
- Monthly cashflow
- —
- DSCR
- —
- Eligible?
- —
Personal DTI + credit; lowest rate.
DSCR
20% down · 8.5% · 30yr
- Down + closing
- —
- Monthly P&I
- —
- Monthly cashflow
- —
- DSCR
- —
- Eligible?
- —
No personal income docs; deal must DSCR.
Hard money
10% down · 12.0% · 12mo
- Down + closing
- —
- Monthly P&I
- —
- Monthly cashflow
- —
- DSCR
- —
- Eligible?
- —
Short-term bridge; refi at stabilization.
Rent comps 14 comps
| Address | Beds | Baths | Sqft | Rent | $/sqft | DOM | Units | Dist |
|---|---|---|---|---|---|---|---|---|
| 6340 Commons Dr Indianapolis, IN | 3.0 | 2.5 | 1605 | $1,400 | $0.87 | 44d | 1 | 0.05mi |
| 6363 Commons Dr Indianapolis, IN | 1.0–3.0 | 1.0–2.0 | 966 | $1,440 | $1.49 | 3d | 13 | 0.13mi |
| 5801 Westhaven Dr Indianapolis, IN | 4.0 | 1.0 | 1102 | $1,300 | $1.18 | 24d | 1 | 0.70mi |
| 5801 Westhaven Dr Indianapolis, IN | 4.0 | 1.0 | 1102 | $1,300 | $1.18 | 44d | 1 | 0.70mi |
| 4366 Fullwood Ct Indianapolis, IN | 3.0 | 2.5 | 1936 | $2,005 | $1.04 | 8d | 1 | 0.80mi |
| 3636 Mission Dr Indianapolis, IN | 2.0 | 1.5 | 1100 | $1,225 | $1.11 | 44d | 1 | 0.88mi |
| 3636 Mission Dr Indianapolis, IN | 3.0 | 1.5 | 1200 | $1,415 | $1.18 | 24d | 1 | 0.88mi |
| 6243 Glen Flint Ct Indianapolis, IN | 3.0 | 2.5 | 1725 | $2,071 | $1.20 | 19d | 1 | 0.89mi |
| 6710 Hollow Run Pl Indianapolis, IN | 1.0–3.0 | 1.0–2.0 | 995 | $2,000 | $2.01 | 8d | 37 | 0.97mi |
| 5925 Sunwood Dr Indianapolis, IN | 3.0 | 1.0 | 1479 | $1,600 | $1.08 | 4d | 1 | 1.04mi |
| 5925 Sunwood Dr Indianapolis, IN | 3.0 | 1.0 | 1479 | $1,600 | $1.08 | 20d | 1 | 1.04mi |
| 5801 Sunwood Dr Indianapolis, IN | 4.0 | 2.0 | 1908 | $2,055 | $1.08 | 8d | 1 | 1.14mi |
| 5505 Scarlet Dr Indianapolis, IN | 3.0 | 1.0–1.5 | 883 | $1,549 | $1.75 | 2d | 4 | 1.29mi |
| 3226 Voigt Dr Indianapolis, IN | 3.0 | 1.5 | 1826 | $1,850 | $1.01 | 24d | 1 | 1.38mi |
HOA detail condo
- Monthly dues
- $183 · $2,196/yr
- Assessments
- None detected in remarks — confirm with the listing agent.
Listing history 20 events
-
2026-05-14$115,000 Active 519-char remark
-
2025-12-02historical $1,300
-
2025-09-17price $1,300
-
2025-08-27price $1,550
-
2025-08-22$1,525
-
2024-09-24historical $1,525
-
2024-07-19$1,525
-
2022-03-24soldstatus $92,000 Closed 161-char remark
Show marketing remark (161 chars)
3 Bedroom 2 full bath. Tenant Rights. Unit is currently rented for $1100 and Market rent is $1250. HOA fee covers exterior Insurance and maintenance of Townhome.
-
2022-03-04status Pending 161-char remark
Show marketing remark (161 chars)
3 Bedroom 2 full bath. Tenant Rights. Unit is currently rented for $1100 and Market rent is $1250. HOA fee covers exterior Insurance and maintenance of Townhome.
-
2022-02-23$95,000 Active 161-char remark
Show marketing remark (161 chars)
3 Bedroom 2 full bath. Tenant Rights. Unit is currently rented for $1100 and Market rent is $1250. HOA fee covers exterior Insurance and maintenance of Townhome.
-
2010-08-02historical
-
2010-02-01$50,000
-
2009-11-14historical
-
2009-08-13$57,900
-
2006-10-26soldstatus $48,000
-
2006-09-07$49,000
-
2005-09-22historical
-
2005-02-18$54,900
-
2003-12-31historical
-
2003-07-17$56,900
ⓘ Source: listings_history table (triggers on properties + properties_extension) + one-shot
backfill from property_details.listing_events for pre-trigger history.
Tax reassessment forecast IN · Partial reset (capped growth)
- Current annual tax
- $2,166 · $180/mo
- Projected year-2 tax
- $2,166 · $180/mo
- Expected delta
- $0/yr ($0/mo · 0.0%)
ⓘ Screening estimate from a state-policy table — verify with the county assessor before closing.
Climate risk First Street
- Flood 1/10 Low FEMA zone X (unshaded) · 0% chance over 30 yrs
- Wildfire 1/10 Low
- Heat 3/10 Moderate 7 d/yr ≥101°F today · 19 d/yr by 30 yrs out
- Wind 2/10 Low
- Air quality 4/10 Moderate 4 unhealthy d/yr today · 5 by 30 yrs out
Nearby sold comps map
Loading sold comps map…
Walkable amenities ~0.75 mi
Loading nearby amenities…
Taxation est. · year 1
- Rental income
- $18,674
- − Mortgage interest
- −$6,442
- − Property taxes
- −$2,166
- − Insurance
- −$575
- − Repairs & maintenance
- −$1,494
- − Management
- −$1,494
- − HOA
- −$2,196
- − Depreciation
- −$3,345
- Taxable income
- $962
- Est. tax owed @ 24.0%
- −$231
- After-tax cash flow
- $2,348/yr
For passive investors: Depreciation is non-cash, so a rental often shows a tax loss while cash-flowing — sheltering income. Rental losses are passive: they offset passive income freely, and up to $25,000/yr can offset ordinary (W-2) income if you actively participate and your MAGI is under $100k (phasing out to $0 by $150k); unused losses carry forward. On sale, claimed depreciation is recaptured at up to 25%, and gains may owe capital-gains tax (a 1031 exchange can defer both). Figures are a year-1 estimate at your 24.0% rate — not tax advice; consult a CPA.
Schools (NCES district)
- District
- Indianapolis Public Schools
- NCES district ID
- 1804770
- Math proficiency
- 14% ▼ -7.00%
- Reading proficiency
- 20% ▼ -3.00%
- Median HH income
- $32,034
- Composite
- 13.69/100
- National rank
- #9499
- State rank
- #286 of 301 in IN
Livability — Indianapolis city (balance)
No livability data for this city. (Only ~50 U.S. cities are tracked.)
Census & demographics
- Census place
- Indianapolis city (balance), IN
- County
- Marion County · 998,460 people
- City population
- 881,119
- Metro
- Indianapolis-Carmel-Anderson, IN
- Population (ZIP)
- 40,674
- Household income
- $60,287
- Rent vs Own
- Severe rent burden
- 1660.0
Population outlook (Marion County) Hauer SSP2
- Today (2025)
- 1,025,572 people
- By 2030
- 1,065,727 · +3.9%
- By 2040
- 1,141,577 · +11.3%
- By 2050
- 1,208,920 · +17.9%
- By 2075
- 1,367,288 · +33.3%
- By 2100
- 1,438,201 · +40.2%
Race, ethnicity, and origin ACS 2023
- Neighborhood character
- Diverse neighborhood (Simpson 0.61)
- Race & ethnicity
- Black 56% White 20% Hispanic / Latino 18% Two or more races 11% Asian 2%
- Hispanic origin (detail)
- Mexican 8% Puerto Rican 2% Dominican 2%
- Common ancestry
- Hispanic 3% Lithuanian 1% Italian 1%
- Foreign-born
- 23% · Canada, United Kingdom, Mexico
- Languages at home
- 75% English-only · Spanish 14% French/Haitian/Cajun 5% Other Indo-European 1%
Political lean MEDSL · Marion
- 2024 margin
- Strong D (+27.7) · D 63.0% · R 35.3% · Other 1.7%
- 2008→2024 swing
- -0.7pp no change · 2008: 28.4pp · 2024: 27.7pp
- All cycles
- 2024: D+27.7 2020: D+29.1 2016: D+22.8 2012: D+22.2 2008: D+28.4
Not yet ingested
- Civics
- —
Market trends
- HPI YoY
- ▼ -127.90%
- Current HPI
- 252.8994
- Rent YoY
- ▲ 4.13%
- Metro
- Indianapolis-Carmel-Anderson, IN
- State GDP YoY
- ▲ 2.90%
- F500 in state
- 18
Industry mix (Fortune 500 HQ in IN)
| Industry | F500 HQs | Revenue |
|---|---|---|
| Industrial Machinery | 2 | $37B |
|
||
| Healthcare | 1 | $177B |
|
||
| Pharmaceuticals | 1 | $45B |
|
||
| Metals / Steel | 1 | $18B |
|
||
| Agriculture | 1 | $17B |
|
||
| Packaging | 1 | $12B |
|
||
Price history
+102.1% since first listed21 events — show timeline
- 2026-05-19 Pending — MIBOR as Distributed by MLS Grid
- 2026-05-14 Listed $115,000 MIBOR as Distributed by MLS Grid
- 2025-12-02 Rental Removed $1,300 MIBOR
- 2025-09-17 Price Changed $1,300 MIBOR
- 2025-08-27 Price Changed $1,550 MIBOR
- 2025-08-22 Listed for Rent $1,525 MIBOR
- 2024-09-24 Rental Removed $1,525 MIBOR
- 2024-07-19 Listed for Rent $1,525 MIBOR
- 2022-03-24 Sold (MLS) $92,000 MIBOR as Distributed by MLS Grid
- 2022-03-04 Pending — MIBOR as Distributed by MLS Grid
- 2022-02-23 Listed $95,000 MIBOR as Distributed by MLS Grid
- 2010-08-02 Listing Removed — MIBOR as Distributed by MLS Grid
- 2010-02-01 Listed $50,000 MIBOR as Distributed by MLS Grid
- 2009-11-14 Listing Removed — MIBOR as Distributed by MLS Grid
- 2009-08-13 Listed $57,900 MIBOR as Distributed by MLS Grid
- 2006-10-26 Sold (MLS) $48,000 MIBOR as Distributed by MLS Grid
- 2006-09-07 Listed $49,000 MIBOR as Distributed by MLS Grid
- 2005-09-22 Listing Removed — MIBOR as Distributed by MLS Grid
- 2005-02-18 Listed $54,900 MIBOR as Distributed by MLS Grid
- 2003-12-31 Listing Removed — MIBOR as Distributed by MLS Grid
- 2003-07-17 Listed $56,900 MIBOR as Distributed by MLS Grid
Property tax history
+6.4%/yrLatest (2025): $2,166 · -12.0% YoY. Source: county tax records.
Cash-flow waterfall
monthlySold comps — $/sqft
last 12 mo · ≤1 miLoading sold comps…