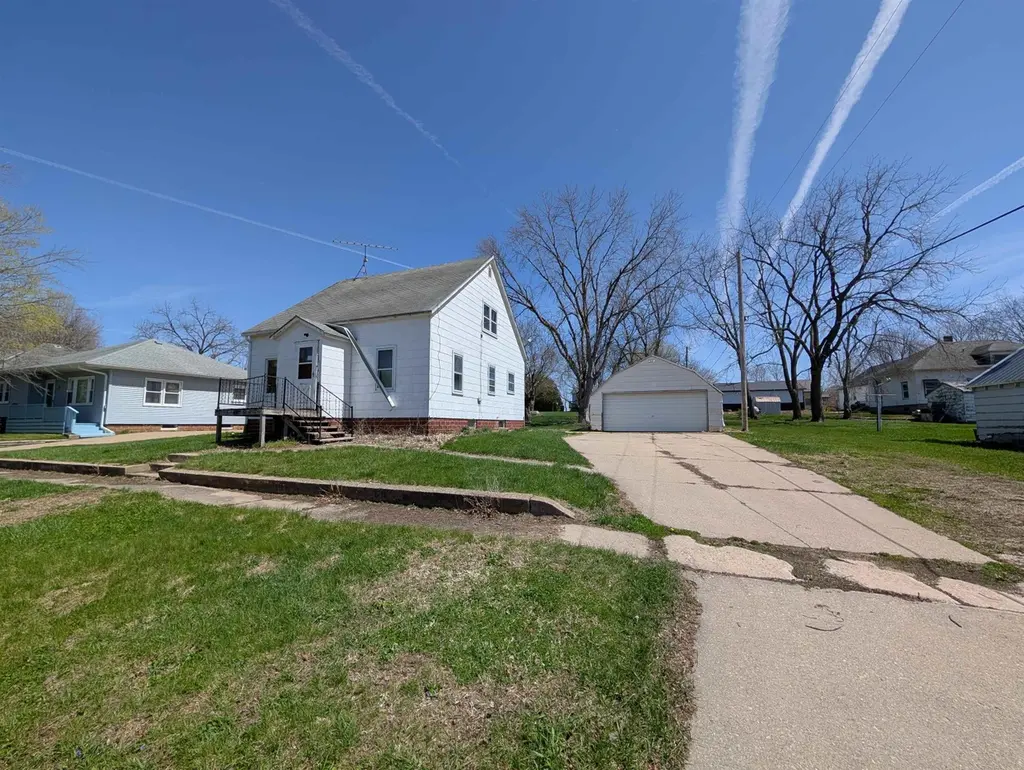
205 N Lincoln Ave · Alta Vista, IA
Flood risk 1/10 · Minimal
- FEMA flood zone
- X (unshaded)
- Chance of flooding over 30 yrs
- 0.0%
- Est. flood insurance / yr
- $473 – $860
Fire risk 3/10 · Minor
- Est. fire insurance / yr
- $902 – $1,676
Heat risk 2/10 · Minimal
- Hot days now (above 99°F)
- 7 days/yr
- Hot days in 30 yrs
- 16 days/yr
Wind risk 2/10 · Minimal
- Chance of severe wind over 30 yrs
- —
Air-quality risk 1/10 · Minimal
- Unhealthy air days now
- 0 days/yr
- Unhealthy air days in 30 yrs
- 0 days/yr
Risk factors via First Street. Map © Google.
Why this score? — see what drove the B+ grade
The composite is a weighted blend of 9 inputs, each scored 0–100. Each bar is that input's sub-score; the figure is the points it added to the 100-point composite (weight × sub-score).
- Cash flow +30.0/30.0
- DSCR +10.0/10.0
- 1% rule +8.9/10.0
- ARV discount +7.5/15.0
- Schools +6.3/10.0
- Appreciation +5.6/10.0
- Livability +3.2/5.0
- Rent growth +2.5/5.0
- Condition / age +2.5/5.0
$75,000
🖨 Deal sheet 📄 Offer letter ✓ Due diligence
Listing remarks
Cozy home in a quiet rural community. This home features hardwood floors and original woodwork. On the main floor you will find an eat-in kitchen, spacious living room, one bedroom and a full bath. Upstairs are there are two good size bedrooms. The lower level offers laundry, half bath and plenty of storage space. A two car detached garage is located south of the home. The back yard offers privacy and plenty of space for outdoor activities. SELLER CHOICE OF SERVICES", "BRING ALL OFFERS", "SOLD AS-IS: SELLER WILL NOT MAKE ANY REPAIRS OR PAY FOR OR PROVIDE ANY REPORTS" AND "ALL OFFERS MUST BE WRITTEN ON STATE FORM ONLY"
Key facts
- 9,240 sq ft lot
- Garage
- Built 1954
Property features AI
Exterior
- Parking: Detached carport; 2 carport spaces
- Utilities: Public water; Public sewer
- Home design: Residential single-family home; Zoned R-1
- Construction: Slate and asphalt roof
- Exterior features: Concrete road surface
Interior
- Bathrooms: 1 full bathroom; 1 half bathroom
- Heating & cooling: Baseboard heating; Steam heating; Propane heating; No central air
- Interior features: Basement with block construction, unfinished; No fireplace
Neighborhood map
What this means for you Summary
Snapshot
- This is a 3-bed/1.5-bath single-family listed at $75k.
Deal economics
- At list price, monthly cash flow is $332 ($4k/yr) — positive.
- The deal already cash-flows at list — no discount required.
- Meets the 1% rule at list price ($1k rent vs $75k).
- Recommended offer: $74k (1.5% below list) — sets the bar for market timing.
Location & tenants
- Location reads 65/100 on livability (#573 in IA) — a middle-class / working-renter tenant base. Strengths: cost of living A+, housing A+; Watch: health & safety C-, amenities F, commute F.
- New Hampton Community School District (town): math 76% / reading 73% proficiency, ranked #84 of 289 in IA (top 29%) — strong family-tenant draw, lease renewals of 3-5y typical.
- Zoned schools: New Hampton Elementary School (math 67% / reading 52%, grade B-, #390 of 616 statewide, top 69%, 401 students, 33% FRL); New Hampton Middle School (math 83% / reading 76%, grade A+, #35 of 246 statewide, top 16%, 279 students, 34% FRL); New Hampton High School (math 75% / reading 79%, grade A-, #60 of 336 statewide, top 21%, 339 students, 28% FRL).
- Market conditions: 2 active listings in the ZIP; 6 units permitted in Chickasaw County in 2024 (0 in 5+ unit buildings).
Forward outlook
- In year one you build about $1k of equity ($519 loan paydown + $962 appreciation (1.3% local appreciation)).
- Chickasaw County population projected at -13% by 2050 — secular population decline; favor cash flow + early exit over multi-decade hold.
- At projected returns (1.3% appreciation + 3.0% rent growth), your $21k cash investment doubles in ~4 years — after that, you're playing with house money.
Negotiation context
- It's been on market 27 days — a 2% lower offer ($74k) is reasonable based on typical stale-listing flexibility.
- Current owner paid $58k; 29% above their basis — modest negotiation headroom, anchor on the comps not their cost.
Risks & watch-outs
- Watch-outs: built in 1954 — expect roof / HVAC / electrical / plumbing capex.
Questions for the listing agent
- Built in 1954 — when were the roof, HVAC, electrical panel, plumbing, and water heater last replaced?
- Is there a deadline driving the sale (1031 exchange, divorce, estate, relocation)? That informs how much negotiation room exists.
- Schools are D-rated, which usually means shorter tenancies and higher turnover. Who's the typical renter profile here, and what's been the actual vacancy rate?
- What's the average days-on-market for RENTAL listings here right now (not sales)? A rising rental-DOM trend means longer vacancies and softer asking-rent achievability than the comps imply.
- What's the recent tenant-quality profile in this submarket — average credit score on applications, eviction rate, late-payment / NSF rate, and stable-employment percentage? A property-management company in the area should have these aggregated.
- How much new for-sale + rental construction is in the pipeline within 1–3 miles? Heavy new supply typically softens prices + rents 12–24 months out; constrained supply supports both.
Investment metrics
- 1% rule
- 1.39% ✓
- Cap rate
- 11.60%
- Cash-on-cash
- 18.94%
- DSCR
- 1.84
- GRM
- 6.0
CMA / ARV
No comps found within radius.
Projected returns pro-forma
1.28% appreciation · 3.0% rent growth · sell at horizon
- IRR
- 21.6%
- Equity multiple
- 2.12×
- Total profit
- $23,555
- Equity at exit
- $26,711
- IRR
- 24.3%
- Equity multiple
- 4.00×
- Total profit
- $63,074
- Equity at exit
- $36,369
Cash invested: $21,000 (down + closing). Projections, not guarantees.
Landlord ↔ Tenant lean methodology
- Overall (STATE)
- 83 Strongly Landlord-Friendly
- State Iowa
- 83 Strongly Landlord-Friendly · R+6
- County
- — inherits STATE
- City
- — inherits STATE
ZIP-level market 50603
- Home prices YoY
- 1.1%
- Active inventory
- 2
- Price-to-rent
- 6.0×
Monthly cashflow live
- Estimated rent
- $1,041 medium interval (Pro) →
- Mortgage (P&I)
- −$393
- Tax from tax record
- −$66 /mo · $792/yr
- Insurance
- −$31
- HOA
- −$0
- Vacancy / Maint / Mgmt
- −$219
- Net cashflow
- $332
Break-even live
UW: 25.0% down · 7.5% · 30yr · 1.5% tax · 5.0% vac · 8.0% maint · 8.0% mgmt
Financing live
Cash to close
- Down payment
- $18,750
- Closing costs
- $2,250
- Reserves months
- —
- Total cash needed
- —
Loan-product check · same deal, 3 products live
Conventional
25% down · 7.5% · 30yr
- Down + closing
- —
- Monthly P&I
- —
- Monthly cashflow
- —
- DSCR
- —
- Eligible?
- —
Personal DTI + credit; lowest rate.
DSCR
20% down · 8.5% · 30yr
- Down + closing
- —
- Monthly P&I
- —
- Monthly cashflow
- —
- DSCR
- —
- Eligible?
- —
No personal income docs; deal must DSCR.
Hard money
10% down · 12.0% · 12mo
- Down + closing
- —
- Monthly P&I
- —
- Monthly cashflow
- —
- DSCR
- —
- Eligible?
- —
Short-term bridge; refi at stabilization.
Listing history 2 events
-
2026-04-23$75,000 Active 661-char remark
-
2021-10-06soldstatus $58,000
ⓘ Source: listings_history table (triggers on properties + properties_extension) + one-shot
backfill from property_details.listing_events for pre-trigger history.
Tax reassessment forecast IA · Partial reset (capped growth)
- Current annual tax
- $792 · $66/mo
- Projected year-2 tax
- $985 · $82/mo
- Expected delta
- +$193/yr (+$16/mo · 24.3%)
ⓘ Screening estimate from a state-policy table — verify with the county assessor before closing.
Climate risk First Street
- Flood 1/10 Low FEMA zone X (unshaded) · 0% chance over 30 yrs
- Wildfire 3/10 Moderate
- Heat 2/10 Low 7 d/yr ≥99°F today · 16 d/yr by 30 yrs out
- Wind 2/10 Low
- Air quality 1/10 Low 0 unhealthy d/yr today · 0 by 30 yrs out
Nearby sold comps map
Loading sold comps map…
Walkable amenities ~0.75 mi
Loading nearby amenities…
Taxation est. · year 1
- Rental income
- $12,487
- − Mortgage interest
- −$4,201
- − Property taxes
- −$792
- − Insurance
- −$375
- − Repairs & maintenance
- −$999
- − Management
- −$999
- − Depreciation
- −$2,182
- Taxable income
- $2,939
- Est. tax owed @ 24.0%
- −$705
- After-tax cash flow
- $3,273/yr
For passive investors: Depreciation is non-cash, so a rental often shows a tax loss while cash-flowing — sheltering income. Rental losses are passive: they offset passive income freely, and up to $25,000/yr can offset ordinary (W-2) income if you actively participate and your MAGI is under $100k (phasing out to $0 by $150k); unused losses carry forward. On sale, claimed depreciation is recaptured at up to 25%, and gains may owe capital-gains tax (a 1031 exchange can defer both). Figures are a year-1 estimate at your 24.0% rate — not tax advice; consult a CPA.
Schools (NCES district)
- District
- New Hampton Community School District
- NCES district ID
- 1920340
- Math proficiency
- 76% ▼ -4.00%
- Reading proficiency
- 73% ▲ 3.00%
- Median HH income
- $46,395
- Composite
- 62.78/100
- National rank
- #668
- State rank
- #84 of 289 in IA
Livability — Alta Vista
- Score
- 65/100
- State rank
- #573
- US rank
- #13005
Category grades
Schools grade is shown separately in the Schools card above.
Census & demographics
- Census place
- Alta Vista, IA
- Population (ZIP)
- 410
Population outlook (Chickasaw County) Hauer SSP2
- Today (2025)
- 11,503 people
- By 2030
- 11,187 · -2.7%
- By 2040
- 10,569 · -8.1%
- By 2050
- 9,997 · -13.1%
- By 2075
- 8,819 · -23.3%
- By 2100
- 7,126 · -38.1%
Race, ethnicity, and origin ACS 2023
- Neighborhood character
- Predominantly White (100%)
- Race & ethnicity
- White 100%
- Common ancestry
- Portuguese 4%
- Foreign-born
- 0% · Canada
Political lean MEDSL · Chickasaw
- 2024 margin
- Solid R (+37.2) · D 30.8% · R 68.0% · Other 1.2%
- 2008→2024 swing
- -57.9pp toward R · 2008: 20.8pp · 2024: -37.2pp
- All cycles
- 2024: R+37.2 2020: R+31.3 2016: R+23.2 2012: D+11.1 2008: D+20.8
Not yet ingested
- Civics
- —
Market trends
- HPI YoY
- ▲ 1.28%
- Current HPI
- 113.5863
- Rent YoY
- —
- Metro
- —
- State GDP YoY
- ▲ 2.48%
- F500 in state
- 4
Industry mix (Fortune 500 HQ in IA)
| Industry | F500 HQs | Revenue |
|---|---|---|
| Financial Services | 1 | $16B |
|
||
| Retail / Convenience | 1 | $15B |
|
||
Price history
+29.3% since first listed3 events — show timeline
- 2026-05-20 Pending — NEIRBR as distributed by MLS GRID
- 2026-04-23 Listed $75,000 NEIRBR as distributed by MLS GRID
- 2021-10-06 Sold (Public Records) $58,000 Public Records
Property tax history
+5.7%/yrLatest (2025): $792 · +5.6% YoY. Source: county tax records.
Cash-flow waterfall
monthlySold comps — $/sqft
last 12 mo · ≤1 miLoading sold comps…