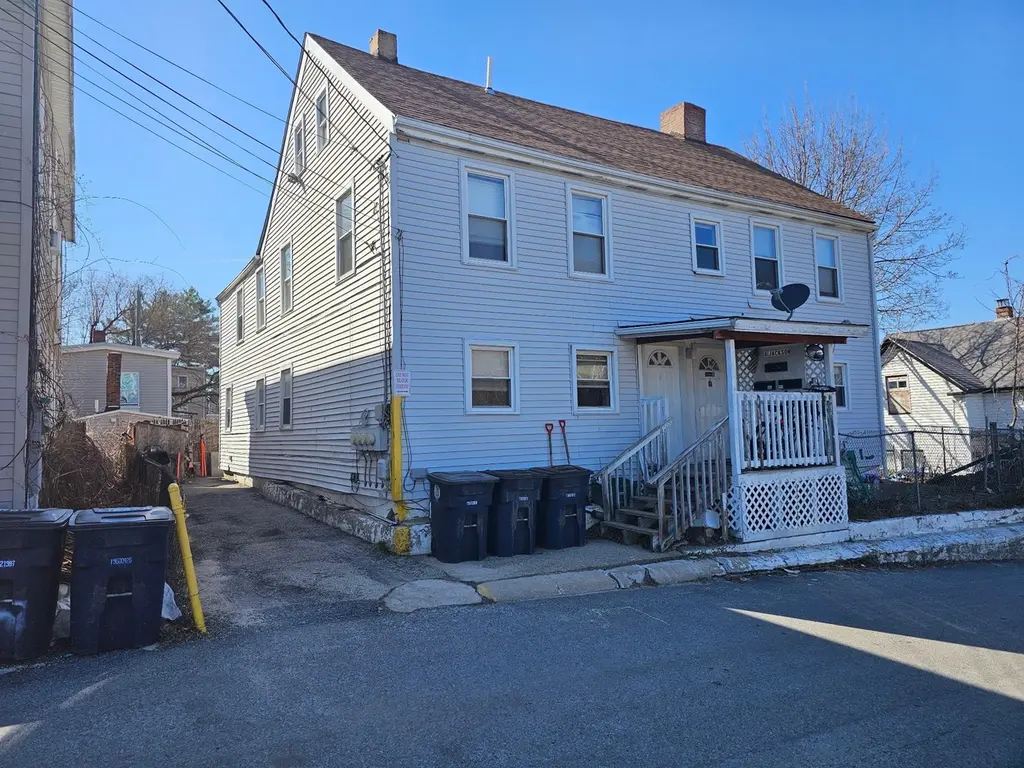
 Triplex
8A & 8B Jackson St · Nashua, NH
Flood risk 8/10 · Major
- FEMA flood zone
- X
- Chance of flooding over 30 yrs
- 0.93%
- Est. flood insurance / yr
- $473 – $860
Fire risk 1/10 · Minimal
- Est. fire insurance / yr
- $507 – $941
Heat risk 5/10 · Moderate
- Hot days now (above 96°F)
- 7 days/yr
- Hot days in 30 yrs
- 16 days/yr
Wind risk 6/10 · Moderate
- Chance of severe wind over 30 yrs
- 27.0%
Air-quality risk 2/10 · Minimal
- Unhealthy air days now
- 1 days/yr
- Unhealthy air days in 30 yrs
- 2 days/yr
Risk factors via First Street. Map © Google.
Why this score? — see what drove the B- grade
The composite is a weighted blend of 9 inputs, each scored 0–100. Each bar is that input's sub-score; the figure is the points it added to the 100-point composite (weight × sub-score).
- Cash flow +26.7/30.0
- ARV discount +11.1/15.0
- DSCR +9.2/10.0
- 1% rule +7.2/10.0
- Livability +4.2/5.0
- Rent growth +3.3/5.0
- Schools +3.1/10.0
- Condition / age +2.2/5.0
- Appreciation +0.0/10.0
$525,000
🖨 Deal sheet (PDF) 📄 Offer letter ✓ Due diligence
Multi-family units
County records classify this as Multi-Family (2-4 Unit). Listing-text estimate: 3 units. confirmed
Listing remarks MLS
3 Unit multi family next to Merrimack's Farmer's Exchange on Bridge St. - there are 3- 2 bedroom units - 1 unit on 1st flr, 1 unit on 2nd flr & 1 unit townhouse with access to large attic & work space along with basement access. Only 3-4 properties on narrow road. Property has a community deck and small side yard area. Rents are below market value. Tenants pay utilities. Landlord pays water & sewer. Easy access and walking distance to all downtown amenities. 24-48 hours to show. OPEN HOUSE WEDNESDAY 4/15/26 2-4 p. m.
Key facts
- Basement access
- Work space
- Community deck
Tags
Neighborhood map
What this means for you Summary
Snapshot
- This is a 3 × 2-bed/1-bath units multifamily listed at $525k. Condition is rated fair.
Deal economics
- At list price, monthly cash flow is $1k ($16k/yr) — positive. Per door: $457/mo.
- The deal already cash-flows at list — no discount required.
- Meets the 1% rule at list price ($6k rent vs $525k).
- Recommended offer: $494k (6.0% below list) — sets the bar for market timing.
- Cap rate 9.6% vs local median 2.9% in Nashua — top-decile yield for the area; either an underpriced asset or a hidden risk that comps aren't pricing in. Stress-test before assuming the spread holds.
Location & tenants
- Location reads 83/100 on livability (#11 in NH, #983 nationally) — a professional / high-income tenant draw. Strengths: commute A+, housing A+, health & safety A+; Watch: amenities D+.
- Nashua School District (urban): math 27% / reading 40% proficiency, ranked #77 of 98 in NH (top 79%) — families likely to look elsewhere, expect single-tenant / working-renter base with shorter leases.
- Market conditions: Rents rising (+3.1%/yr); 50 active listings in the ZIP; 1 comparable units currently listed for rent nearby; solid renter incomes; 981 units permitted in Hillsborough County in 2024 (381 in 5+ unit buildings).
- At $6,400/mo this rent would consume 96% of the median local household income ($80k/yr) (locally 1823% of renters already pay >50% of income on rent) — very limited rent-growth headroom before tenants either downsize or default.
Forward outlook
- Local home prices are declining (-3.0%/yr); year-one equity from $4k of loan paydown is wiped out by about $16k of value loss. Plan a longer hold.
- Hillsborough County population projected to shrink 8% by 2050 — rents likely to lag national; underwrite the cash flow, not the appreciation.
- At projected returns (-3.0% appreciation + 3.1% rent growth), your $147k cash investment doubles in ~10 years — after that, you're playing with house money.
Negotiation context
- It's been on market 62 days — a 6% lower offer ($494k) is reasonable based on typical stale-listing flexibility.
Risks & watch-outs
- Watch-outs: flood insurance adds $56/mo; built in 1900 — expect roof / HVAC / electrical / plumbing capex.
- Climate carrying-cost: severe flood risk; major wind risk, 27% chance of damaging wind over 30y; extreme-heat days projected 7→16/yr by 2055 (HVAC capex compounding) — expect insurance premiums to compound above CPI over the hold.
Questions for the listing agent
- It's been on market 62 days. Have you received any prior offers? Is the seller open to a 6% concession, seller financing, or rate buy-down credit?
- Can we see the unit-by-unit rent roll, current vacancy, and any below-market leases? What's the average tenancy length?
- What capital expenditures (roof, boiler, parking lot, exteriors) have been made in the last 5 years, and what's planned in the next 2?
- Have any recent inspections been done? Can we get a copy of the seller's disclosures and any deferred-maintenance estimates?
- Built in 1900 — when were the roof, HVAC, electrical panel, plumbing, and water heater last replaced?
- What's the actual annual flood-insurance premium (NFIP or private), and is the property in a SFHA with mandatory coverage?
- Why hasn't it sold? Are there any deal-killer items the seller is aware of (foundation, flood, title, zoning, code violations)?
- Is there a deadline driving the sale (1031 exchange, divorce, estate, relocation)? That informs how much negotiation room exists.
- Schools are B-rated — typically a magnet for longer-tenancy family renters. What's the average tenant stay here, and is there a school-zone premium baked into asking?
- What's the average days-on-market for RENTAL listings here right now (not sales)? A rising rental-DOM trend means longer vacancies and softer asking-rent achievability than the comps imply.
- What's the recent tenant-quality profile in this submarket — average credit score on applications, eviction rate, late-payment / NSF rate, and stable-employment percentage? A property-management company in the area should have these aggregated.
- How much new apartment / multifamily construction is in the pipeline within 1–3 miles? Heavy new supply (>2% of stock underway) typically softens rents 12–24 months out; light construction supports rent growth.
Investment metrics
- 1% rule
- 1.22% ✓
- Cap rate
- 9.56%
- Cash-on-cash
- 11.66%
- DSCR
- 1.52
- GRM
- 6.8
CMA / ARV
- ARV (median comp)
- $571,186
- List price
- $525,000
- Delta
- -8.09%
- Verdict
- FAIR
- Comps
- 20 within 1.0 mi
Show comp detail 12 sales within ~0.75 mi
| Address | Dist | Beds/Ba | Sqft | Sold | Price | $/sf | Match |
|---|---|---|---|---|---|---|---|
| 23 Harvard St | 0.36mi | 5/2.0 | 2,829 (-3%) | 0mo | $425,000 | $150 | 58 |
| 9-11 Mason St | 0.50mi | 6/2.0 | 2,916 (-0%) | 3mo | $580,000 | $199 | 54 |
| 48 Temple St | 0.54mi | —/— | 2,613 (-11%) | 11mo | $675,000 | $258 | 48 |
| 64 Bowers St | 0.57mi | 6/3.0 | 2,947 (+1%) | 5mo | $640,000 | $217 | 48 |
| 6 Holmes St | 0.52mi | 6/2.0 | 2,836 (-3%) | 11mo | $499,000 | $176 | 42 |
| 7 Lessard St | 0.46mi | 5/4.0 | 3,076 (+5%) | 15mo | $625,000 | $203 | 38 |
| 3-5 Howard St | 0.32mi | 5/3.0 | 2,560 (-12%) | 9mo | $575,000 | $225 | 37 |
| 41-43 WILLIAMS St | 0.55mi | 8/4.0 | 3,138 (+7%) | 8mo | $649,000 | $207 | 36 |
| 84 Bowers St | 0.51mi | 6/2.0 | 2,536 (-13%) | 4mo | $600,000 | $237 | 31 |
| 16 Ridge St | 0.44mi | 6/2.0 | 2,595 (-11%) | 13mo | $540,000 | $208 | 30 |
| 6-12 Williams Ct | 0.41mi | —/4.0 | 2,496 (-15%) | 13mo | $500,000 | $200 | 26 |
| 30 Shattuck St | 0.58mi | 7/2.0 | 2,585 (-12%) | 14mo | $710,000 | $275 | 22 |
Match score weights: distance 35% · size 25% · config 20% · recency 20%. Top-matched comps best support the ARV.
Projected returns pro-forma
-3.0% appreciation · 3.11% rent growth · sell at horizon
- IRR
- 0.6%
- Equity multiple
- 1.02×
- Total profit
- $3,170
- Equity at exit
- $78,279
- IRR
- 10.3%
- Equity multiple
- 1.81×
- Total profit
- $118,752
- Equity at exit
- $45,392
Cash invested: $147,000 (down + closing). Projections, not guarantees.
Landlord ↔ Tenant lean methodology
- Overall (STATE)
- 56 Moderately Landlord-Leaning
- State New Hampshire
- 56 Moderately Landlord-Leaning · D+1
- County
- — inherits STATE
- City
- — inherits STATE
ZIP-level market 03060
- Home prices YoY
- -27.6%
- Rents YoY
- 3.1%
- Active inventory
- 50
- Price-to-rent
- 20.5×
Monthly cashflow live
- Estimated rent
- $6,400 high interval (Pro) →
- Mortgage (P&I)
- −$2,753
- Tax est. 1.5%
- −$656 /mo · $7,875/yr
- Insurance
- −$219
- Flood insurance flood zone
- −$56 /mo · $666/yr
- HOA
- −$0
- Vacancy / Maint / Mgmt
- −$1,344
- Net cashflow
- $1,372
Break-even live
Sensitivity live
| Price | -10% $1,735 | -5% $1,554 | +0% $1,372 | +5% $1,191 | +10% $1,009 |
|---|---|---|---|---|---|
| Rent | -10% $867 | -5% $1,120 | +0% $1,372 | +5% $1,625 | +10% $1,878 |
| Rate | -1.0pp $1,637 | -0.5pp $1,506 | base $1,372 | +0.5pp $1,236 | +1.0pp $1,098 |
3-unit breakdown (identical units grouped — click to expand)
| Units | Beds | Baths | Est. rent |
|---|---|---|---|
| 3× units | 2 | 1 | $6,399 |
| #1 | 2 | 1 | $2,133 |
| #2 | 2 | 1 | $2,133 |
| #3 | 2 | 1 | $2,133 |
| Total (3 units) | $6,400 | ||
UW: 25.0% down · 7.5% · 30yr · 1.5% tax · 5.0% vac · 8.0% maint · 8.0% mgmt
Financing live
Cash to close
- Down payment
- $131,250
- Closing costs
- $15,750
- Reserves months
- —
- Total cash needed
- —
Loan-product check · same deal, 3 products live
Conventional
25% down · 7.5% · 30yr
- Down + closing
- —
- Monthly P&I
- —
- Monthly cashflow
- —
- DSCR
- —
- Eligible?
- —
Personal DTI + credit; lowest rate.
DSCR
20% down · 8.5% · 30yr
- Down + closing
- —
- Monthly P&I
- —
- Monthly cashflow
- —
- DSCR
- —
- Eligible?
- —
No personal income docs; deal must DSCR.
Hard money
10% down · 12.0% · 12mo
- Down + closing
- —
- Monthly P&I
- —
- Monthly cashflow
- —
- DSCR
- —
- Eligible?
- —
Short-term bridge; refi at stabilization.
Rent comps 1 comps
| Address | Beds | Baths | Sqft | Rent | $/sqft | DOM | Units | Dist |
|---|---|---|---|---|---|---|---|---|
| 26 Ledge St Unit 26B Nashua, NH | 2.0 | 1.0 | 4000 | $1,650 | $0.41 | 22d | 1 | 1.19mi |
Listing history 11 events
-
2026-06-14statusdays on market $525,000 Pending 62 DOM
-
2026-06-10days on market $525,000 Active 61 DOM
-
2026-06-09days on market $525,000 Active 60 DOM
-
2026-06-08days on market $525,000 Active 59 DOM
-
2026-06-07days on market $525,000 Active 58 DOM
-
2026-06-03days on market $525,000 Active 54 DOM
-
2026-06-02days on market $525,000 Active 53 DOM
-
2026-06-01days on market $525,000 Active 52 DOM
-
2026-05-31days on market $525,000 Active 51 DOM
-
2026-05-30days on market $525,000 Active 50 DOM
-
2026-04-10$525,000 Active 541-char remark
Show marketing remark (541 chars)
3 Unit multi family next to Merrimack's Farmer's Exchange on Bridge St. - there are 3- 2 bedroom units - 1 unit on 1st flr, 1 unit on 2nd flr & 1 unit townhouse with access to large attic & work space along with basement access. Only 3-4 properties on narrow road. Property has a community deck and small side yard area. Rents are below market value. Tenants pay utilities. Landlord pays water & sewer. Easy access and walking distance to all downtown amenities. 24-48 hours to show. OPEN HOUSE WEDNESDAY 4/15/26 2-4 p. m.
ⓘ Source: listings_history table (triggers on properties + properties_extension) + one-shot
backfill from property_details.listing_events for pre-trigger history.
Climate risk First Street
- Flood 8/10 Severe FEMA zone X · 93% chance over 30 yrs
- Wildfire 1/10 Low
- Heat 5/10 Major 7 d/yr ≥96°F today · 16 d/yr by 30 yrs out
- Wind 6/10 Major 27% chance of damaging wind over 30 yrs
- Air quality 2/10 Low 1 unhealthy d/yr today · 2 by 30 yrs out
Nearby sold comps map
Loading sold comps map…
Walkable amenities ~0.75 mi
Loading nearby amenities…
Taxation est. · year 1
- Rental income
- $76,800
- − Mortgage interest
- −$29,408
- − Property taxes
- −$7,875
- − Insurance
- −$3,292
- − Repairs & maintenance
- −$6,144
- − Management
- −$6,144
- − Depreciation
- −$15,273
- Taxable income
- $8,665
- Est. tax owed @ 24.0%
- −$2,080
- After-tax cash flow
- $14,388/yr
For passive investors: Depreciation is non-cash, so a rental often shows a tax loss while cash-flowing — sheltering income. Rental losses are passive: they offset passive income freely, and up to $25,000/yr can offset ordinary (W-2) income if you actively participate and your MAGI is under $100k (phasing out to $0 by $150k); unused losses carry forward. On sale, claimed depreciation is recaptured at up to 25%, and gains may owe capital-gains tax (a 1031 exchange can defer both). Figures are a year-1 estimate at your 24.0% rate — not tax advice; consult a CPA.
Condition & rehab AI · 2 photos
This 3-unit multi-family property requires moderate renovations, focusing on exterior siding, flooring, and interior walls. Paint and carpet replacements would significantly boost its resale and rental value.
Repairs flagged
- Major exterior siding — Significant wear and tear
- Major flooring — Worn-out carpet
- Major interior walls — Peeling paint
Value-add opportunities
- Both paint exterior — Enhances curb appeal and value
- Both replace carpet — Improves living space and rental appeal
Renovation cost estimate screening
| Repair item | Severity | Est. cost |
|---|---|---|
| exterior siding · Significant wear and tear | Major | $15,000–50,000 |
| flooring · Worn-out carpet | Major | $15,000–50,000 |
| interior walls · Peeling paint | Major | $15,000–50,000 |
| Total estimated repair cost · 3 items | $45,000–150,000 |
Value-add ROI direction
- Both paint exterior — Enhances curb appeal and value ↑
- Both replace carpet — Improves living space and rental appeal ↑
ⓘ Cost ranges are severity-bucket heuristics (US national rule-of-thumb). Get contractor quotes + a written scope before underwriting a rehab budget.
Schools (NCES district)
- District
- Nashua School District
- NCES district ID
- 3304980
- Math proficiency
- 27% ▼ -12.00%
- Reading proficiency
- 40% ▼ -6.00%
- Median HH income
- $66,393
- Composite
- 30.62/100
- National rank
- #6189
- State rank
- #77 of 98 in NH
Livability — Nashua
- Score
- 83/100
- State rank
- #11
- US rank
- #983
Category grades
Schools grade is shown separately in the Schools card above.
Census & demographics
- Census place
- Nashua, NH
- County
- Hillsborough County · 309,362 people
- City population
- 91,294
- Metro
- Manchester-Nashua, NH
- Population (ZIP)
- 31,657
- Household income
- $79,855
- Rent vs Own
- Severe rent burden
- 1823.0
Population outlook (Hillsborough County) Hauer SSP2
- Today (2025)
- 412,771 people
- By 2030
- 410,974 · -0.4%
- By 2040
- 399,959 · -3.1%
- By 2050
- 381,542 · -7.6%
- By 2075
- 339,855 · -17.7%
- By 2100
- 289,270 · -29.9%
Race, ethnicity, and origin ACS 2023
- Neighborhood character
- Predominantly White (65%)
- Race & ethnicity
- White 65% Hispanic / Latino 24% Two or more races 16% Asian 4% Black 2%
- Hispanic origin (detail)
- Mexican 6% Puerto Rican 7% Dominican 7%
- Common ancestry
- Lithuanian 8% Romanian 3% Russian 2%
- Foreign-born
- 19% · Canada, Jamaica, China
- Languages at home
- 73% English-only · Spanish 19% Other Indo-European 3% French/Haitian/Cajun 1%
Political lean MEDSL · Hillsborough
- 2024 margin
- Toss-up / Even · D 50.9% · R 48.0% · Other 1.0%
- 2008→2024 swing
- -0.9pp no change · 2008: 3.8pp · 2024: 2.9pp
- All cycles
- 2024: D+2.9 2020: D+7.7 2016: R+0.2 2012: D+1.7 2008: D+3.8
Not yet ingested
- Civics
- —
Market trends
- HPI YoY
- ▼ -130.94%
- Current HPI
- 342.7565
- Rent YoY
- ▲ 3.11%
- Metro
- Manchester-Nashua, NH
- State GDP YoY
- —
- F500 in state
- 0
Price history
1 event — show timeline
- 2026-04-10 Listed $525,000 PrimeMLS
Cash-flow waterfall
monthlySold comps — $/sqft
last 12 mo · ≤1 miLoading sold comps…