57 Sampson Rd · Hemingway, SC
Flood risk 1/10 · Minimal
- FEMA flood zone
- X (unshaded)
- Chance of flooding over 30 yrs
- 0.0%
- Est. flood insurance / yr
- $507 – $1,088
Fire risk 6/10 · Moderate
- Est. fire insurance / yr
- $783 – $1,453
Heat risk 8/10 · Major
- Hot days now (above 108°F)
- 7 days/yr
- Hot days in 30 yrs
- 16 days/yr
Wind risk 8/10 · Major
- Chance of severe wind over 30 yrs
- 80.0%
Air-quality risk 2/10 · Minimal
- Unhealthy air days now
- 2 days/yr
- Unhealthy air days in 30 yrs
- 2 days/yr
Risk factors via First Street. Map © Google.
Why this score? — see what drove the C grade
The composite is a weighted blend of 9 inputs, each scored 0–100. Each bar is that input's sub-score; the figure is the points it added to the 100-point composite (weight × sub-score).
- Cash flow +19.4/30.0
- Appreciation +8.9/10.0
- ARV discount +7.5/15.0
- DSCR +6.1/10.0
- 1% rule +5.1/10.0
- Livability +2.9/5.0
- Rent growth +2.5/5.0
- Condition / age +2.5/5.0
- Schools +1.5/10.0
$105,000
🖨 Deal sheet 📄 Offer letter ✓ Due diligence
Listing remarks
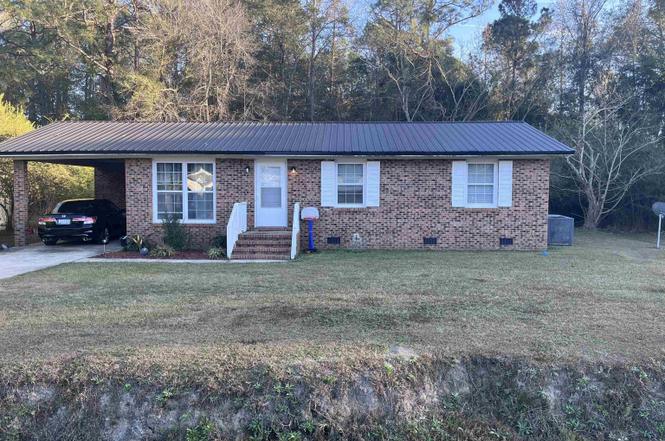
Welcome to this well-maintained 3 bed, 1 bath home offering comfort, convenience, and immediate rental income. The property features vinyl plank flooring throughout the living room, kitchen, and bathroom, with cozy carpeted bedrooms for added warmth. Enjoy a spacious eat-in kitchen, perfect for gatherings and everyday meals. The home sits on a large front yard, offering great curb appeal and room to personalize outdoor space. HVAC was replace April 2026. Tenant currently in place, making this an excellent opportunity for investors seeking a turnkey rental property. Property is sold AS-ISDon’t miss out on this solid addition to your portfolio! Disclaimer: CMLS has not reviewed and, th
Key facts
- Large front yard
- Vinyl plank flooring
- 8,712 sq ft lot
Tags
Property features AI
Exterior
- Parking: Attached carport; One covered parking space
- Utilities: Public water; Public sewer
- Home design: Single-family property
- Construction: Crawlspace foundation
- Exterior features: Brick exterior above foundation; Paved road frontage; Approximately 0.2-acre lot
Interior
- Bedrooms: Main-level master bedroom
- Bathrooms: One full bathroom
- Heating & cooling: Central heat; Central air
- Interior features: Central heating and central air
Neighborhood map
What this means for you Summary
Snapshot
- This is a 3-bed/1.0-bath other listed at $105k.
Deal economics
- At list price, monthly cash flow is $117 ($1k/yr) — positive.
- The deal already cash-flows at list — no discount required.
- Meets the 1% rule at list price ($1k rent vs $105k).
- Recommended offer: $92k (12.0% below list) — sets the bar for market timing.
Location & tenants
- Location reads 58/100 on livability (#260 in SC) — a working-class tenant base; expect higher turnover. Strengths: cost of living A+, housing A+, health & safety A+; Watch: schools D+, crime F, amenities F.
- Williamsburg 01 (rural): math 13% / reading 26% proficiency, ranked #74 of 80 in SC (top 92%) — low school quality limits family demand, transient renter base, plan for 1-2y turnover; 88% free/reduced lunch — lower-income household profile, screen leases tightly.
- Market conditions: 40 active listings in the ZIP; 35 units permitted in Williamsburg County in 2024 (0 in 5+ unit buildings).
Forward outlook
- In year one you build about $9k of equity ($726 loan paydown + $8k appreciation (7.8% local appreciation)).
- Williamsburg County population projected at -32% by 2050 — secular population decline; favor cash flow + early exit over multi-decade hold.
- At projected returns (7.8% appreciation + 3.0% rent growth), your $29k cash investment doubles in ~3 years — after that, you're playing with house money.
- By year 4, paydown + projected appreciation supports a ~$31k cash-out refi (75% LTV) — recoverable capital for the next deal without selling this one.
Negotiation context
- It's been on market 190 days — a 12% lower offer ($92k) is reasonable based on typical stale-listing flexibility.
Risks & watch-outs
- Climate carrying-cost: severe wind risk, 80% chance of damaging wind over 30y; major wildfire risk; extreme-heat days projected 7→16/yr by 2055 (HVAC capex compounding) — expect insurance premiums to compound above CPI over the hold.
Questions for the listing agent
- It's been on market 190 days. Have you received any prior offers? Is the seller open to a 12% concession, seller financing, or rate buy-down credit?
- Why hasn't it sold? Are there any deal-killer items the seller is aware of (foundation, flood, title, zoning, code violations)?
- Is there a deadline driving the sale (1031 exchange, divorce, estate, relocation)? That informs how much negotiation room exists.
- Schools are D-rated, which usually means shorter tenancies and higher turnover. Who's the typical renter profile here, and what's been the actual vacancy rate?
- Crime grade is F in this area — have there been break-ins, vandalism, or insurance claims at this property in the last 3 years? What carrier currently insures it and at what premium?
- What's the average days-on-market for RENTAL listings here right now (not sales)? A rising rental-DOM trend means longer vacancies and softer asking-rent achievability than the comps imply.
- What's the recent tenant-quality profile in this submarket — average credit score on applications, eviction rate, late-payment / NSF rate, and stable-employment percentage? A property-management company in the area should have these aggregated.
- How much new for-sale + rental construction is in the pipeline within 1–3 miles? Heavy new supply typically softens prices + rents 12–24 months out; constrained supply supports both.
Investment metrics
- 1% rule
- 1.01% ✓
- Cap rate
- 7.64%
- Cash-on-cash
- 4.79%
- DSCR
- 1.21
- GRM
- 8.3
CMA / ARV
No comps found within radius.
Projected returns pro-forma
7.75% appreciation · 3.0% rent growth · sell at horizon
- IRR
- 23.1%
- Equity multiple
- 2.67×
- Total profit
- $49,072
- Equity at exit
- $77,991
- IRR
- 21.2%
- Equity multiple
- 5.65×
- Total profit
- $136,803
- Equity at exit
- $153,143
Cash invested: $29,400 (down + closing). Projections, not guarantees.
Landlord ↔ Tenant lean methodology
- Overall (STATE)
- 90 Strongly Landlord-Friendly
- State South Carolina
- 90 Strongly Landlord-Friendly · R+6
- County
- — inherits STATE
- City
- — inherits STATE
ZIP-level market 29554
- Home prices YoY
- 4.9%
- Active inventory
- 40
- Price-to-rent
- 8.3×
Monthly cashflow live
- Estimated rent
- $1,055 medium interval (Pro) →
- Mortgage (P&I)
- −$551
- Tax from tax record
- −$122 /mo · $1,463/yr
- Insurance
- −$44
- HOA
- −$0
- Vacancy / Maint / Mgmt
- −$222
- Net cashflow
- $117
Break-even live
UW: 25.0% down · 7.5% · 30yr · 1.5% tax · 5.0% vac · 8.0% maint · 8.0% mgmt
Financing live
Cash to close
- Down payment
- $26,250
- Closing costs
- $3,150
- Reserves months
- —
- Total cash needed
- —
Loan-product check · same deal, 3 products live
Conventional
25% down · 7.5% · 30yr
- Down + closing
- —
- Monthly P&I
- —
- Monthly cashflow
- —
- DSCR
- —
- Eligible?
- —
Personal DTI + credit; lowest rate.
DSCR
20% down · 8.5% · 30yr
- Down + closing
- —
- Monthly P&I
- —
- Monthly cashflow
- —
- DSCR
- —
- Eligible?
- —
No personal income docs; deal must DSCR.
Hard money
10% down · 12.0% · 12mo
- Down + closing
- —
- Monthly P&I
- —
- Monthly cashflow
- —
- DSCR
- —
- Eligible?
- —
Short-term bridge; refi at stabilization.
Listing history 14 events
-
2026-06-16status $105,000 Pending 190 DOM
-
2026-06-15days on market $105,000 Active 190 DOM
-
2026-06-13days on market $105,000 Active 188 DOM
-
2026-06-12days on market $105,000 Active 187 DOM
-
2026-06-09days on market $105,000 Active 184 DOM
-
2026-06-08days on market $105,000 Active 183 DOM
-
2026-06-08days on market $105,000 Active 182 DOM
-
2026-06-07days on market $105,000 Active 181 DOM
-
2026-06-04days on market $105,000 Active 178 DOM
-
2026-06-02days on market $105,000 Active 177 DOM
-
2026-06-01days on market $105,000 Active 176 DOM
-
2026-05-31days on market $105,000 Active 175 DOM
-
2026-05-08price $105,000
-
2025-12-07$115,000 Active
ⓘ Source: listings_history table (triggers on properties + properties_extension) + one-shot
backfill from property_details.listing_events for pre-trigger history.
Tax reassessment forecast SC · Resets to sale price
- Current annual tax
- $1,463 · $122/mo
- Projected year-2 tax
- $1,463 · $122/mo
- Expected delta
- $0/yr ($0/mo · 0.0%)
ⓘ Screening estimate from a state-policy table — verify with the county assessor before closing.
Climate risk First Street
- Flood 1/10 Low FEMA zone X (unshaded) · 0% chance over 30 yrs
- Wildfire 6/10 Major
- Heat 8/10 Severe 7 d/yr ≥108°F today · 16 d/yr by 30 yrs out
- Wind 8/10 Severe 80% chance of damaging wind over 30 yrs
- Air quality 2/10 Low 2 unhealthy d/yr today · 2 by 30 yrs out
Nearby sold comps map
Loading sold comps map…
Walkable amenities ~0.75 mi
Loading nearby amenities…
Taxation est. · year 1
- Rental income
- $12,665
- − Mortgage interest
- −$5,882
- − Property taxes
- −$1,463
- − Insurance
- −$525
- − Repairs & maintenance
- −$1,013
- − Management
- −$1,013
- − Depreciation
- −$3,055
- Taxable loss
- −$286
- Est. tax savings @ 24.0%
- +$69
- After-tax cash flow
- $1,478/yr
For passive investors: Depreciation is non-cash, so a rental often shows a tax loss while cash-flowing — sheltering income. Rental losses are passive: they offset passive income freely, and up to $25,000/yr can offset ordinary (W-2) income if you actively participate and your MAGI is under $100k (phasing out to $0 by $150k); unused losses carry forward. On sale, claimed depreciation is recaptured at up to 25%, and gains may owe capital-gains tax (a 1031 exchange can defer both). Figures are a year-1 estimate at your 24.0% rate — not tax advice; consult a CPA.
Schools (NCES district)
- District
- Williamsburg 01
- NCES district ID
- 4503780
- Math proficiency
- 13% ▼ -11.00%
- Reading proficiency
- 26% ▼ -4.00%
- Median HH income
- $27,663
- Composite
- 15.32/100
- National rank
- #9328
- State rank
- #74 of 80 in SC
Livability — Hemingway
- Score
- 58/100
- State rank
- #260
- US rank
- #20733
Category grades
Schools grade is shown separately in the Schools card above.
Census & demographics
- Population (ZIP)
- 9,001
Population outlook (Williamsburg County) Hauer SSP2
- Today (2025)
- 29,171 people
- By 2030
- 27,247 · -6.6%
- By 2040
- 23,314 · -20.1%
- By 2050
- 19,798 · -32.1%
- By 2075
- 13,336 · -54.3%
- By 2100
- 8,502 · -70.9%
Race, ethnicity, and origin ACS 2023
- Neighborhood character
- Majority Black (51%)
- Race & ethnicity
- Black 51% White 45% Hispanic / Latino 4%
- Common ancestry
- Serbian 2% Polish 1% Lithuanian 1%
- Foreign-born
- 4% · Canada
- Languages at home
- 96% English-only · Spanish 4%
Political lean MEDSL · Williamsburg
- 2024 margin
- Strong D (+21.7) · D 60.2% · R 38.5% · Other 1.2%
- 2008→2024 swing
- -16.5pp toward R · 2008: 38.2pp · 2024: 21.7pp
- All cycles
- 2024: D+21.7 2020: D+29.8 2016: D+33.8 2012: D+39.9 2008: D+38.2
Not yet ingested
- Civics
- —
Market trends
- HPI YoY
- ▲ 7.75%
- Current HPI
- 167.07
- Rent YoY
- —
- Metro
- —
- State GDP YoY
- ▲ 4.51%
- F500 in state
- 2
Industry mix (Fortune 500 HQ in SC)
| Industry | F500 HQs | Revenue |
|---|---|---|
| Packaging | 1 | $7B |
|
||
Price history
-8.7% since first listed2 events — show timeline
- 2026-05-08 Price Changed $105,000 Consolidated MLS
- 2025-12-07 Listed $115,000 Consolidated MLS
Property tax history
+2.7%/yrLatest (2025): $1,463 · -11.7% YoY. Source: county tax records.
Cash-flow waterfall
monthlySold comps — $/sqft
last 12 mo · ≤1 miLoading sold comps…