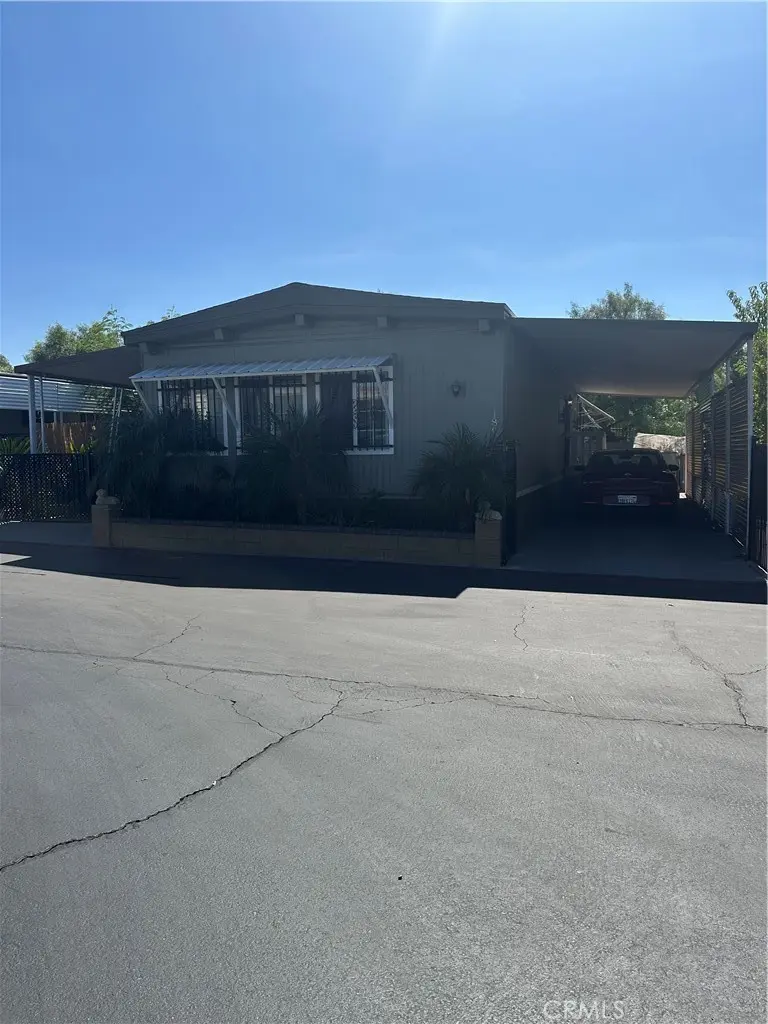
1455 S State #186 · Hemet, CA
Flood risk 1/10 · Minimal
- FEMA flood zone
- X (unshaded)
- Chance of flooding over 30 yrs
- 0.0%
- Est. flood insurance / yr
- $507 – $1,088
Fire risk 7/10 · Major
- Est. fire insurance / yr
- $659 – $1,223
Heat risk 7/10 · Major
- Hot days now (above 102°F)
- 6 days/yr
- Hot days in 30 yrs
- 18 days/yr
Wind risk 1/10 · Minimal
- Chance of severe wind over 30 yrs
- —
Air-quality risk 6/10 · Moderate
- Unhealthy air days now
- 9 days/yr
- Unhealthy air days in 30 yrs
- 11 days/yr
Risk factors via First Street. Map © Google.
Why this score? — see what drove the C+ grade
The composite is a weighted blend of 9 inputs, each scored 0–100. Each bar is that input's sub-score; the figure is the points it added to the 100-point composite (weight × sub-score).
- Cash flow +30.0/30.0
- DSCR +10.0/10.0
- 1% rule +9.5/10.0
- Rent growth +2.9/5.0
- Condition / age +2.8/5.0
- Livability +2.6/5.0
- Schools +2.5/10.0
- ARV discount +0.0/15.0
- Appreciation +0.0/10.0
$140,000
🖨 Deal sheet 📄 Offer letter ✓ Due diligence
Listing remarks MLS
this 3 bedroom 2 bath manufactured home in a tidy hemet mobile home park features central ac and heating, an update kitchen with laminate flooring, laundry hooks ups and a open, spacious layout. Enjoy a three -car driveway, front patio, and a low-maintenance backyard with detached storage adds privacy and extra space. Park amenities include a community pool, recreation room , and guest parking. A practical , comfortable home ideal for modern living in a friendly park setting
Key facts
- Central ac
- Laminate flooring
- Heating
Tags
Neighborhood map
What this means for you Summary
Snapshot
- This is a 3-bed/2.0-bath manufactured listed at $140k. Condition is rated average.
Deal economics
- At list price, monthly cash flow is $641 ($8k/yr) — positive.
- The deal already cash-flows at list — no discount required.
- Meets the 1% rule at list price ($2k rent vs $140k).
- Recommended offer: $123k (12.0% below list) — sets the bar for market timing.
- Cap rate 11.8% vs local median 4.9% in Hemet — top-decile yield for the area; either an underpriced asset or a hidden risk that comps aren't pricing in. Stress-test before assuming the spread holds.
Location & tenants
- Location reads 51/100 on livability (#1,056 in CA) — a working-class tenant base; expect higher turnover. Strengths: housing A+; Watch: crime D+, schools F, amenities F.
- Hemet Unified (suburban): math 19% / reading 41% proficiency, ranked #360 of 517 in CA (top 70%) — families likely to look elsewhere, expect single-tenant / working-renter base with shorter leases; 66% free/reduced lunch — lower-income household profile, screen leases tightly.
- Market conditions: Rents rising (+1.8%/yr); 264 active listings in the ZIP; 35 comparable units currently listed for rent nearby; rentals at typical pace (median 18d on market — plan ~3-4 weeks tenant-placement turnaround); 9,195 units permitted in Riverside County in 2024 (1,512 in 5+ unit buildings).
- At $2,035/mo this rent would consume 49% of the median local household income ($49k/yr) (locally 2144% of renters already pay >50% of income on rent) — very limited rent-growth headroom before tenants either downsize or default.
Forward outlook
- Local home prices are declining (-3.0%/yr); year-one equity from $968 of loan paydown is wiped out by about $4k of value loss. Plan a longer hold.
- Riverside County population projected at +22% by 2050 — long-run rental-demand tailwind backs the buy-and-hold thesis.
- At projected returns (-3.0% appreciation + 1.8% rent growth), your $39k cash investment doubles in ~7 years — after that, you're playing with house money.
Negotiation context
- It's been on market 233 days — a 12% lower offer ($123k) is reasonable based on typical stale-listing flexibility.
- 9 sale attempts since 22y ago with the ask held roughly flat each time — persistent listings suggest the price (not the market) is what's stuck; bring a comps-based counter.
Risks & watch-outs
- Climate carrying-cost: major wildfire risk; extreme-heat days projected 6→18/yr by 2055 (HVAC capex compounding) — expect insurance premiums to compound above CPI over the hold.
Questions for the listing agent
- It's been on market 233 days. Have you received any prior offers? Is the seller open to a 12% concession, seller financing, or rate buy-down credit?
- Built in 1968 — when were the roof, HVAC, electrical panel, plumbing, and water heater last replaced?
- Why hasn't it sold? Are there any deal-killer items the seller is aware of (foundation, flood, title, zoning, code violations)?
- Is there a deadline driving the sale (1031 exchange, divorce, estate, relocation)? That informs how much negotiation room exists.
- Schools are F-rated, which usually means shorter tenancies and higher turnover. Who's the typical renter profile here, and what's been the actual vacancy rate?
- Crime grade is D in this area — have there been break-ins, vandalism, or insurance claims at this property in the last 3 years? What carrier currently insures it and at what premium?
- What's the average days-on-market for RENTAL listings here right now (not sales)? A rising rental-DOM trend means longer vacancies and softer asking-rent achievability than the comps imply.
- What's the recent tenant-quality profile in this submarket — average credit score on applications, eviction rate, late-payment / NSF rate, and stable-employment percentage? A property-management company in the area should have these aggregated.
- How much new for-sale + rental construction is in the pipeline within 1–3 miles? Heavy new supply typically softens prices + rents 12–24 months out; constrained supply supports both.
Investment metrics
- 1% rule
- 1.45% ✓
- Cap rate
- 11.78%
- Cash-on-cash
- 19.61%
- DSCR
- 1.87
- GRM
- 5.7
CMA / ARV
- ARV (median comp)
- $106,000
- List price
- $140,000
- Delta
- 32.08%
- Verdict
- OVERPRICED
- Comps
- 20 within 1.0 mi
Show comp detail 12 sales within ~0.75 mi
| Address | Dist | Beds/Ba | Sqft | Sold | Price | $/sf | Match |
|---|---|---|---|---|---|---|---|
| 1455 S State St #111 | 0.03mi | 2/2.0 (-1) | 1,040 (-6%) | 3mo | $102,000 | $98 | 82 |
| 725 W Thornton Ave #22 | 0.22mi | 2/2.0 (-1) | 1,092 (-1%) | 10mo | $43,000 | $39 | 74 |
| 1536 S State St #134 | 0.36mi | 3/2.0 | 1,058 (-4%) | 9mo | $122,500 | $116 | 70 |
| 1536 S State St #58 | 0.36mi | 2/2.0 (-1) | 1,152 (+5%) | 6mo | $125,000 | $109 | 66 |
| 725 W Thornton Ave #97 | 0.22mi | 2/2.0 (-1) | 960 (-13%) | 4mo | $25,200 | $26 | 60 |
| 1700 S State St #76 | 0.58mi | 3/2.0 | 1,056 (-4%) | 10mo | $50,000 | $47 | 58 |
| 1536 S State St #80 | 0.31mi | 3/2.0 | 1,232 (+12%) | 10mo | $203,900 | $166 | 57 |
| 1536 S State St #219 | 0.36mi | 2/2.0 (-1) | 1,248 (+14%) | 0mo | $135,000 | $108 | 56 |
| 1167 Via Del Mesa | 0.71mi | 2/2.0 (-1) | 1,152 (+5%) | 1mo | $135,000 | $117 | 54 |
| 725 W Thornton Ave #14 | 0.22mi | 2/2.0 (-1) | 1,248 (+14%) | 11mo | $68,000 | $54 | 53 |
| 838 San Francisco Dr | 0.75mi | 2/2.0 (-1) | 1,040 (-6%) | 4mo | $110,000 | $106 | 47 |
| 1083 Via Del Mesa | 0.66mi | 2/2.0 (-1) | 1,200 (+9%) | 3mo | $149,900 | $125 | 46 |
Match score weights: distance 35% · size 25% · config 20% · recency 20%. Top-matched comps best support the ARV.
Projected returns pro-forma
-3.0% appreciation · 1.76% rent growth · sell at horizon
- IRR
- 10.2%
- Equity multiple
- 1.40×
- Total profit
- $15,631
- Equity at exit
- $20,874
- IRR
- 18.3%
- Equity multiple
- 2.43×
- Total profit
- $56,225
- Equity at exit
- $12,105
Cash invested: $39,200 (down + closing). Projections, not guarantees.
Landlord ↔ Tenant lean methodology
- Overall (STATE)
- 18 Strongly Tenant-Friendly
- State California
- 18 Strongly Tenant-Friendly · D+13
- County
- — inherits STATE
- City
- — inherits STATE
ZIP-level market 92543
- Home prices YoY
- -26.7%
- Rents YoY
- 1.8%
- Active inventory
- 264
- Price-to-rent
- 5.7×
Monthly cashflow live
- Estimated rent
- $2,035 high interval (Pro) →
- Mortgage (P&I)
- −$734
- Tax est. 1.5%
- −$175 /mo · $2,100/yr
- Insurance
- −$58
- HOA
- −$0
- Vacancy / Maint / Mgmt
- −$427
- Net cashflow
- $641
Break-even live
UW: 25.0% down · 7.5% · 30yr · 1.5% tax · 5.0% vac · 8.0% maint · 8.0% mgmt
Financing live
Cash to close
- Down payment
- $35,000
- Closing costs
- $4,200
- Reserves months
- —
- Total cash needed
- —
Loan-product check · same deal, 3 products live
Conventional
25% down · 7.5% · 30yr
- Down + closing
- —
- Monthly P&I
- —
- Monthly cashflow
- —
- DSCR
- —
- Eligible?
- —
Personal DTI + credit; lowest rate.
DSCR
20% down · 8.5% · 30yr
- Down + closing
- —
- Monthly P&I
- —
- Monthly cashflow
- —
- DSCR
- —
- Eligible?
- —
No personal income docs; deal must DSCR.
Hard money
10% down · 12.0% · 12mo
- Down + closing
- —
- Monthly P&I
- —
- Monthly cashflow
- —
- DSCR
- —
- Eligible?
- —
Short-term bridge; refi at stabilization.
Rent comps 35 comps
| Address | Beds | Baths | Sqft | Rent | $/sqft | DOM | Units | Dist |
|---|---|---|---|---|---|---|---|---|
| 409 E Thornton Ave Hemet, CA | 2.0 | 1.0 | 970 | $1,912 | $1.97 | 2d | 2 | 0.25mi |
| 390 Magnolia Cir Hemet, CA | 2.0 | 2.0 | 1038 | $2,400 | $2.31 | 3d | 1 | 0.47mi |
| 1025 S Gilbert St Hemet, CA | 1.0–2.0 | 1.0–2.0 | 890 | $2,320 | $2.61 | 1d | 8 | 0.49mi |
| 1005 S Gilbert St Hemet, CA | 2.0 | 1.5 | 975 | $1,825 | $1.87 | 24d | 2 | 0.55mi |
| 640 Vista del Monte Hemet, CA | 3.0 | 2.0 | 1480 | $2,650 | $1.79 | 43d | 1 | 0.56mi |
| 678 Monterey Pl Hemet, CA | 2.0 | 2.0 | 1047 | $1,995 | $1.91 | 43d | 1 | 0.67mi |
| 576 Montecito Ave Unit C Hemet, CA | 2.0 | 2.0 | 861 | $1,850 | $2.15 | 16d | 1 | 0.70mi |
| 893 S Palm Ave Hemet, CA | 2.0 | 2.0 | 720 | $1,375 | $1.91 | 4d | 1 | 0.74mi |
| 853 Douglas Ct Hemet, CA | 2.0 | 2.0 | 1148 | $1,850 | $1.61 | 3d | 1 | 0.75mi |
| 860 Douglas Ct Hemet, CA | 2.0 | 2.0 | 1114 | $1,850 | $1.66 | 18d | 1 | 0.75mi |
| 750 Santa Clara Cir Hemet, CA | 2.0 | 2.0 | 800 | $1,400 | $1.75 | 14d | 1 | 0.77mi |
| 716 Robert Dr Hemet, CA | 3.0 | 2.0 | 1450 | $2,300 | $1.59 | 5d | 1 | 0.81mi |
| 700 Johnston Ave Unit 708 Hemet, CA | 2.0 | 1.0 | 1000 | $1,600 | $1.60 | 7d | 1 | 0.84mi |
| 735 S Gilbert St Hemet, CA | 3.0 | 2.0 | 1202 | $2,400 | $2.00 | 43d | 1 | 0.84mi |
| 1711 Pepper Tree Dr Hemet, CA | 2.0 | 2.0 | 864 | $1,675 | $1.94 | 21d | 1 | 0.93mi |
| 876 W Whittier Ave Unit 878 Hemet, CA | 2.0 | 2.0 | 1127 | $2,150 | $1.91 | 24d | 1 | 0.95mi |
| 120 Santa Lucia Dr Hemet, CA | 2.0 | 2.0 | 1197 | $1,600 | $1.34 | 43d | 1 | 1.00mi |
| 101 San Mateo Cir Hemet, CA | 2.0 | 2.0 | 1152 | $1,725 | $1.50 | 16d | 1 | 1.01mi |
| 611 S Palm Ave Unit K Hemet, CA | 2.0 | 2.0 | 1254 | $1,895 | $1.51 | 7d | 1 | 1.08mi |
| 733 S San Jacinto St Unit B Hemet, CA | 2.0 | 1.0 | 1000 | $1,500 | $1.50 | 24d | 1 | 1.17mi |
| 1521 W Westmont Ave Hemet, CA | 2.0 | 2.0 | 1197 | $2,000 | $1.67 | 43d | 1 | 1.17mi |
| 471 S Simpson Ave Unit D Hemet, CA | 2.0 | 2.0 | 900 | $1,750 | $1.94 | 43d | 1 | 1.20mi |
| 1955 Silver Oak Way Hemet, CA | 3.0 | 2.0 | 1318 | $2,250 | $1.71 | 43d | 1 | 1.20mi |
| 363 S Gilbert St Unit B Hemet, CA | 3.0 | 2.0 | 1200 | $1,900 | $1.58 | 13d | 1 | 1.27mi |
| 363 S Gilbert St Hemet, CA | 3.0 | 2.0 | 1200 | $1,900 | $1.58 | 3d | 1 | 1.27mi |
| 26454 S San Jacinto St Hemet, CA | 3.0 | 1.0 | 800 | $1,795 | $2.24 | 2d | 1 | 1.29mi |
| 26452 S San Jacinto St Hemet, CA | 3.0 | 1.0 | 800 | $1,795 | $2.24 | 2d | 1 | 1.29mi |
| 1287 Olive Tree Ln Unit C Hemet, CA | 2.0 | 1.0 | 995 | $1,495 | $1.50 | 24d | 1 | 1.29mi |
| 1287 Olive Tree Ln Unit D Hemet, CA | 2.0 | 1.0 | 995 | $1,599 | $1.61 | 43d | 1 | 1.29mi |
| 26450 San Jacinto St Hemet, CA | 3.0 | 2.0 | 1250 | $2,295 | $1.84 | 2d | 1 | 1.29mi |
| 1461 W Mayberry Ave Hemet, CA | 2.0 | 2.0 | 1044 | $1,750 | $1.68 | 43d | 1 | 1.33mi |
| 26416 S San Jacinto St Unit 26416 Hemet, CA | 2.0 | 1.0 | 900 | $1,675 | $1.86 | 24d | 1 | 1.33mi |
| 471 Whitney Dr Hemet, CA | 2.0 | 2.0 | 1085 | $1,800 | $1.66 | 5d | 1 | 1.43mi |
| 1850 Amberwood Dr Hemet, CA | 2.0 | 2.0 | 1170 | $1,561 | $1.33 | 43d | 1 | 1.44mi |
| 926 Griffith Way Hemet, CA | 4.0 | 2.0 | 1300 | $2,800 | $2.15 | 43d | 1 | 1.50mi |
Listing history 13 events
-
2026-05-31days on market $140,000 Active 233 DOM
-
2025-10-29status Active 480-char remark
Show marketing remark (480 chars)
this 3 bedroom 2 bath manufactured home in a tidy hemet mobile home park features central ac and heating, an update kitchen with laminate flooring, laundry hooks ups and a open, spacious layout. Enjoy a three -car driveway, front patio, and a low-maintenance backyard with detached storage adds privacy and extra space. Park amenities include a community pool, recreation room , and guest parking. A practical , comfortable home ideal for modern living in a friendly park setting
-
2025-10-09$140,000 Active 480-char remark
Show marketing remark (480 chars)
this 3 bedroom 2 bath manufactured home in a tidy hemet mobile home park features central ac and heating, an update kitchen with laminate flooring, laundry hooks ups and a open, spacious layout. Enjoy a three -car driveway, front patio, and a low-maintenance backyard with detached storage adds privacy and extra space. Park amenities include a community pool, recreation room , and guest parking. A practical , comfortable home ideal for modern living in a friendly park setting
-
2023-10-09historical
-
2023-07-28status Active
-
2023-07-25status Active
-
2023-06-17status Active
-
2023-06-15status Active
-
2023-04-12$140,000 Active
-
2021-01-04historical
-
2020-10-05$65,000 Active
-
2004-06-21historical
-
2004-02-21$23,000
ⓘ Source: listings_history table (triggers on properties + properties_extension) + one-shot
backfill from property_details.listing_events for pre-trigger history.
Climate risk First Street
- Flood 1/10 Low FEMA zone X (unshaded) · 0% chance over 30 yrs
- Wildfire 7/10 Severe
- Heat 7/10 Severe 6 d/yr ≥102°F today · 18 d/yr by 30 yrs out
- Wind 1/10 Low
- Air quality 6/10 Major 9 unhealthy d/yr today · 11 by 30 yrs out
Nearby sold comps map
Loading sold comps map…
Walkable amenities ~0.75 mi
Loading nearby amenities…
Taxation est. · year 1
- Rental income
- $24,426
- − Mortgage interest
- −$7,842
- − Property taxes
- −$2,100
- − Insurance
- −$700
- − Repairs & maintenance
- −$1,954
- − Management
- −$1,954
- − Depreciation
- −$4,073
- Taxable income
- $5,803
- Est. tax owed @ 24.0%
- −$1,393
- After-tax cash flow
- $6,294/yr
For passive investors: Depreciation is non-cash, so a rental often shows a tax loss while cash-flowing — sheltering income. Rental losses are passive: they offset passive income freely, and up to $25,000/yr can offset ordinary (W-2) income if you actively participate and your MAGI is under $100k (phasing out to $0 by $150k); unused losses carry forward. On sale, claimed depreciation is recaptured at up to 25%, and gains may owe capital-gains tax (a 1031 exchange can defer both). Figures are a year-1 estimate at your 24.0% rate — not tax advice; consult a CPA.
Condition & rehab AI · 12 photos
This 3-bedroom, 2-bath manufactured home in a mobile home park is in average condition with cosmetic repairs needed. Updates to paint, siding, and interior finishes would significantly enhance its resale and rental value.
Repairs flagged
- Minor Exterior siding — Weathered appearance
- Minor Interior paint — Slightly faded
Value-add opportunities
- Both Paint interior walls — Fresh paint enhances curb appeal and interior aesthetics
- Both Replace exterior siding — New siding improves curb appeal and structural integrity
- Both Update kitchen countertops — Modern countertops increase resale value and functionality
- Both Update bathrooms — Modern bathrooms with updated fixtures and finishes
- Both Landscaping improvements — Enhanced landscaping increases curb appeal and property value
Renovation cost estimate screening
| Repair item | Severity | Est. cost |
|---|---|---|
| Exterior siding · Weathered appearance | Minor | $500–3,000 |
| Interior paint · Slightly faded | Minor | $500–3,000 |
| Total estimated repair cost · 2 items | $1,000–6,000 |
Value-add ROI direction
- Both Paint interior walls — Fresh paint enhances curb appeal and interior aesthetics ↑
- Both Replace exterior siding — New siding improves curb appeal and structural integrity ↑
- Both Update kitchen countertops — Modern countertops increase resale value and functionality ↑
- Both Update bathrooms — Modern bathrooms with updated fixtures and finishes ↑
- Both Landscaping improvements — Enhanced landscaping increases curb appeal and property value ↑
ⓘ Cost ranges are severity-bucket heuristics (US national rule-of-thumb). Get contractor quotes + a written scope before underwriting a rehab budget.
Schools (NCES district)
- District
- Hemet Unified
- NCES district ID
- 0616920
- Math proficiency
- 19% ▼ -3.00%
- Reading proficiency
- 41% ▲ 4.00%
- Median HH income
- $39,962
- Composite
- 25.16/100
- National rank
- #7517
- State rank
- #360 of 517 in CA
Livability — Hemet
- Score
- 51/100
- State rank
- #1056
- US rank
- #25208
Category grades
Schools grade is shown separately in the Schools card above.
Census & demographics
- Census place
- Hemet, CA
- County
- Riverside County · 2,287,001 people
- City population
- 137,670
- Metro
- Riverside-San Bernardino-Ontario, CA
- Population (ZIP)
- 39,937
- Household income
- $49,396
- Rent vs Own
- Severe rent burden
- 2144.0
Population outlook (Riverside County) Hauer SSP2
- Today (2025)
- 2,664,475 people
- By 2030
- 2,802,692 · +5.2%
- By 2040
- 3,050,904 · +14.5%
- By 2050
- 3,256,783 · +22.2%
- By 2075
- 3,655,058 · +37.2%
- By 2100
- 3,766,594 · +41.4%
Race, ethnicity, and origin ACS 2023
- Neighborhood character
- Diverse neighborhood (Simpson 0.61)
- Race & ethnicity
- Hispanic / Latino 54% White 30% Two or more races 18% Black 10% Native American 2% Asian 2%
- Hispanic origin (detail)
- Mexican 48% Puerto Rican 1%
- Common ancestry
- Slovak 1% Romanian 1% Portuguese 1%
- Foreign-born
- 21% · Canada
- Languages at home
- 59% English-only · Spanish 38% Arabic 1% Tagalog/Filipino 1%
Political lean MEDSL · Riverside
- 2024 margin
- Toss-up / Even · D 48.0% · R 49.3% · Other 2.6%
- 2008→2024 swing
- -3.6pp toward R · 2008: 2.3pp · 2024: -1.3pp
- All cycles
- 2024: R+1.3 2020: D+8.0 2016: D+4.3 2012: R+0.4 2008: D+2.3
Not yet ingested
- Civics
- —
Market trends
- HPI YoY
- ▼ -147.46%
- Current HPI
- 405.1277
- Rent YoY
- ▲ 1.76%
- Metro
- Riverside-San Bernardino-Ontario, CA
- State GDP YoY
- ▲ 3.21%
- F500 in state
- 116
Industry mix (Fortune 500 HQ in CA)
| Industry | F500 HQs | Revenue |
|---|---|---|
| Technology | 27 | $1,492B |
|
||
| Financial Services | 3 | $174B |
|
||
| Retail | 3 | $44B |
|
||
| Insurance | 3 | $26B |
|
||
| Media / Entertainment | 2 | $115B |
|
||
| Pharmaceuticals / Biotech | 2 | $62B |
|
||
Price history
+508.7% since first listed12 events — show timeline
- 2025-10-29 Relisted — CRMLS
- 2025-10-09 Listed $140,000 CRMLS
- 2023-10-09 Listing Removed — CRMLS
- 2023-07-28 Relisted — CRMLS
- 2023-07-25 Relisted — CRMLS
- 2023-06-17 Relisted — CRMLS
- 2023-06-15 Relisted — CRMLS
- 2023-04-12 Listed $140,000 CRMLS
- 2021-01-04 Listing Removed — CRMLS
- 2020-10-05 Listed $65,000 CRMLS
- 2004-06-21 Listing Removed — CRMLS
- 2004-02-21 Listed $23,000 CRMLS
Cash-flow waterfall
monthlySold comps — $/sqft
last 12 mo · ≤1 miLoading sold comps…