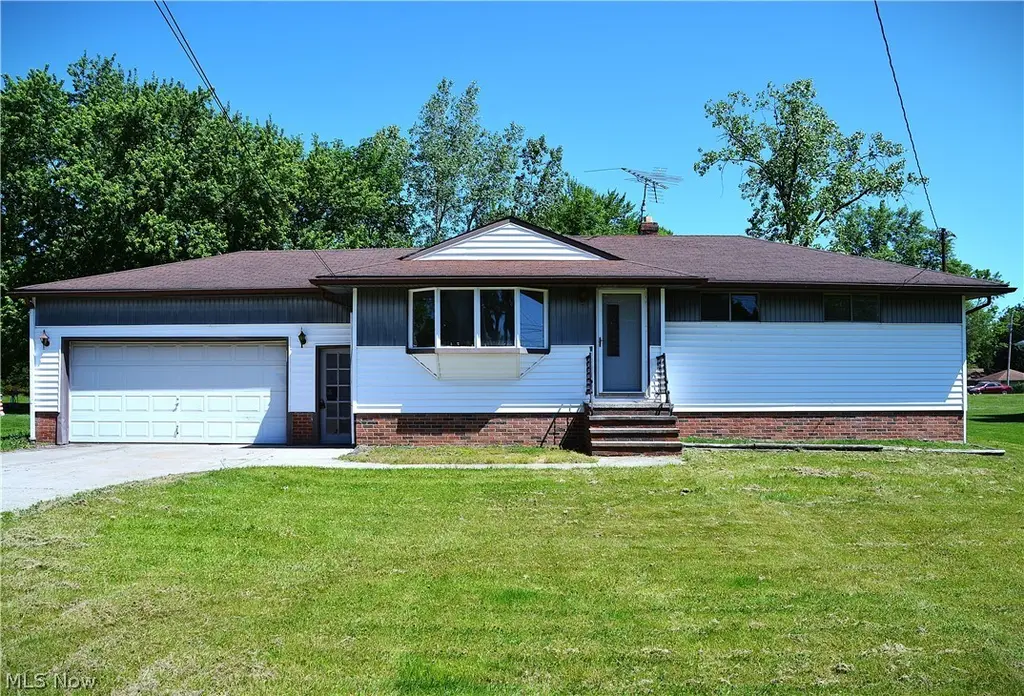
3713 Grafton Rd · Brunswick, OH
Flood risk 1/10 · Minimal
- FEMA flood zone
- X (unshaded)
- Chance of flooding over 30 yrs
- 0.0%
- Est. flood insurance / yr
- $473 – $860
Fire risk 1/10 · Minimal
- Est. fire insurance / yr
- $713 – $1,323
Heat risk 2/10 · Minimal
- Hot days now (above 96°F)
- 7 days/yr
- Hot days in 30 yrs
- 16 days/yr
Wind risk 1/10 · Minimal
- Chance of severe wind over 30 yrs
- —
Air-quality risk 2/10 · Minimal
- Unhealthy air days now
- 1 days/yr
- Unhealthy air days in 30 yrs
- 2 days/yr
Risk factors via First Street. Map © Google.
Why this score? — see what drove the D+ grade
The composite is a weighted blend of 9 inputs, each scored 0–100. Each bar is that input's sub-score; the figure is the points it added to the 100-point composite (weight × sub-score).
- ARV discount +15.0/15.0
- Cash flow +12.1/30.0
- Schools +5.8/10.0
- Livability +4.0/5.0
- 1% rule +3.7/10.0
- DSCR +3.6/10.0
- Rent growth +2.5/5.0
- Condition / age +2.5/5.0
- Appreciation +0.0/10.0
$230,000
🖨 Deal sheet 📄 Offer letter ✓ Due diligence
Listing remarks MLS
NOT a short sale! This 3 BR ranch is conveniently located and offers a great opportunity to get in to a solid home. All existing appliances stay including a summer kitchen in the basement. Needs some TLC (paint/carpet) & updates but offers a great value. Buy now with possible 3.5% down and get that first time buyer tax credit if closed before December 1!
Key facts
- 0.41 acre lot
- 2 garage spots
- Built 1960
Property features AI
Exterior
- Parking: Attached 2-car garage; Driveway; Concrete surfaces; Garage door opener; Electricity to garage
- Utilities: Public water; Public sewer
- Home design: Single-story home; Vinyl siding exterior; Asphalt roof
- Construction: Built (year per public records); Vinyl siding construction; Asphalt roof; Full basement (partially finished)
- Exterior features: Covered patio; Back yard
Interior
- Bedrooms: 3 main-level bedrooms
- Bathrooms: 1 full bathroom on the main level
- Heating & cooling: Gas heating; Central air conditioning
- Interior features: Full, partially finished basement
- Laundry & utility: Laundry in the basement
Neighborhood map
What this means for you Summary
Snapshot
- This is a 3-bed/1.0-bath single-family listed at $230k.
Deal economics
- At list price, monthly cash flow is $-51 ($-611/yr) — negative.
- To cash-flow at today's rent, offer at most $221k (3.9% below list).
- To meet the 1% rule (rent ≥ 1% of price), the offer needs to be $199k (13.3% below list).
- Recommended offer: $199k (13.3% below list) — sets the bar for 1% rule.
- Cap rate 6.0% vs local median 2.9% in Brunswick — top-decile yield for the area; either an underpriced asset or a hidden risk that comps aren't pricing in. Stress-test before assuming the spread holds.
Location & tenants
- Location reads 80/100 on livability (#135 in OH, #1,940 nationally) — a professional / high-income tenant draw. Strengths: schools A+, crime A+, cost of living A+; Watch: amenities D+, health & safety D, commute F.
- Brunswick City (suburban): math 62% / reading 71% proficiency, ranked #172 of 656 in OH (top 26%) — acceptable for families but not a draw, mixed tenant base, ~2y average lease; only 18% free/reduced lunch — higher-income household profile.
- Market conditions: 175 active listings in the ZIP; 7 comparable units currently listed for rent nearby; rentals leasing fast (median 2d on market — plan ~1-2 weeks tenant-placement turnaround); 43% of comp listings sitting > 30 days — soft ceiling on asking rent; solid renter incomes; 471 units permitted in Medina County in 2024 (0 in 5+ unit buildings).
Forward outlook
- Local home prices are declining (-3.0%/yr); year-one equity from $2k of loan paydown is wiped out by about $7k of value loss. Plan a longer hold.
Negotiation context
- It's been on market 20 days — a 2% lower offer ($227k) is reasonable based on typical stale-listing flexibility.
- 2 sale attempts since 17y ago with the ask held roughly flat each time — persistent listings suggest the price (not the market) is what's stuck; bring a comps-based counter.
- Current owner paid $102k; list at $230k implies a 125% gain — meaningful room to come down on a strong offer.
Questions for the listing agent
- What do current leases actually rent for vs. the listed asking? Can we see a recent rent roll and the last 12 months of T-12 income?
- Built in 1960 — when were the roof, HVAC, electrical panel, plumbing, and water heater last replaced?
- Is there a deadline driving the sale (1031 exchange, divorce, estate, relocation)? That informs how much negotiation room exists.
- Schools are A-rated — typically a magnet for longer-tenancy family renters. What's the average tenant stay here, and is there a school-zone premium baked into asking?
- The area grade is low — what's the realistic commute time and amenity access for the typical tenant pool here? Any planned neighborhood developments (good or bad) we should know about?
- What's the average days-on-market for RENTAL listings here right now (not sales)? A rising rental-DOM trend means longer vacancies and softer asking-rent achievability than the comps imply.
- What's the recent tenant-quality profile in this submarket — average credit score on applications, eviction rate, late-payment / NSF rate, and stable-employment percentage? A property-management company in the area should have these aggregated.
- How much new for-sale + rental construction is in the pipeline within 1–3 miles? Heavy new supply typically softens prices + rents 12–24 months out; constrained supply supports both.
Investment metrics
- 1% rule
- 0.87% ✗
- Cap rate
- 6.03%
- Cash-on-cash
- -0.95%
- DSCR
- 0.96
- GRM
- 9.6
CMA / ARV
- ARV (on-the-fly)
- $296,376
- Comps found
- 12
Show comp detail 12 sales within ~0.75 mi
| Address | Dist | Beds/Ba | Sqft | Sold | Price | $/sf | Match |
|---|---|---|---|---|---|---|---|
| 683 East Dr | 0.44mi | 3/1.0 | 1,368 (-2%) | 7mo | $255,000 | $186 | 70 |
| 3537 Francis Blvd | 0.43mi | 3/2.0 | 1,314 (-6%) | 11mo | $227,000 | $173 | 57 |
| 3471 Spencer Ln | 0.51mi | 3/2.5 | 1,300 (-7%) | 4mo | $324,900 | $250 | 55 |
| 3509 Jerrold Blvd | 0.52mi | 4/2.0 (+1) | 1,440 (+3%) | 10mo | $305,000 | $212 | 53 |
| 3408 Spencer Ln | 0.63mi | 3/3.0 | 1,304 (-7%) | 2mo | $310,000 | $238 | 50 |
| 3915 Claythorne Pl | 0.51mi | 3/2.0 | 1,304 (-7%) | 16mo | $290,000 | $222 | 47 |
| 3883 Grafton Rd | 0.32mi | 3/2.0 | 1,600 (+14%) | 14mo | $350,000 | $219 | 45 |
| 827 Pennys Dr | 0.57mi | 3/1.5 | 1,245 (-11%) | 14mo | $265,900 | $214 | 41 |
| 876 Hadcock Rd | 0.71mi | 3/1.5 | 1,582 (+13%) | 2mo | $255,000 | $161 | 41 |
| 3461 Nantucket Cv | 0.49mi | 2/2.0 (-1) | 1,548 (+11%) | 12mo | $280,000 | $181 | 40 |
| 4067 Cherokee Trl | 0.69mi | 3/1.5 | 1,276 (-9%) | 14mo | $268,000 | $210 | 40 |
| 3449 Nantucket Cv | 0.50mi | 2/2.0 (-1) | 1,523 (+9%) | 18mo | $319,000 | $209 | 38 |
Match score weights: distance 35% · size 25% · config 20% · recency 20%. Top-matched comps best support the ARV.
Projected returns pro-forma
-3.0% appreciation · 3.0% rent growth · sell at horizon
- IRR
- -17.8%
- Equity multiple
- 0.37×
- Total profit
- $-40,462
- Equity at exit
- $34,294
- IRR
- -9.9%
- Equity multiple
- 0.39×
- Total profit
- $-39,197
- Equity at exit
- $19,886
Cash invested: $64,400 (down + closing). Projections, not guarantees.
Landlord ↔ Tenant lean methodology
- Overall (STATE)
- 73 Landlord-Friendly
- State Ohio
- 73 Landlord-Friendly · R+6
- County
- — inherits STATE
- City
- — inherits STATE
ZIP-level market 44212
- Active inventory
- 175
- Price-to-rent
- 9.6×
Monthly cashflow live
- Estimated rent
- $1,995 high interval (Pro) →
- Mortgage (P&I)
- −$1,206
- Tax from tax record
- −$325 /mo · $3,896/yr
- Insurance
- −$96
- HOA
- −$0
- Vacancy / Maint / Mgmt
- −$419
- Net cashflow
- $-51
Break-even live
UW: 25.0% down · 7.5% · 30yr · 1.5% tax · 5.0% vac · 8.0% maint · 8.0% mgmt
Financing live
Cash to close
- Down payment
- $57,500
- Closing costs
- $6,900
- Reserves months
- —
- Total cash needed
- —
Loan-product check · same deal, 3 products live
Conventional
25% down · 7.5% · 30yr
- Down + closing
- —
- Monthly P&I
- —
- Monthly cashflow
- —
- DSCR
- —
- Eligible?
- —
Personal DTI + credit; lowest rate.
DSCR
20% down · 8.5% · 30yr
- Down + closing
- —
- Monthly P&I
- —
- Monthly cashflow
- —
- DSCR
- —
- Eligible?
- —
No personal income docs; deal must DSCR.
Hard money
10% down · 12.0% · 12mo
- Down + closing
- —
- Monthly P&I
- —
- Monthly cashflow
- —
- DSCR
- —
- Eligible?
- —
Short-term bridge; refi at stabilization.
Rent comps 7 comps
| Address | Beds | Baths | Sqft | Rent | $/sqft | DOM | Units | Dist |
|---|---|---|---|---|---|---|---|---|
| 649 Maplewood Ave Brunswick, OH | 3.0 | 1.0 | 888 | $1,650 | $1.86 | 43d | 1 | 0.94mi |
| 655 Almas Ct Brunswick, OH | 2.0 | 2.5 | 1572 | $1,900 | $1.21 | 43d | 1 | 1.08mi |
| 88 Fox Hollow Ln Brunswick, OH | 2.0–3.0 | 2.0 | 1453 | $2,950 | $2.03 | 1d | 1 | 1.11mi |
| 16583 Sunwood Oval Strongsville, OH | 2.0 | 2.5 | 1684 | $1,999 | $1.19 | 43d | 1 | 1.14mi |
| 4257 N Shire Ln Brunswick, OH | 2.0 | 2.0 | 1286 | $1,825 | $1.42 | 1d | 1 | 1.16mi |
| 252 Cider Mill Ln Brunswick, OH | 2.0 | 2.0 | 1195 | $2,050 | $1.72 | 1d | 1 | 1.20mi |
| 1300 Cross Creek Dr Brunswick, OH | 1.0–2.0 | 1.0 | 965 | $1,575 | $1.63 | 1d | 1 | 1.42mi |
Listing history 15 events
-
2026-06-18days on market $230,000 Active 20 DOM
-
2026-06-17days on market $230,000 Active 19 DOM
-
2026-06-16days on market $230,000 Active 18 DOM
-
2026-06-15days on market $230,000 Active 17 DOM
-
2026-06-13days on market $230,000 Active 15 DOM
-
2026-06-13days on market $230,000 Active 14 DOM
-
2026-06-10price $230,000 Active 11 DOM
-
2026-06-09days on market $239,000 Active 11 DOM
-
2026-06-08days on market $239,000 Active 10 DOM
-
2026-06-07days on market $239,000 Active 9 DOM
-
2026-06-05days on market $239,000 Active 6 DOM
-
2026-06-03days on market $239,000 Active 5 DOM
-
2026-06-02days on market $239,000 Active 4 DOM
-
2026-06-01days on market $239,000 Active 3 DOM
-
2026-05-31days on market $239,000 Active 2 DOM
ⓘ Source: listings_history table (triggers on properties + properties_extension) + one-shot
backfill from property_details.listing_events for pre-trigger history.
Tax reassessment forecast OH · Partial reset (capped growth)
- Current annual tax
- $3,896 · $325/mo
- Projected year-2 tax
- $3,896 · $325/mo
- Expected delta
- $0/yr ($0/mo · 0.0%)
ⓘ Screening estimate from a state-policy table — verify with the county assessor before closing.
Climate risk First Street
- Flood 1/10 Low FEMA zone X (unshaded) · 0% chance over 30 yrs
- Wildfire 1/10 Low
- Heat 2/10 Low 7 d/yr ≥96°F today · 16 d/yr by 30 yrs out
- Wind 1/10 Low
- Air quality 2/10 Low 1 unhealthy d/yr today · 2 by 30 yrs out
Nearby sold comps map
Loading sold comps map…
Walkable amenities ~0.75 mi
Loading nearby amenities…
Taxation est. · year 1
- Rental income
- $23,935
- − Mortgage interest
- −$12,884
- − Property taxes
- −$3,896
- − Insurance
- −$1,150
- − Repairs & maintenance
- −$1,915
- − Management
- −$1,915
- − Depreciation
- −$6,691
- Taxable loss
- −$4,515
- Est. tax savings @ 24.0%
- +$1,084
- After-tax cash flow
- $472/yr
For passive investors: Depreciation is non-cash, so a rental often shows a tax loss while cash-flowing — sheltering income. Rental losses are passive: they offset passive income freely, and up to $25,000/yr can offset ordinary (W-2) income if you actively participate and your MAGI is under $100k (phasing out to $0 by $150k); unused losses carry forward. On sale, claimed depreciation is recaptured at up to 25%, and gains may owe capital-gains tax (a 1031 exchange can defer both). Figures are a year-1 estimate at your 24.0% rate — not tax advice; consult a CPA.
Schools (NCES district)
- District
- Brunswick City
- NCES district ID
- 3904366
- Math proficiency
- 62% ▼ -11.00%
- Reading proficiency
- 71% ▼ -5.00%
- Median HH income
- $65,415
- Composite
- 57.91/100
- National rank
- #1043
- State rank
- #172 of 656 in OH
Livability — Brunswick
- Score
- 80/100
- State rank
- #135
- US rank
- #1940
Category grades
Schools grade is shown separately in the Schools card above.
Census & demographics
- Census place
- Brunswick, OH
- County
- Medina County · 145,517 people
- City population
- 45,889
- Metro
- Cleveland-Elyria, OH
- Population (ZIP)
- 45,889
- Household income
- $91,441
- Rent vs Own
- Severe rent burden
- 983.0
Population outlook (Medina County) Hauer SSP2
- Today (2025)
- 185,249 people
- By 2030
- 188,174 · +1.6%
- By 2040
- 190,350 · +2.8%
- By 2050
- 187,283 · +1.1%
- By 2075
- 177,108 · -4.4%
- By 2100
- 151,304 · -18.3%
Race, ethnicity, and origin ACS 2023
- Neighborhood character
- Predominantly White (89%)
- Race & ethnicity
- White 89% Two or more races 6% Hispanic / Latino 4% Asian 1% Black 1%
- Common ancestry
- Romanian 10% Lithuanian 2% Subsaharan African 2%
- Foreign-born
- 4% · Canada
- Languages at home
- 95% English-only · Russian/Polish/Slavic 2% Other Indo-European 1% Spanish 1%
Political lean MEDSL · Medina
- 2024 margin
- Strong R (+24.8) · D 37.2% · R 62.0%
- 2008→2024 swing
- -16.8pp toward R · 2008: -8.0pp · 2024: -24.8pp
- All cycles
- 2024: R+24.8 2020: R+23.4 2016: R+24.9 2012: R+13.1 2008: R+8.0
Not yet ingested
- Civics
- —
Market trends
- HPI YoY
- ▼ -213.80%
- Current HPI
- 249.3306
- Rent YoY
- —
- Metro
- Cleveland-Elyria, OH
- State GDP YoY
- ▲ 1.98%
- F500 in state
- 48
Industry mix (Fortune 500 HQ in OH)
| Industry | F500 HQs | Revenue |
|---|---|---|
| Insurance | 3 | $145B |
|
||
| Industrial Machinery | 3 | $49B |
|
||
| Financial Services | 3 | $24B |
|
||
| Consumer Goods | 2 | $93B |
|
||
| Aerospace / Defense | 2 | $47B |
|
||
| Utilities | 2 | $33B |
|
||
Price history
+134.3% since first listed4 events — show timeline
- 2026-05-29 Listed $239,000 MLSNOW
- 2009-11-18 Sold (Public Records) $102,000 Public Records
- 2009-11-18 Sold (MLS) $102,000 MLSNOW
- 2009-06-30 Listed $102,000 MLSNOW
Property tax history
+8.8%/yrLatest (2025): $3,896 · +6.7% YoY. Source: county tax records.
Cash-flow waterfall
monthlySold comps — $/sqft
last 12 mo · ≤1 miLoading sold comps…