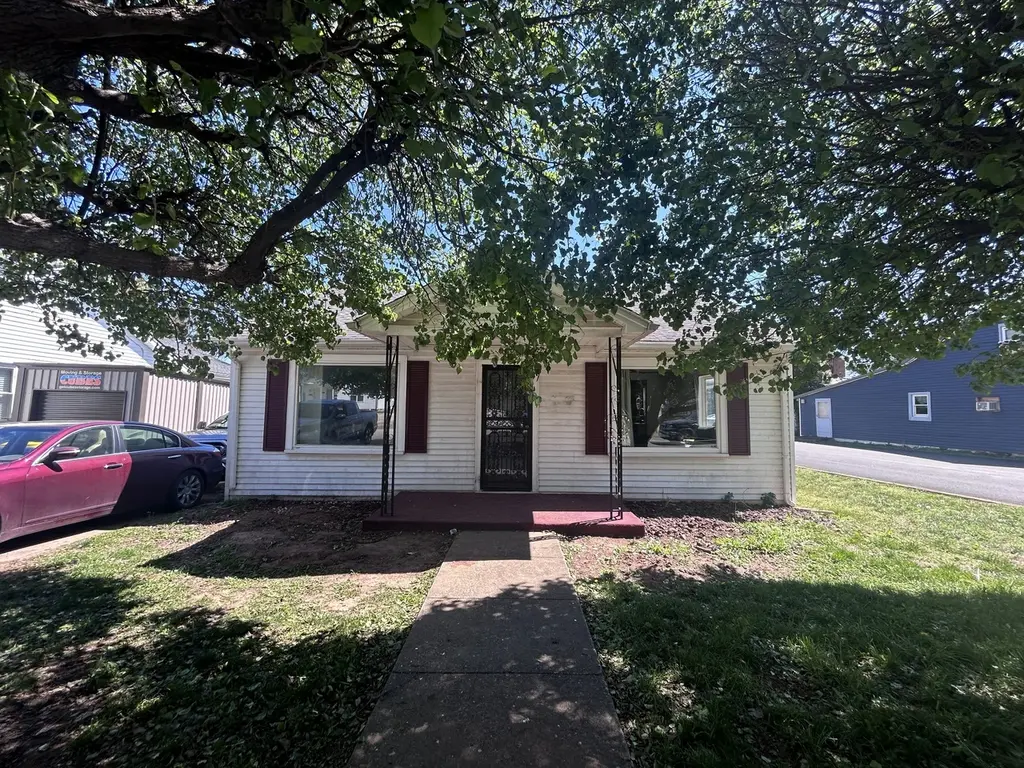
500 N High St · Franklin, KY
Flood risk 6/10 · Moderate
- FEMA flood zone
- X (unshaded)
- Chance of flooding over 30 yrs
- 0.74%
- Est. flood insurance / yr
- $507 – $1,088
Fire risk 1/10 · Minimal
- Est. fire insurance / yr
- $839 – $1,559
Heat risk 6/10 · Moderate
- Hot days now (above 106°F)
- 7 days/yr
- Hot days in 30 yrs
- 20 days/yr
Wind risk 3/10 · Minor
- Chance of severe wind over 30 yrs
- 6.0%
Air-quality risk 2/10 · Minimal
- Unhealthy air days now
- 0 days/yr
- Unhealthy air days in 30 yrs
- 1 days/yr
Risk factors via First Street. Map © Google.
Why this score? — see what drove the D+ grade
The composite is a weighted blend of 9 inputs, each scored 0–100. Each bar is that input's sub-score; the figure is the points it added to the 100-point composite (weight × sub-score).
- Cash flow +15.6/30.0
- ARV discount +13.6/15.0
- DSCR +4.8/10.0
- 1% rule +3.6/10.0
- Livability +3.2/5.0
- Schools +2.9/10.0
- Rent growth +2.5/5.0
- Condition / age +2.5/5.0
- Appreciation +0.0/10.0
$170,000
🖨 Deal sheet (PDF) 📄 Offer letter ✓ Due diligence
Listing remarks MLS
House is in the middle of renovations that have been halted. Great opportunity to come and create and make this property your own. Back yard fenced with deep corner lot that backs to alley with in walking/biking distance to Franklin Square. Convenient to much!!
Key facts
- Deep corner lot
- Back yard fenced
- 9,147 sq ft lot
Tags
Neighborhood map
What this means for you Summary
Snapshot
- This is a 2-bed/1.0-bath single-family listed at $170k.
Deal economics
- At list price, monthly cash flow is $72 ($865/yr) — positive.
- The deal already cash-flows at list — no discount required.
- To meet the 1% rule (rent ≥ 1% of price), the offer needs to be $146k (14.3% below list).
- Recommended offer: $146k (14.3% below list) — sets the bar for 1% rule.
- Cap rate 6.8% vs local median 3.9% in Franklin — top-decile yield for the area; either an underpriced asset or a hidden risk that comps aren't pricing in. Stress-test before assuming the spread holds.
Location & tenants
- Location reads 65/100 on livability (#266 in KY) — a middle-class / working-renter tenant base. Strengths: cost of living A+, housing A+, crime A; Watch: amenities F, commute F, employment F.
- Simpson County (town): math 29% / reading 39% proficiency, ranked #72 of 165 in KY (top 44%) — families likely to look elsewhere, expect single-tenant / working-renter base with shorter leases.
- Zoned schools: Simpson Elementary School (math 26% / reading 27%, grade F, #469 of 676 statewide, top 70%, 726 students, 69% FRL); Franklin-Simpson Middle School (math 29% / reading 39%, grade F, #103 of 217 statewide, top 48%, 687 students, 69% FRL); Franklin-Simpson High School (math 27% / reading 42%, grade F, #76 of 254 statewide, top 34%, 817 students, 63% FRL) — zoned schools average 67% FRL vs 52% district-wide (15 pts higher); higher-poverty schools than district average — tighter screening recommended.
- Market conditions: 282 active listings in the ZIP; 18 comparable units currently listed for rent nearby; rentals at typical pace (median 23d on market — plan ~3-4 weeks tenant-placement turnaround); 204 units permitted in Simpson County in 2024 (31 in 5+ unit buildings).
Forward outlook
- Local home prices are declining (-3.0%/yr); year-one equity from $1k of loan paydown is wiped out by about $5k of value loss. Plan a longer hold.
- Simpson County population projected at +12% by 2050 — modest demand growth; plan on rents tracking national, not racing it.
Negotiation context
- It's been on market 76 days — a 6% lower offer ($160k) is reasonable based on typical stale-listing flexibility.
- 4 sale attempts since 3y ago; this cycle's ask has dropped $10k (6%) from the opening price — seller is motivated, your offer sets the floor, not the list.
Risks & watch-outs
- Watch-outs: built in 1948 — expect roof / HVAC / electrical / plumbing capex.
- Climate carrying-cost: major flood risk; extreme-heat days projected 7→20/yr by 2055 (HVAC capex compounding) — expect insurance premiums to compound above CPI over the hold.
Questions for the listing agent
- It's been on market 76 days. Have you received any prior offers? Is the seller open to a 14% concession, seller financing, or rate buy-down credit?
- Built in 1948 — when were the roof, HVAC, electrical panel, plumbing, and water heater last replaced?
- Why hasn't it sold? Are there any deal-killer items the seller is aware of (foundation, flood, title, zoning, code violations)?
- Is there a deadline driving the sale (1031 exchange, divorce, estate, relocation)? That informs how much negotiation room exists.
- Schools are F-rated, which usually means shorter tenancies and higher turnover. Who's the typical renter profile here, and what's been the actual vacancy rate?
- The area grade is low — what's the realistic commute time and amenity access for the typical tenant pool here? Any planned neighborhood developments (good or bad) we should know about?
- What's the average days-on-market for RENTAL listings here right now (not sales)? A rising rental-DOM trend means longer vacancies and softer asking-rent achievability than the comps imply.
- What's the recent tenant-quality profile in this submarket — average credit score on applications, eviction rate, late-payment / NSF rate, and stable-employment percentage? A property-management company in the area should have these aggregated.
- How much new for-sale + rental construction is in the pipeline within 1–3 miles? Heavy new supply typically softens prices + rents 12–24 months out; constrained supply supports both.
Investment metrics
- 1% rule
- 0.86% ✗
- Cap rate
- 6.80%
- Cash-on-cash
- 1.82%
- DSCR
- 1.08
- GRM
- 9.7
CMA / ARV
- ARV (median comp)
- $196,750
- List price
- $170,000
- Delta
- -13.60%
- Verdict
- UNDERPRICED
- Comps
- 20 within 1.0 mi
Show comp detail 12 sales within ~0.75 mi
| Address | Dist | Beds/Ba | Sqft | Sold | Price | $/sf | Match |
|---|---|---|---|---|---|---|---|
| 512 Bell St | 0.11mi | 3/1.0 (+1) | 1,313 (-5%) | 1mo | $175,000 | $133 | 81 |
| 401 N High St | 0.09mi | 3/1.0 (+1) | 1,248 (-10%) | 0mo | $188,500 | $151 | 74 |
| 301 N College St | 0.22mi | 2/1.0 | 1,542 (+12%) | 1mo | $239,250 | $155 | 70 |
| 401 W Washington St | 0.27mi | 2/2.0 | 1,318 (-4%) | 11mo | $222,000 | $168 | 67 |
| 418 Longview Dr | 0.55mi | 3/2.0 (+1) | 1,415 (+2%) | 6mo | $269,900 | $191 | 56 |
| 612 Merle Ave | 0.52mi | 3/2.0 (+1) | 1,296 (-6%) | 7mo | $247,325 | $191 | 51 |
| 618 Merle Ave | 0.54mi | 3/2.0 (+1) | 1,296 (-6%) | 8mo | $262,560 | $203 | 49 |
| 701 Phillips St | 0.70mi | 3/1.5 (+1) | 1,321 (-4%) | 7mo | $210,000 | $159 | 47 |
| 309 Mcgoodwin Ave | 0.38mi | 3/1.0 (+1) | 1,192 (-14%) | 10mo | $113,000 | $95 | 46 |
| 1014 Cohen Ln | 0.61mi | 3/2.0 (+1) | 1,533 (+11%) | 4mo | $254,000 | $166 | 41 |
| 428 Westview Dr | 0.73mi | 3/2.0 (+1) | 1,200 (-13%) | 2mo | $130,000 | $108 | 34 |
| 702 Tyler St | 0.70mi | 3/2.0 (+1) | 1,236 (-10%) | 10mo | $229,900 | $186 | 32 |
Match score weights: distance 35% · size 25% · config 20% · recency 20%. Top-matched comps best support the ARV.
Projected returns pro-forma
-3.0% appreciation · 3.0% rent growth · sell at horizon
- IRR
- -13.4%
- Equity multiple
- 0.52×
- Total profit
- $-22,993
- Equity at exit
- $25,348
- IRR
- -4.6%
- Equity multiple
- 0.70×
- Total profit
- $-14,260
- Equity at exit
- $14,698
Cash invested: $47,600 (down + closing). Projections, not guarantees.
Landlord ↔ Tenant lean methodology
- Overall (STATE)
- 83 Strongly Landlord-Friendly
- State Kentucky
- 83 Strongly Landlord-Friendly · R+16
- County
- — inherits STATE
- City
- — inherits STATE
ZIP-level market 42134
- Home prices YoY
- -27.7%
- Active inventory
- 282
- Price-to-rent
- 9.7×
Monthly cashflow live
- Estimated rent
- $1,457 high interval (Pro) →
- Mortgage (P&I)
- −$891
- Tax from tax record
- −$117 /mo · $1,404/yr
- Insurance
- −$71
- HOA
- −$0
- Vacancy / Maint / Mgmt
- −$306
- Net cashflow
- $72
Break-even live
Sensitivity live
| Price | -10% $168 | -5% $120 | +0% $72 | +5% $24 | +10% $-24 |
|---|---|---|---|---|---|
| Rent | -10% $-43 | -5% $15 | +0% $72 | +5% $130 | +10% $187 |
| Rate | -1.0pp $158 | -0.5pp $115 | base $72 | +0.5pp $28 | +1.0pp $-17 |
UW: 25.0% down · 7.5% · 30yr · 1.5% tax · 5.0% vac · 8.0% maint · 8.0% mgmt
Financing live
Cash to close
- Down payment
- $42,500
- Closing costs
- $5,100
- Reserves months
- —
- Total cash needed
- —
Loan-product check · same deal, 3 products live
Conventional
25% down · 7.5% · 30yr
- Down + closing
- —
- Monthly P&I
- —
- Monthly cashflow
- —
- DSCR
- —
- Eligible?
- —
Personal DTI + credit; lowest rate.
DSCR
20% down · 8.5% · 30yr
- Down + closing
- —
- Monthly P&I
- —
- Monthly cashflow
- —
- DSCR
- —
- Eligible?
- —
No personal income docs; deal must DSCR.
Hard money
10% down · 12.0% · 12mo
- Down + closing
- —
- Monthly P&I
- —
- Monthly cashflow
- —
- DSCR
- —
- Eligible?
- —
Short-term bridge; refi at stabilization.
Rent comps 18 comps
| Address | Beds | Baths | Sqft | Rent | $/sqft | DOM | Units | Dist |
|---|---|---|---|---|---|---|---|---|
| 205 Walker St Apt B Franklin, KY | 3.0 | 2.5 | 1150 | $1,750 | $1.52 | 45d | 1 | 0.03mi |
| 413 E Madison St Franklin, KY | 2.0 | 1.0 | 1000 | $1,300 | $1.30 | 45d | 1 | 0.62mi |
| 834 N Main St Unit 40 Franklin, KY | 3.0 | 2.0 | 1280 | $1,295 | $1.01 | 45d | 1 | 0.70mi |
| 834 N Main St Unit 28 Franklin, KY | 3.0 | 2.0 | 1000 | $1,195 | $1.20 | 45d | 1 | 0.70mi |
| 834 N Main St Unit 27 Franklin, KY | 2.0 | 1.0 | 980 | $1,000 | $1.02 | 45d | 1 | 0.71mi |
| 813 W Madison St Franklin, KY | 1.0–2.0 | 1.0–2.0 | 788 | $1,195 | $1.52 | 3d | 7 | 0.77mi |
| 845 W Madison St Unit 20 Franklin, KY | 2.0 | 1.0 | 900 | $999 | $1.11 | 22d | 1 | 0.96mi |
| 845 W Madison St Franklin, KY | 1.0–2.0 | 1.0 | 900 | $999 | $1.11 | 14d | 4 | 0.96mi |
| 845 W Madison St Unit 2 Franklin, KY | 1.0 | 1.0 | 900 | $850 | $0.94 | 22d | 1 | 0.96mi |
| 411 Fairview Ave Apt C Franklin, KY | 3.0 | 1.5 | 1450 | $1,250 | $0.86 | 25d | 1 | 1.12mi |
| 965 W Madison St Apt C2 Franklin, KY | 2.0 | 2.0 | 1070 | $1,025 | $0.96 | 22d | 1 | 1.20mi |
| 801 Blackjack Rd Unit 1203 Franklin, KY | 2.0 | 2.0 | 1097 | $1,200 | $1.09 | 45d | 1 | 1.33mi |
| 801 Blackjack Rd Franklin, KY | 2.0–3.0 | 2.0 | 1171 | $1,200 | $1.02 | 14d | 5 | 1.33mi |
| 801 Blackjack Rd Unit 1101 Franklin, KY | 3.0 | 2.0 | 1245 | $1,425 | $1.14 | 45d | 1 | 1.33mi |
| 1248 Derek Dr Franklin, KY | 3.0 | 2.0 | 1200 | $1,650 | $1.38 | 14d | 1 | 1.34mi |
| 1248 Derek Dr Franklin, KY | 3.0 | 2.0 | 1200 | $1,650 | $1.38 | 22d | 1 | 1.34mi |
| 811 Witt Rd Franklin, KY | 3.0 | 2.0 | 1550 | $2,195 | $1.42 | 22d | 1 | 1.35mi |
| 1500 Easton St Unit 15106 Franklin, KY | 2.0 | 1.5 | 1220 | $1,395 | $1.14 | 14d | 1 | 1.37mi |
Listing history 23 events
-
2026-06-17days on market $170,000 Active 76 DOM
-
2026-06-16days on market $170,000 Active 75 DOM
-
2026-06-15days on market $170,000 Active 74 DOM
-
2026-06-14days on market $170,000 Active 72 DOM
-
2026-06-13days on market $170,000 Active 71 DOM
-
2026-06-10days on market $170,000 Active 69 DOM
-
2026-06-09days on market $170,000 Active 68 DOM
-
2026-06-08days on market $170,000 Active 67 DOM
-
2026-06-07days on market $170,000 Active 66 DOM
-
2026-06-03days on market $170,000 Active 62 DOM
-
2026-06-02days on market $170,000 Active 61 DOM
-
2026-06-01days on market $170,000 Active 60 DOM
-
2026-05-31days on market $170,000 Active 59 DOM
-
2026-05-30days on market $170,000 Active 58 DOM
-
2026-05-08price $170,000 261-char remark
Show marketing remark (261 chars)
House is in the middle of renovations that have been halted. Great opportunity to come and create and make this property your own. Back yard fenced with deep corner lot that backs to alley with in walking/biking distance to Franklin Square. Convenient to much!!
-
2026-04-02$180,000 Active 261-char remark
Show marketing remark (261 chars)
House is in the middle of renovations that have been halted. Great opportunity to come and create and make this property your own. Back yard fenced with deep corner lot that backs to alley with in walking/biking distance to Franklin Square. Convenient to much!!
-
2025-06-19$180,000 Active
-
2023-03-22soldstatus $160,000 Closed
-
2023-03-17soldstatus $160,000
-
2023-02-03historical Active Under Contract
-
2023-01-22$150,000 Active
ⓘ Source: listings_history table (triggers on properties + properties_extension) + one-shot
backfill from property_details.listing_events for pre-trigger history.
Tax reassessment forecast KY · Resets to sale price
- Current annual tax
- $1,404 · $117/mo
- Projected year-2 tax
- $1,462 · $122/mo
- Expected delta
- +$58/yr (+$5/mo · 4.1%)
ⓘ Screening estimate from a state-policy table — verify with the county assessor before closing.
Climate risk First Street
- Flood 6/10 Major FEMA zone X (unshaded) · 74% chance over 30 yrs
- Wildfire 1/10 Low
- Heat 6/10 Major 7 d/yr ≥106°F today · 20 d/yr by 30 yrs out
- Wind 3/10 Moderate 6% chance of damaging wind over 30 yrs
- Air quality 2/10 Low 0 unhealthy d/yr today · 1 by 30 yrs out
Nearby sold comps map
Loading sold comps map…
Walkable amenities ~0.75 mi
Loading nearby amenities…
Taxation est. · year 1
- Rental income
- $17,490
- − Mortgage interest
- −$9,523
- − Property taxes
- −$1,404
- − Insurance
- −$850
- − Repairs & maintenance
- −$1,399
- − Management
- −$1,399
- − Depreciation
- −$4,945
- Taxable loss
- −$2,031
- Est. tax savings @ 24.0%
- +$487
- After-tax cash flow
- $1,352/yr
For passive investors: Depreciation is non-cash, so a rental often shows a tax loss while cash-flowing — sheltering income. Rental losses are passive: they offset passive income freely, and up to $25,000/yr can offset ordinary (W-2) income if you actively participate and your MAGI is under $100k (phasing out to $0 by $150k); unused losses carry forward. On sale, claimed depreciation is recaptured at up to 25%, and gains may owe capital-gains tax (a 1031 exchange can defer both). Figures are a year-1 estimate at your 24.0% rate — not tax advice; consult a CPA.
Schools (NCES district)
- District
- Simpson County
- NCES district ID
- 2105400
- Math proficiency
- 29% ▼ -18.00%
- Reading proficiency
- 39% ▼ -16.00%
- Median HH income
- $41,691
- Composite
- 28.69/100
- National rank
- #6692
- State rank
- #72 of 165 in KY
Livability — Franklin
- Score
- 65/100
- State rank
- #266
- US rank
- #13010
Category grades
Schools grade is shown separately in the Schools card above.
Census & demographics
- Census place
- Franklin, KY
- County
- Simpson County · 19,380 people
- City population
- 19,380
- Metro
- nan
- Population (ZIP)
- 19,380
- Household income
- $59,113
- Rent vs Own
- Severe rent burden
- 576.0
Population outlook (Simpson County) Hauer SSP2
- Today (2025)
- 19,331 people
- By 2030
- 19,921 · +3.1%
- By 2040
- 20,975 · +8.5%
- By 2050
- 21,736 · +12.4%
- By 2075
- 23,536 · +21.8%
- By 2100
- 23,054 · +19.3%
Race, ethnicity, and origin ACS 2023
- Neighborhood character
- Predominantly White (85%)
- Race & ethnicity
- White 85% Black 7% Two or more races 6% Hispanic / Latino 3%
- Common ancestry
- Slovak 4% Italian 1% Lithuanian 1%
- Foreign-born
- 1% · Canada
- Languages at home
- 98% English-only · Spanish 1%
Political lean MEDSL · Simpson
- 2024 margin
- Solid R (+43.9) · D 27.4% · R 71.2% · Other 1.4%
- 2008→2024 swing
- -21.1pp toward R · 2008: -22.7pp · 2024: -43.9pp
- All cycles
- 2024: R+43.9 2020: R+36.7 2016: R+39.0 2012: R+24.1 2008: R+22.7
Not yet ingested
- Civics
- —
Market trends
- HPI YoY
- ▼ -84.92%
- Current HPI
- 221.6725
- Rent YoY
- —
- Metro
- nan
- State GDP YoY
- ▲ 1.81%
- F500 in state
- 4
Industry mix (Fortune 500 HQ in KY)
| Industry | F500 HQs | Revenue |
|---|---|---|
| Healthcare | 1 | $118B |
|
||
| Food / Beverage | 1 | $7B |
|
||
Price history
+13.3% since first listed9 events — show timeline
- 2026-05-08 Price Changed $170,000 REALTRACS as Distributed by MLS Grid
- 2026-05-08 Price Changed $170,000 RASKMLS
- 2026-04-02 Listed $180,000 REALTRACS as Distributed by MLS Grid
- 2026-04-02 Listed $180,000 RASKMLS
- 2025-06-19 Listed $180,000 RASKMLS
- 2023-03-22 Sold (MLS) $160,000 RASKMLS
- 2023-03-17 Sold (Public Records) $160,000 Public Records
- 2023-02-03 Contingent — RASKMLS
- 2023-01-22 Listed $150,000 RASKMLS
Property tax history
+14.7%/yrLatest (2025): $1,404 · -0.8% YoY. Source: county tax records.
Cash-flow waterfall
monthlySold comps — $/sqft
last 12 mo · ≤1 miLoading sold comps…