1849 S Ocean Dr #311 · Hallandale Beach, FL
Flood risk 8/10 · Major
- FEMA flood zone
- AE
- Chance of flooding over 30 yrs
- 0.98%
- Est. flood insurance / yr
- $1,737 – $8,500
Fire risk 1/10 · Minimal
- Est. fire insurance / yr
- $947 – $1,759
Heat risk 10/10 · Severe
- Hot days now (above 104°F)
- 6 days/yr
- Hot days in 30 yrs
- 22 days/yr
Wind risk 10/10 · Severe
- Chance of severe wind over 30 yrs
- 99.0%
Air-quality risk 2/10 · Minimal
- Unhealthy air days now
- 1 days/yr
- Unhealthy air days in 30 yrs
- 2 days/yr
Risk factors via First Street. Map © Google.
Why this score? — see what drove the D+ grade
The composite is a weighted blend of 9 inputs, each scored 0–100. Each bar is that input's sub-score; the figure is the points it added to the 100-point composite (weight × sub-score).
- Cash flow +14.7/30.0
- 1% rule +7.8/10.0
- ARV discount +7.5/15.0
- DSCR +4.5/10.0
- Schools +4.1/10.0
- Livability +4.0/5.0
- Rent growth +2.6/5.0
- Condition / age +2.5/5.0
- Appreciation +0.0/10.0
$357,000
🖨 Deal sheet (PDF) 📄 Offer letter ✓ Due diligence
Listing remarks
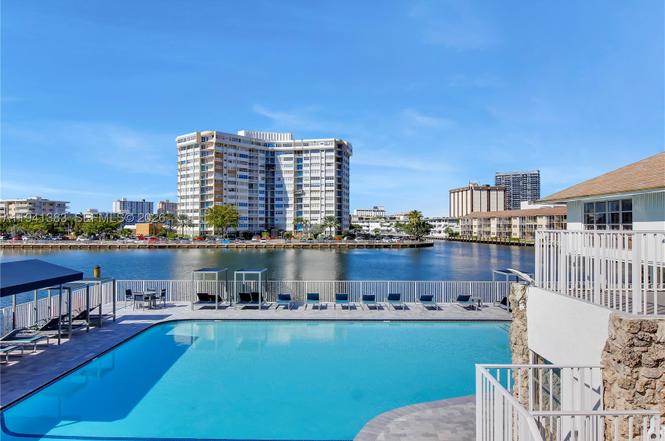
BEACH LOVERS DREAM COME TRUE! Have you always dreamed of stepping out your door and walking to the beach? Living steps from a serene canal with boats gently passing by? This stunning, fully remodeled condo is your waterfront paradise! Impeccably clean and move-in ready, this gem is just 2 minutes from beach access, where a beautiful, peaceful park awaits, perfect for morning strolls, picnics, or soaking in the ocean breeze. Enjoy resort-style amenities right at home: A completely remodeled pool overlooking the tranquil canal—lounge while watching the boats glide by. Quiet gym with inspiring canal views to keep you motivated. Fun recreation: ping pong and pool tables. Relaxing sauna a
Key facts
- Quiet gym
- Relaxing sauna
- Beach access
Tags
Property features AI
Finance
- Financial info: Pets allowed with restrictions or conditions
- HOA & community: Monthly association fee; Association covers maintenance of grounds, pool(s), and security; Community amenities include billiard room, clubhouse, fitness center, laundry facilities, pool, sauna, storage, and elevators
Exterior
- Parking: One parking space
- Security: Complex fenced; Doorman
- Utilities: Water and sewer available; Electric service available
- Home design: Condominium (attached); 16-story building; Entry on 3rd level
- Construction: Block construction; Effective year built
- Exterior features: Private balcony (open); Security/high-impact doors; Privacy wall; Heated pool; Canal-front waterfront
Interior
- Flooring: Ceramic tile flooring
- Bathrooms: 2 full bathrooms
- Heating & cooling: Central heating; Central air conditioning
- Interior features: Impact glass windows; First-floor entry; Elevator access
- Laundry & utility: Common area laundry
Neighborhood map
What this means for you Summary
Snapshot
- This is a 2-bed/2.0-bath condo listed at $357k.
Deal economics
- At list price, monthly cash flow is $-334 ($-4k/yr) — negative.
- To cash-flow at today's rent, offer at most $298k (16.5% below list).
- Meets the 1% rule at list price ($5k rent vs $357k).
- Recommended offer: $298k (16.5% below list) — sets the bar for cash-flow.
- Cap rate 6.6% vs local median 5.2% in Hallandale Beach — meaningfully above typical; check what's discounted (condition, days-on-market, listing class) to confirm the premium yield is real.
Location & tenants
- Location reads 81/100 on livability (#86 in FL, #1,400 nationally) — a professional / high-income tenant draw. Strengths: commute A+, health & safety A+, crime B+; Watch: employment D-.
- Broward (suburban): math 42% / reading 53% proficiency, ranked #46 of 73 in FL (top 63%) — families likely to look elsewhere, expect single-tenant / working-renter base with shorter leases.
- Zoned schools: Gulfstream Academy of Hallandale Beach (math 32% / reading 40%, grade F, #1,670 of 2,144 statewide, top 78%, 1,317 students, 73% FRL); Nova Middle School (math 44% / reading 53%, grade C-, #274 of 571 statewide, top 50%, 1,284 students, 68% FRL); Nova High School (math 22% / reading 56%, grade F, #312 of 667 statewide, top 48%, 2,227 students, 59% FRL) — zoned schools average 67% FRL vs 51% district-wide (16 pts higher); higher-poverty schools than district average — tighter screening recommended.
- Market conditions: Rents flat; 1380 active listings in the ZIP; 40 comparable units currently listed for rent nearby; rentals at typical pace (median 26d on market — plan ~3-4 weeks tenant-placement turnaround); 2,111 units permitted in Broward County in 2024 (1,265 in 5+ unit buildings).
- At $4,581/mo this rent would consume 106% of the median local household income ($52k/yr) (locally 3293% of renters already pay >50% of income on rent) — very limited rent-growth headroom before tenants either downsize or default.
Forward outlook
- Local home prices are declining (-3.0%/yr); year-one equity from $2k of loan paydown is wiped out by about $11k of value loss. Plan a longer hold.
- Broward County population projected at +34% by 2050 — long-run rental-demand tailwind backs the buy-and-hold thesis.
Negotiation context
- It's been on market 163 days — a 12% lower offer ($314k) is reasonable based on typical stale-listing flexibility.
- 4 sale attempts since 11y ago with the ask held roughly flat each time — persistent listings suggest the price (not the market) is what's stuck; bring a comps-based counter.
- Current owner paid $230k; list at $357k implies a 55% gain — meaningful room to come down on a strong offer.
Risks & watch-outs
- Watch-outs: flood insurance adds $427/mo; HOA is 21% of rent.
- Climate carrying-cost: in FEMA flood zone AE (mandatory federal flood insurance); severe wind risk, 99% chance of damaging wind over 30y; extreme-heat days projected 6→22/yr by 2055 (HVAC capex compounding) — expect insurance premiums to compound above CPI over the hold.
Questions for the listing agent
- What do current leases actually rent for vs. the listed asking? Can we see a recent rent roll and the last 12 months of T-12 income?
- It's been on market 163 days. Have you received any prior offers? Is the seller open to a 17% concession, seller financing, or rate buy-down credit?
- Built in 1971 — when were the roof, HVAC, electrical panel, plumbing, and water heater last replaced?
- What's the actual annual flood-insurance premium (NFIP or private), and is the property in a SFHA with mandatory coverage?
- What does the HOA fee cover, when was the last increase, and are there any pending special assessments or reserve-fund shortfalls?
- Any open or pending special assessments — roof, HVAC, plumbing, elevator, façade? What's the per-unit balance and payoff schedule, and is the seller paying it off at close or rolling it to the buyer?
- Why hasn't it sold? Are there any deal-killer items the seller is aware of (foundation, flood, title, zoning, code violations)?
- Is there a deadline driving the sale (1031 exchange, divorce, estate, relocation)? That informs how much negotiation room exists.
- The area grade is low — what's the realistic commute time and amenity access for the typical tenant pool here? Any planned neighborhood developments (good or bad) we should know about?
- What's the average days-on-market for RENTAL listings here right now (not sales)? A rising rental-DOM trend means longer vacancies and softer asking-rent achievability than the comps imply.
- What's the recent tenant-quality profile in this submarket — average credit score on applications, eviction rate, late-payment / NSF rate, and stable-employment percentage? A property-management company in the area should have these aggregated.
- How much new apartment / multifamily construction is in the pipeline within 1–3 miles? Heavy new supply (>2% of stock underway) typically softens rents 12–24 months out; light construction supports rent growth.
Investment metrics
- 1% rule
- 1.28% ✓
- Cap rate
- 6.61%
- Cash-on-cash
- 1.11%
- DSCR
- 1.05
- GRM
- 6.5
CMA / ARV
No comps found within radius.
Projected returns pro-forma
-3.0% appreciation · 0.43% rent growth · sell at horizon
- IRR
- -27.7%
- Equity multiple
- 0.10×
- Total profit
- $-89,669
- Equity at exit
- $53,230
- IRR
- -53.4%
- Equity multiple
- -0.47×
- Total profit
- $-146,472
- Equity at exit
- $30,867
Cash invested: $99,960 (down + closing). Projections, not guarantees.
Landlord ↔ Tenant lean methodology
- Overall (STATE)
- 87 Strongly Landlord-Friendly
- State Florida
- 87 Strongly Landlord-Friendly · R+3
- County
- — inherits STATE
- City
- — inherits STATE
ZIP-level market 33009
- Rents YoY
- 0.4%
- Active inventory
- 1380
- Price-to-rent
- 6.5×
Monthly cashflow live
- Estimated rent
- $4,581 high interval (Pro) →
- Mortgage (P&I)
- −$1,872
- Tax from tax record
- −$527 /mo · $6,323/yr
- Insurance
- −$149
- Flood insurance flood zone
- −$427 /mo · $5,118/yr
- HOA
- −$978
- Vacancy / Maint / Mgmt
- −$962
- Net cashflow
- $-334
Break-even live
Sensitivity live
| Price | -10% $-132 | -5% $-233 | +0% $-334 | +5% $-435 | +10% $-536 |
|---|---|---|---|---|---|
| Rent | -10% $-696 | -5% $-515 | +0% $-334 | +5% $-153 | +10% $28 |
| Rate | -1.0pp $-154 | -0.5pp $-243 | base $-334 | +0.5pp $-426 | +1.0pp $-520 |
UW: 25.0% down · 7.5% · 30yr · 1.5% tax · 5.0% vac · 8.0% maint · 8.0% mgmt
Financing live
Cash to close
- Down payment
- $89,250
- Closing costs
- $10,710
- Reserves months
- —
- Total cash needed
- —
Loan-product check · same deal, 3 products live
Conventional
25% down · 7.5% · 30yr
- Down + closing
- —
- Monthly P&I
- —
- Monthly cashflow
- —
- DSCR
- —
- Eligible?
- —
Personal DTI + credit; lowest rate.
DSCR
20% down · 8.5% · 30yr
- Down + closing
- —
- Monthly P&I
- —
- Monthly cashflow
- —
- DSCR
- —
- Eligible?
- —
No personal income docs; deal must DSCR.
Hard money
10% down · 12.0% · 12mo
- Down + closing
- —
- Monthly P&I
- —
- Monthly cashflow
- —
- DSCR
- —
- Eligible?
- —
Short-term bridge; refi at stabilization.
Rent comps 40 comps
| Address | Beds | Baths | Sqft | Rent | $/sqft | DOM | Units | Dist |
|---|---|---|---|---|---|---|---|---|
| 1880 N Ocean Dr Unit TS705 Hallandale Beach, FL | 2.0 | 2.0 | 1350 | $4,900 | $3.63 | 16d | 1 | 0.09mi |
| 1880 N Ocean Dr Unit TS705 Hallandale Beach, FL | 2.0 | 2.0 | 1350 | $5,000 | $3.70 | 18d | 1 | 0.09mi |
| 1880 N Ocean Dr Unit TS705 Hallandale Beach, FL | 2.0 | 2.0 | 1350 | $5,000 | $3.70 | 25d | 1 | 0.09mi |
| 1850 S Ocean Dr #2909 Hallandale Beach, FL | 2.0 | 1.0 | 1086 | $4,050 | $3.73 | 25d | 1 | 0.10mi |
| 1850 S Ocean Dr #3509 Hallandale Beach, FL | 2.0 | 1.0 | 1086 | $4,300 | $3.96 | 25d | 1 | 0.10mi |
| 1850 S Ocean Dr #4009 Hallandale Beach, FL | 2.0 | 1.0 | 1086 | $3,900 | $3.59 | 25d | 1 | 0.10mi |
| 1850 S Ocean Dr #3509 Hallandale Beach, FL | 2.0 | 1.0 | 1086 | $4,000 | $3.68 | 4d | 1 | 0.10mi |
| 1830 S Ocean Dr #1610 Hallandale Beach, FL | 2.0 | 2.0 | 1337 | $6,500 | $4.86 | 25d | 1 | 0.12mi |
| 1830 S Ocean Dr #2410 Hallandale Beach, FL | 2.0 | 2.0 | 1337 | $5,500 | $4.11 | 9d | 1 | 0.12mi |
| 1830 S Ocean Dr #3605 Hallandale Beach, FL | 1.0 | 1.0 | 811 | $4,500 | $5.55 | 4d | 1 | 0.12mi |
| 1830 S Ocean Dr #3210 Hallandale Beach, FL | 2.0 | 2.0 | 1337 | $5,300 | $3.96 | 25d | 1 | 0.12mi |
| 1830 S Ocean Dr #3910 Hallandale Beach, FL | 2.0 | 2.0 | 1337 | $8,000 | $5.98 | 25d | 1 | 0.12mi |
| 1830 S Ocean Dr #1812 Hallandale Beach, FL | 1.0 | 1.0 | 844 | $4,999 | $5.92 | 22d | 1 | 0.12mi |
| 1830 S Ocean Dr #3510 Hallandale Beach, FL | 2.0 | 2.0 | 1337 | $5,500 | $4.11 | 6d | 1 | 0.12mi |
| 1830 S Ocean Dr #3510 Hallandale Beach, FL | 2.0 | 2.0 | 1337 | $5,900 | $4.41 | 12d | 1 | 0.12mi |
| 1830 S Ocean Dr #1808 Hallandale Beach, FL | 2.0 | 2.0 | 1458 | $7,500 | $5.14 | 16d | 1 | 0.12mi |
| 1830 S Ocean Dr #4006 Hallandale Beach, FL | 2.0 | 2.0 | 1458 | $5,500 | $3.77 | 11d | 1 | 0.12mi |
| 1830 S Ocean Dr #2010 Hallandale Beach, FL | 2.0 | 2.0 | 1337 | $8,500 | $6.36 | 25d | 1 | 0.12mi |
| 1830 S Ocean Dr #1806 Hallandale Beach, FL | 2.0 | 2.0 | 1458 | $5,000 | $3.43 | 21d | 1 | 0.12mi |
| 1830 S Ocean Dr #3208 Hallandale Beach, FL | 2.0 | 2.0 | 1458 | $4,500 | $3.09 | 25d | 1 | 0.12mi |
| 1830 S Ocean Dr #1709 Hallandale Beach, FL | 1.0 | 1.0 | 844 | $4,500 | $5.33 | 25d | 1 | 0.12mi |
| 1830 S Ocean Dr #2409 Hallandale Beach, FL | 1.0 | 1.0 | 844 | $4,300 | $5.09 | 16d | 1 | 0.12mi |
| 1830 S Ocean Dr #4710 Hallandale Beach, FL | 2.0 | 2.0 | 1337 | $6,000 | $4.49 | 25d | 1 | 0.12mi |
| 1830 S Ocean Dr #4307 Hallandale Beach, FL | 1.0 | 1.0 | 871 | $4,100 | $4.71 | 25d | 1 | 0.12mi |
| 1830 S Ocean Dr #2412 Hallandale Beach, FL | 1.0 | 1.0 | 844 | $3,600 | $4.27 | 11d | 1 | 0.12mi |
| 1830 S Ocean Dr #4612 Hallandale Beach, FL | 1.0 | 1.0 | 844 | $4,950 | $5.86 | 25d | 1 | 0.12mi |
| 1830 S Ocean Dr #3407 Hallandale Beach, FL | 1.0 | 1.0 | 871 | $4,000 | $4.59 | 25d | 1 | 0.12mi |
| 1830 S Ocean Dr #2806 Hallandale Beach, FL | 2.0 | 2.0 | 1458 | $6,300 | $4.32 | 25d | 1 | 0.12mi |
| 1830 S Ocean Dr #3208 Hallandale Beach, FL | 2.0 | 2.0 | 1458 | $4,500 | $3.09 | 11d | 1 | 0.12mi |
| 1830 S Ocean Dr #4810 Hallandale Beach, FL | 2.0 | 2.0 | 1337 | $5,500 | $4.11 | 21d | 1 | 0.12mi |
| 1830 S Ocean Dr #1706 Hallandale Beach, FL | 2.0 | 2.0 | 1458 | $6,500 | $4.46 | 9d | 1 | 0.12mi |
| 1830 S Ocean Dr #3909 Hallandale Beach, FL | 1.0 | 1.0 | 844 | $5,000 | $5.92 | 25d | 1 | 0.12mi |
| 1830 S Ocean Dr #4712 Hallandale Beach, FL | 1.0 | 1.0 | 844 | $3,950 | $4.68 | 25d | 1 | 0.12mi |
| 1830 S Ocean Dr #4412 Hallandale Beach, FL | 1.0 | 1.0 | 844 | $4,500 | $5.33 | 9d | 1 | 0.12mi |
| 1830 S Ocean Dr #4309 Hallandale Beach, FL | 1.0 | 1.0 | 844 | $3,900 | $4.62 | 25d | 1 | 0.12mi |
| 1830 S Ocean Dr #4212 Hallandale Beach, FL | 1.0 | 1.0 | 844 | $3,800 | $4.50 | 25d | 1 | 0.12mi |
| 1830 S Ocean Dr #1107 Hallandale Beach, FL | 1.0 | 1.0 | 871 | $3,750 | $4.31 | 25d | 1 | 0.12mi |
| 1830 S Ocean Dr #4005 Hallandale Beach, FL | 1.0 | 1.0 | 811 | $4,600 | $5.67 | 25d | 1 | 0.12mi |
| 1830 S Ocean Dr #2108 Hallandale Beach, FL | 2.0 | 2.0 | 1458 | $7,300 | $5.01 | 25d | 1 | 0.12mi |
| 1830 S Ocean Dr #4709 Hallandale Beach, FL | 1.0 | 1.0 | 844 | $3,800 | $4.50 | 4d | 1 | 0.12mi |
HOA detail condo
- Monthly dues
- $978 · $11,736/yr
- Likely covers
- waterpoolgym
- Assessments
- None detected in remarks — confirm with the listing agent.
Listing history 34 events
-
2026-06-21days on market $357,000 Active 163 DOM
-
2026-06-18days on market $357,000 Active 160 DOM
-
2026-06-17days on market $357,000 Active 159 DOM
-
2026-06-16days on market $357,000 Active 158 DOM
-
2026-06-15days on market $357,000 Active 157 DOM
-
2026-06-13days on market $357,000 Active 155 DOM
-
2026-06-09days on market $357,000 Active 151 DOM
-
2026-06-07days on market $357,000 Active 149 DOM
-
2026-06-04days on market $357,000 Active 146 DOM
-
2026-06-03days on market $357,000 Active 145 DOM
-
2026-06-02days on market $357,000 Active 144 DOM
-
2026-06-01days on market $357,000 Active 143 DOM
-
2026-05-31days on market $357,000 Active 142 DOM
-
2026-01-09$357,000 Active
-
2019-04-27historical
-
2019-03-19$260,000 Active
-
2019-03-18historical
-
2019-02-21$260,000 Active
-
2018-01-10soldstatus $230,000
-
2018-01-03soldstatus $230,000 Sold
-
2017-12-11status Pending
-
2017-08-17price $265,000
-
2017-06-29price $250,000
-
2017-06-13price $264,500
-
2017-03-28price $269,900
-
2017-03-09price $274,500
-
2017-01-17price $279,000
-
2015-11-09price $289,000
-
2015-11-09price $28,900
-
2015-10-16$259,000 Active
-
2012-12-03soldstatus $158,000
-
2012-11-27soldstatus $158,000
-
2003-12-26soldstatus $167,000
-
1971-04-01soldstatus $32,500
ⓘ Source: listings_history table (triggers on properties + properties_extension) + one-shot
backfill from property_details.listing_events for pre-trigger history.
Tax reassessment forecast FL · Resets to sale price
- Current annual tax
- $6,323 · $527/mo
- Projected year-2 tax
- $6,323 · $527/mo
- Expected delta
- $0/yr ($0/mo · 0.0%)
ⓘ Screening estimate from a state-policy table — verify with the county assessor before closing.
Climate risk First Street
- Flood 8/10 Severe FEMA zone AE · 98% chance over 30 yrs
- Wildfire 1/10 Low
- Heat 10/10 Extreme 6 d/yr ≥104°F today · 22 d/yr by 30 yrs out
- Wind 10/10 Extreme 99% chance of damaging wind over 30 yrs
- Air quality 2/10 Low 1 unhealthy d/yr today · 2 by 30 yrs out
Nearby sold comps map
Loading sold comps map…
Walkable amenities ~0.75 mi
Loading nearby amenities…
Taxation est. · year 1
- Rental income
- $54,966
- − Mortgage interest
- −$19,998
- − Property taxes
- −$6,323
- − Insurance
- −$6,904
- − Repairs & maintenance
- −$4,397
- − Management
- −$4,397
- − HOA
- −$11,736
- − Depreciation
- −$10,385
- Taxable loss
- −$9,173
- Est. tax savings @ 24.0%
- +$2,202
- After-tax cash flow
- $-1,803/yr
For passive investors: Depreciation is non-cash, so a rental often shows a tax loss while cash-flowing — sheltering income. Rental losses are passive: they offset passive income freely, and up to $25,000/yr can offset ordinary (W-2) income if you actively participate and your MAGI is under $100k (phasing out to $0 by $150k); unused losses carry forward. On sale, claimed depreciation is recaptured at up to 25%, and gains may owe capital-gains tax (a 1031 exchange can defer both). Figures are a year-1 estimate at your 24.0% rate — not tax advice; consult a CPA.
Schools (NCES district)
- District
- Broward
- NCES district ID
- 1200180
- Math proficiency
- 42% ▼ -18.00%
- Reading proficiency
- 53% ▼ -5.00%
- Median HH income
- $52,139
- Composite
- 40.88/100
- National rank
- #3621
- State rank
- #46 of 73 in FL
Livability — Hallandale Beach
- Score
- 81/100
- State rank
- #86
- US rank
- #1400
Category grades
Schools grade is shown separately in the Schools card above.
Census & demographics
- Census place
- Hallandale Beach, FL
- County
- Broward County · 1,963,430 people
- City population
- 44,021
- Metro
- Miami-Fort Lauderdale-Pompano Beach, FL
- Population (ZIP)
- 44,502
- Household income
- $52,079
- Rent vs Own
- Severe rent burden
- 3293.0
Population outlook (Broward County) Hauer SSP2
- Today (2025)
- 2,207,033 people
- By 2030
- 2,360,704 · +7.0%
- By 2040
- 2,661,208 · +20.6%
- By 2050
- 2,946,698 · +33.5%
- By 2075
- 3,602,273 · +63.2%
- By 2100
- 3,970,984 · +79.9%
Race, ethnicity, and origin ACS 2023
- Neighborhood character
- Diverse neighborhood (Simpson 0.67)
- Race & ethnicity
- Hispanic / Latino 39% White 39% Two or more races 24% Black 17% Asian 1%
- Hispanic origin (detail)
- Mexican 2% Puerto Rican 3% Cuban 9% Dominican 3% Salvadoran 2%
- Common ancestry
- Scotch-Irish 5% Hispanic 5% Subsaharan African 3%
- Foreign-born
- 51% · Canada, Jamaica, Dominican Republic
- Languages at home
- 38% English-only · Spanish 36% Russian/Polish/Slavic 12% French/Haitian/Cajun 7%
Political lean MEDSL · Broward
- 2024 margin
- D (+17.0) · D 58.0% · R 41.0%
- 2008→2024 swing
- -17.8pp toward R · 2008: 34.7pp · 2024: 17.0pp
- All cycles
- 2024: D+17.0 2020: D+29.8 2016: D+35.0 2012: D+34.9 2008: D+34.7
Not yet ingested
- Civics
- —
Market trends
- HPI YoY
- ▼ -299.13%
- Current HPI
- 329.9081
- Rent YoY
- ▲ 0.43%
- Metro
- Miami-Fort Lauderdale-Pompano Beach, FL
- State GDP YoY
- ▲ 3.28%
- F500 in state
- 36
Industry mix (Fortune 500 HQ in FL)
| Industry | F500 HQs | Revenue |
|---|---|---|
| Industrial Technology | 2 | $29B |
|
||
| Insurance | 2 | $17B |
|
||
| Retail | 1 | $60B |
|
||
| Technology Distribution | 1 | $58B |
|
||
| Homebuilding | 1 | $35B |
|
||
| Technology Manufacturing | 1 | $35B |
|
||
Price history
+998.5% since first listed21 events — show timeline
- 2026-01-09 Listed $357,000 MARMLS
- 2019-04-27 Listing Removed — MARMLS
- 2019-03-19 Listed $260,000 MARMLS
- 2019-03-18 Listing Removed — MARMLS
- 2019-02-21 Listed $260,000 MARMLS
- 2018-01-10 Sold (Public Records) $230,000 Public Records
- 2018-01-03 Sold (MLS) $230,000 MARMLS
- 2017-12-11 Pending — MARMLS
- 2017-08-17 Price Changed $265,000 MARMLS
- 2017-06-29 Price Changed $250,000 MARMLS
- 2017-06-13 Price Changed $264,500 MARMLS
- 2017-03-28 Price Changed $269,900 MARMLS
- 2017-03-09 Price Changed $274,500 MARMLS
- 2017-01-17 Price Changed $279,000 MARMLS
- 2015-11-09 Price Changed $28,900 MARMLS
- 2015-11-09 Price Changed $289,000 MARMLS
- 2015-10-16 Listed $259,000 MARMLS
- 2012-12-03 Sold (MLS) $158,000 MARMLS
- 2012-11-27 Sold (Public Records) $158,000 Public Records
- 2003-12-26 Sold (Public Records) $167,000 Public Records
- 1971-04-01 Sold (Public Records) $32,500 Public Records
Property tax history
+7.9%/yrLatest (2025): $6,323 · +6.4% YoY. Source: county tax records.
Cash-flow waterfall
monthlySold comps — $/sqft
last 12 mo · ≤1 miLoading sold comps…