 Multi-family
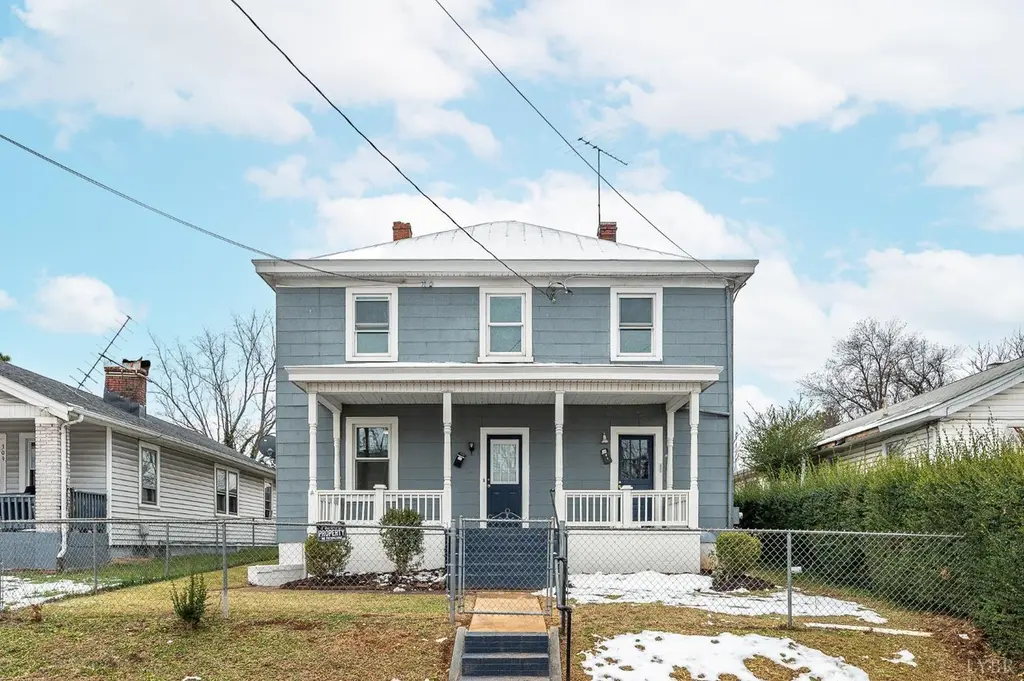
307 Saint Augustine St · Lynchburg, VA
Flood risk 1/10 · Minimal
- FEMA flood zone
- X (unshaded)
- Chance of flooding over 30 yrs
- 0.0%
- Est. flood insurance / yr
- $473 – $860
Fire risk 3/10 · Minor
- Est. fire insurance / yr
- $666 – $1,236
Heat risk 6/10 · Moderate
- Hot days now (above 101°F)
- 7 days/yr
- Hot days in 30 yrs
- 18 days/yr
Wind risk 2/10 · Minimal
- Chance of severe wind over 30 yrs
- 2.0%
Air-quality risk 2/10 · Minimal
- Unhealthy air days now
- 0 days/yr
- Unhealthy air days in 30 yrs
- 1 days/yr
Risk factors via First Street. Map © Google.
Why this score? — see what drove the B+ grade
The composite is a weighted blend of 9 inputs, each scored 0–100. Each bar is that input's sub-score; the figure is the points it added to the 100-point composite (weight × sub-score).
- Cash flow +30.0/30.0
- ARV discount +13.4/15.0
- DSCR +10.0/10.0
- 1% rule +8.4/10.0
- Livability +4.5/5.0
- Schools +4.0/10.0
- Rent growth +2.8/5.0
- Condition / age +2.5/5.0
- Appreciation +0.0/10.0
$174,900
🖨 Deal sheet (PDF) 📄 Offer letter ✓ Due diligence
Multi-family units
County records classify this as Multi-Family (2-4 Unit). Listing-text estimate: 1 unit. estimate disagrees with records
Listing remarks
This home offers exceptional potential, whether used as an income-producing duplex, live on one side and rent the other, or easily converted into a spacious single-family residence. The property features two generously sized kitchens with all appliances conveying, four large bedrooms, and two expansive living rooms that could serve as additional fifth and sixth bedrooms (one includes a closet). Two full baths are conveniently located, one on each level. Recent updates include fresh interior and exterior paint, new light fixtures, and main-level laundry. Outside, enjoy a fenced yard, new landscaping, and ample off-street parking. Opportunities like this at this price point are rare. Schedule
Key facts
- Two kitchens
- New landscaping
- Fenced yard
Tags
Property features AI
Finance
- Other: Lot approximately 0.1391 acres
Exterior
- Security: Smoke detectors
- Utilities: Public water; Public sewer
- Home design: Single family residence; 2 stories
- Construction: Asbestos and block construction; Metal roof; Partial basement
- Exterior features: Garden; Porch; Fenced yard; Storm doors
Interior
- Kitchen: Refrigerator; Gas range
- Flooring: Hardwood; Vinyl; Wood
- Bathrooms: 2 full bathrooms
- Heating & cooling: Forced air heating; Window unit cooling
- Interior features: Storm windows; Partial walk-out basement
- Laundry & utility: Main level laundry room with washer hookup; Electric water heater
Neighborhood map
What this means for you Summary
Snapshot
- This is a 4-bed/2.0-bath multifamily listed at $175k.
Deal economics
- At list price, monthly cash flow is $761 ($9k/yr) — positive.
- The deal already cash-flows at list — no discount required.
- Meets the 1% rule at list price ($2k rent vs $175k).
- Recommended offer: $170k (3.0% below list) — sets the bar for market timing.
- Cap rate 11.5% vs local median 4.0% in Lynchburg — top-decile yield for the area; either an underpriced asset or a hidden risk that comps aren't pricing in. Stress-test before assuming the spread holds.
Location & tenants
- Location reads 91/100 on livability (#1 in VA, #58 nationally) — a professional / high-income tenant draw. Strengths: amenities A+, commute A+, cost of living A+; Watch: crime C-, employment D+.
- Lynchburg City Public School District (urban): math 36% / reading 61% proficiency, ranked #104 of 131 in VA (top 79%) — families likely to look elsewhere, expect single-tenant / working-renter base with shorter leases; 61% free/reduced lunch — lower-income household profile, screen leases tightly.
- Zoned schools: T.C. Miller Elementary School For Innovation (math 32% / reading 42%, grade F, #933 of 1,108 statewide, top 86%, 208 students, 99% FRL); Paul Laurence Dunbar Middle For Innovation (math 37% / reading 66%, grade C, #222 of 342 statewide, top 65%, 531 students, 95% FRL); E.C. Glass High (math 42% / reading 84%, grade B-, #223 of 319 statewide, top 70%, 1,325 students, 92% FRL) — zoned schools average 95% FRL vs 61% district-wide (34 pts higher); higher-poverty schools than district average — tighter screening recommended.
- Market conditions: Rents rising (+1.1%/yr); 221 active listings in the ZIP; 17 comparable units currently listed for rent nearby; rentals at typical pace (median 24d on market — plan ~3-4 weeks tenant-placement turnaround); 41% of comp listings sitting > 30 days — soft ceiling on asking rent; lower-income renter base — watch delinquency; 472 units permitted in Lynchburg city in 2024 (240 in 5+ unit buildings).
Forward outlook
- Local home prices are declining (-3.0%/yr); year-one equity from $1k of loan paydown is wiped out by about $5k of value loss. Plan a longer hold.
- Lynchburg County population projected at +37% by 2050 — long-run rental-demand tailwind backs the buy-and-hold thesis.
- At projected returns (-3.0% appreciation + 1.1% rent growth), your $49k cash investment doubles in ~8 years — after that, you're playing with house money.
Negotiation context
- It's been on market 52 days — a 3% lower offer ($170k) is reasonable based on typical stale-listing flexibility.
- 2 sale attempts with the ask held roughly flat each time — persistent listings suggest the price (not the market) is what's stuck; bring a comps-based counter.
- Current owner paid $93k; list at $175k implies a 88% gain — meaningful room to come down on a strong offer.
Risks & watch-outs
- Watch-outs: built in 1923 — expect roof / HVAC / electrical / plumbing capex.
- Climate carrying-cost: extreme-heat days projected 7→18/yr by 2055 (HVAC capex compounding) — expect insurance premiums to compound above CPI over the hold.
Questions for the listing agent
- It's been on market 52 days. Have you received any prior offers? Is the seller open to a 3% concession, seller financing, or rate buy-down credit?
- Built in 1923 — when were the roof, HVAC, electrical panel, plumbing, and water heater last replaced?
- Is there a deadline driving the sale (1031 exchange, divorce, estate, relocation)? That informs how much negotiation room exists.
- Schools are A-rated — typically a magnet for longer-tenancy family renters. What's the average tenant stay here, and is there a school-zone premium baked into asking?
- What's the average days-on-market for RENTAL listings here right now (not sales)? A rising rental-DOM trend means longer vacancies and softer asking-rent achievability than the comps imply.
- What's the recent tenant-quality profile in this submarket — average credit score on applications, eviction rate, late-payment / NSF rate, and stable-employment percentage? A property-management company in the area should have these aggregated.
- How much new apartment / multifamily construction is in the pipeline within 1–3 miles? Heavy new supply (>2% of stock underway) typically softens rents 12–24 months out; light construction supports rent growth.
Investment metrics
- 1% rule
- 1.34% ✓
- Cap rate
- 11.51%
- Cash-on-cash
- 18.64%
- DSCR
- 1.83
- GRM
- 6.2
CMA / ARV
- ARV (median comp)
- $201,547
- List price
- $174,900
- Delta
- -13.22%
- Verdict
- UNDERPRICED
- Comps
- 20 within 1.0 mi
Show comp detail 9 sales within ~0.75 mi
| Address | Dist | Beds/Ba | Sqft | Sold | Price | $/sf | Match |
|---|---|---|---|---|---|---|---|
| 510 Stuart St | 0.53mi | 4/— | 2,181 (+4%) | 9mo | $227,000 | $104 | 61 |
| 608 Euclid Ave | 0.20mi | 4/— | 1,872 (-11%) | 14mo | $241,900 | $129 | 61 |
| 1223 Garfield Ave | 0.43mi | 4/— | 2,088 (-0%) | 23mo | $204,000 | $98 | 60 |
| 1511 Campbell Ave | 0.58mi | 4/— | 2,082 (-1%) | 17mo | $102,000 | $49 | 57 |
| 1310 Garfield Ave | 0.48mi | 3/— (-1) | 1,958 (-7%) | 8mo | $115,000 | $59 | 55 |
| 206 Wadsworth St | 0.23mi | 5/— (+1) | 1,850 (-12%) | 12mo | $263,000 | $142 | 55 |
| 1329 Campbell Ave | 0.52mi | 4/— | 1,912 (-9%) | 10mo | $130,000 | $68 | 53 |
| 2916 Langhorne Rd | 0.50mi | 4/— | 1,897 (-10%) | 21mo | $126,530 | $67 | 43 |
| 1219 Garfield Ave | 0.43mi | 4/— | 2,374 (+13%) | 20mo | $100,000 | $42 | 42 |
Match score weights: distance 35% · size 25% · config 20% · recency 20%. Top-matched comps best support the ARV.
Projected returns pro-forma
-3.0% appreciation · 1.15% rent growth · sell at horizon
- IRR
- 8.4%
- Equity multiple
- 1.32×
- Total profit
- $15,777
- Equity at exit
- $26,078
- IRR
- 16.1%
- Equity multiple
- 2.21×
- Total profit
- $59,015
- Equity at exit
- $15,122
Cash invested: $48,972 (down + closing). Projections, not guarantees.
Landlord ↔ Tenant lean methodology
- Overall (STATE)
- 55 Moderately Landlord-Leaning
- State Virginia
- 55 Moderately Landlord-Leaning · D+2
- County
- — inherits STATE
- City
- — inherits STATE
ZIP-level market 24501
- Rents YoY
- 1.1%
- Active inventory
- 221
- Price-to-rent
- 12.4×
Monthly cashflow live
- Estimated rent
- $2,346 high interval (Pro) →
- Mortgage (P&I)
- −$917
- Tax from tax record
- −$103 /mo · $1,232/yr
- Insurance
- −$73
- HOA
- −$0
- Lot rent
- −$0
- Vacancy / Maint / Mgmt
- −$493
- Net cashflow
- $761
Break-even live
Sensitivity live
| Price | -10% $860 | -5% $810 | +0% $761 | +5% $711 | +10% $662 |
|---|---|---|---|---|---|
| Rent | -10% $575 | -5% $668 | +0% $761 | +5% $853 | +10% $946 |
| Rate | -1.0pp $849 | -0.5pp $805 | base $761 | +0.5pp $715 | +1.0pp $669 |
2-unit breakdown (identical units grouped — click to expand)
| Units | Beds | Baths | Est. rent |
|---|---|---|---|
| 2× units | 2 | 1 | $2,346 |
| #1 | 2 | 1 | $1,173 |
| #2 | 2 | 1 | $1,173 |
| Total (2 units) | $2,346 | ||
UW: 25.0% down · 7.5% · 30yr · 1.5% tax · 5.0% vac · 8.0% maint · 8.0% mgmt
Financing live
Cash to close
- Down payment
- $43,725
- Closing costs
- $5,247
- Reserves months
- —
- Total cash needed
- —
Loan-product check · same deal, 3 products live
Conventional
25% down · 7.5% · 30yr
- Down + closing
- —
- Monthly P&I
- —
- Monthly cashflow
- —
- DSCR
- —
- Eligible?
- —
Personal DTI + credit; lowest rate.
DSCR
20% down · 8.5% · 30yr
- Down + closing
- —
- Monthly P&I
- —
- Monthly cashflow
- —
- DSCR
- —
- Eligible?
- —
No personal income docs; deal must DSCR.
Hard money
10% down · 12.0% · 12mo
- Down + closing
- —
- Monthly P&I
- —
- Monthly cashflow
- —
- DSCR
- —
- Eligible?
- —
Short-term bridge; refi at stabilization.
Rent comps 17 comps
| Address | Beds | Baths | Sqft | Rent | $/sqft | DOM | Units | Dist |
|---|---|---|---|---|---|---|---|---|
| 320 Kenyon St Lynchburg, VA | 3.0 | 2.0 | 1736 | $1,595 | $0.92 | 46d | 1 | 0.04mi |
| 403 Grove St Lynchburg, VA | 3.0 | 2.0 | 1400 | $1,600 | $1.14 | 46d | 1 | 0.24mi |
| 630 Park Ln Lynchburg, VA | 4.0 | 1.5 | 1434 | $1,895 | $1.32 | 15d | 1 | 0.39mi |
| 2920 Richmond St Lynchburg, VA | 4.0 | 1.0 | 1472 | $1,695 | $1.15 | 23d | 1 | 0.48mi |
| 310 Yeardley Ave Lynchburg, VA | 4.0 | 2.5 | 1888 | $1,800 | $0.95 | 23d | 1 | 0.63mi |
| 209 Munford St Lynchburg, VA | 3.0 | 2.5 | 1420 | $1,497 | $1.05 | 46d | 1 | 0.81mi |
| 101 Thomas Rd Unit A Lynchburg, VA | 3.0 | 1.0 | 1530 | $1,395 | $0.91 | 46d | 1 | 0.82mi |
| 800 Pierce St Lynchburg, VA | 4.0 | 1.0 | 1714 | $1,295 | $0.76 | 46d | 1 | 0.84mi |
| 206 Connecticut Ave Lynchburg, VA | 4.0 | 2.5 | 2180 | $1,650 | $0.76 | 23d | 1 | 0.86mi |
| 1514 Fillmore St Lynchburg, VA | 3.0 | 2.5 | 1560 | $1,800 | $1.15 | 15d | 1 | 0.91mi |
| 1518 Fillmore St Lynchburg, VA | 3.0 | 2.5 | 1560 | $1,800 | $1.15 | 15d | 1 | 0.92mi |
| 1110 11th St Lynchburg, VA | 3.0 | 1.5 | 2000 | $1,450 | $0.72 | 15d | 1 | 1.07mi |
| 812 Taylor St Lynchburg, VA | 3.0 | 2.0 | 1872 | $1,950 | $1.04 | 15d | 1 | 1.07mi |
| 1701 Grace St Lynchburg, VA | 4.0 | 2.0 | 2173 | $1,495 | $0.69 | 15d | 1 | 1.23mi |
| 2121 Langhorne Rd Unit 11011559SF 3BR/2BA Lynchburg, VA | 3.0 | 2.0 | 1559 | $1,695 | $1.09 | 23d | 1 | 1.27mi |
| 1316 Harrison St Lynchburg, VA | 3.0 | 1.5 | 1535 | $1,500 | $0.98 | 46d | 1 | 1.36mi |
| 1309 Radcliff Ave Lynchburg, VA | 4.0 | 2.5 | 1658 | $1,725 | $1.04 | 46d | 1 | 1.43mi |
Listing history 23 events
-
2026-06-21days on market $174,900 Active 52 DOM
-
2026-06-19days on market $174,900 Active 50 DOM
-
2026-06-18days on market $174,900 Active 49 DOM
-
2026-06-17days on market $174,900 Active 48 DOM
-
2026-06-16days on market $174,900 Active 47 DOM
-
2026-06-15days on market $174,900 Active 46 DOM
-
2026-06-14days on market $174,900 Active 44 DOM
-
2026-06-13pricedays on market $174,900 Active 43 DOM
-
2026-06-10days on market $179,900 Active 41 DOM
-
2026-06-09days on market $179,900 Active 40 DOM
-
2026-06-08days on market $179,900 Active 39 DOM
-
2026-06-07days on market $179,900 Active 38 DOM
-
2026-06-03days on market $179,900 Active 34 DOM
-
2026-06-02days on market $179,900 Active 33 DOM
-
2026-06-01days on market $179,900 Active 32 DOM
-
2026-05-31days on market $179,900 Active 31 DOM
-
2026-05-30days on market $179,900 Active 30 DOM
-
2026-04-30$179,900 Active 758-char remark
-
2025-12-16$179,900 Active
-
2012-03-12soldstatus $93,240
-
2011-01-31soldstatus $58,500
-
1994-08-01soldstatus $240,000
-
1990-05-04soldstatus $32,500
ⓘ Source: listings_history table (triggers on properties + properties_extension) + one-shot
backfill from property_details.listing_events for pre-trigger history.
Tax reassessment forecast VA · Resets to sale price
- Current annual tax
- $1,232 · $103/mo
- Projected year-2 tax
- $1,434 · $120/mo
- Expected delta
- +$202/yr (+$17/mo · 16.4%)
ⓘ Screening estimate from a state-policy table — verify with the county assessor before closing.
Climate risk First Street
- Flood 1/10 Low FEMA zone X (unshaded) · 0% chance over 30 yrs
- Wildfire 3/10 Moderate
- Heat 6/10 Major 7 d/yr ≥101°F today · 18 d/yr by 30 yrs out
- Wind 2/10 Low 2% chance of damaging wind over 30 yrs
- Air quality 2/10 Low 0 unhealthy d/yr today · 1 by 30 yrs out
Nearby sold comps map
Loading sold comps map…
Walkable amenities ~0.75 mi
Loading nearby amenities…
Taxation est. · year 1
- Rental income
- $28,152
- − Mortgage interest
- −$9,797
- − Property taxes
- −$1,232
- − Insurance
- −$874
- − Repairs & maintenance
- −$2,252
- − Management
- −$2,252
- − Depreciation
- −$5,088
- Taxable income
- $6,656
- Est. tax owed @ 24.0%
- −$1,597
- After-tax cash flow
- $7,530/yr
For passive investors: Depreciation is non-cash, so a rental often shows a tax loss while cash-flowing — sheltering income. Rental losses are passive: they offset passive income freely, and up to $25,000/yr can offset ordinary (W-2) income if you actively participate and your MAGI is under $100k (phasing out to $0 by $150k); unused losses carry forward. On sale, claimed depreciation is recaptured at up to 25%, and gains may owe capital-gains tax (a 1031 exchange can defer both). Figures are a year-1 estimate at your 24.0% rate — not tax advice; consult a CPA.
Schools (NCES district)
- District
- Lynchburg City Public School District
- NCES district ID
- 5102340
- Math proficiency
- 36% ▼ -38.00%
- Reading proficiency
- 61% ▼ -8.00%
- Median HH income
- $39,097
- Composite
- 40.4/100
- National rank
- #3730
- State rank
- #104 of 131 in VA
Livability — Lynchburg
- Score
- 91/100
- State rank
- #1
- US rank
- #58
Category grades
Schools grade is shown separately in the Schools card above.
Census & demographics
- Census place
- Lynchburg, VA
- County
- Lynchburg City · 97,036 people
- City population
- 97,036
- Metro
- Lynchburg, VA
- Population (ZIP)
- 25,006
- Household income
- $42,222
- Rent vs Own
- Severe rent burden
- 1717.0
Population outlook (Lynchburg County) Hauer SSP2
- Today (2025)
- 87,977 people
- By 2030
- 93,626 · +6.4%
- By 2040
- 106,145 · +20.7%
- By 2050
- 120,783 · +37.3%
- By 2075
- 162,249 · +84.4%
- By 2100
- 191,358 · +117.5%
Race, ethnicity, and origin ACS 2023
- Neighborhood character
- Diverse neighborhood (Simpson 0.55)
- Race & ethnicity
- White 58% Black 34% Two or more races 4% Hispanic / Latino 3%
- Common ancestry
- Slovak 1% Italian 1% Serbian 1%
- Foreign-born
- 3% · Canada
- Languages at home
- 96% English-only · Spanish 2%
Political lean MEDSL · Lynchburg
- 2024 margin
- Lean R (+7.9) · D 45.4% · R 53.3% · Other 1.3%
- 2008→2024 swing
- -3.9pp toward R · 2008: -4.0pp · 2024: -7.9pp
- All cycles
- 2024: R+7.9 2020: D+2.6 2016: R+9.0 2012: R+10.6 2008: R+4.0
Not yet ingested
- Civics
- —
Market trends
- HPI YoY
- ▼ -131.06%
- Current HPI
- 223.6839
- Rent YoY
- ▲ 1.15%
- Metro
- Lynchburg, VA
- State GDP YoY
- ▲ 2.40%
- F500 in state
- 50
Industry mix (Fortune 500 HQ in VA)
| Industry | F500 HQs | Revenue |
|---|---|---|
| Aerospace / Defense | 4 | $236B |
|
||
| Technology / Defense | 3 | $32B |
|
||
| Financial Services | 2 | $176B |
|
||
| Utilities | 2 | $27B |
|
||
| Insurance | 2 | $25B |
|
||
| Technology | 2 | $15B |
|
||
Price history
+438.2% since first listed7 events — show timeline
- 2026-06-11 Price Changed $174,900 LMLS
- 2026-04-30 Listed $179,900 LMLS
- 2025-12-16 Listed $179,900 LMLS
- 2012-03-12 Sold (Public Records) $93,240 Public Records
- 2011-01-31 Sold (Public Records) $58,500 Public Records
- 1994-08-01 Sold (Public Records) $240,000 Public Records
- 1990-05-04 Sold (Public Records) $32,500 Public Records
Property tax history
+2.8%/yrLatest (2025): $1,232 · +37.0% YoY. Source: county tax records.
Cash-flow waterfall
monthlySold comps — $/sqft
last 12 mo · ≤1 miLoading sold comps…