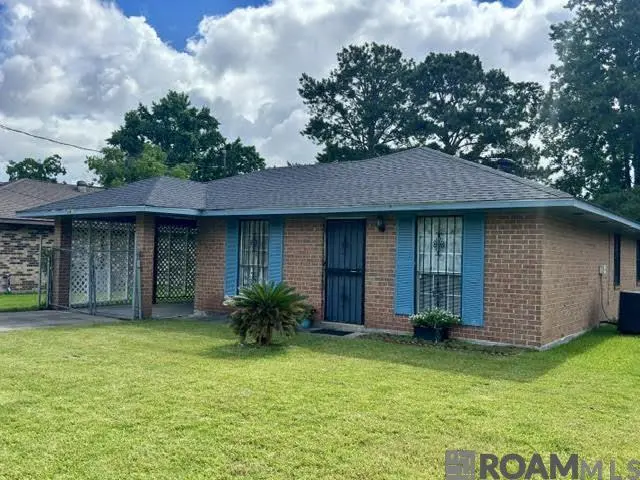
861 Old Rafe Meyer Rd · Baker, LA
Flood risk 1/10 · Minimal
- FEMA flood zone
- X (unshaded)
- Chance of flooding over 30 yrs
- 0.0%
- Est. flood insurance / yr
- $507 – $1,088
Fire risk 1/10 · Minimal
- Est. fire insurance / yr
- $1,269 – $2,357
Heat risk 8/10 · Major
- Hot days now (above 108°F)
- 7 days/yr
- Hot days in 30 yrs
- 20 days/yr
Wind risk 9/10 · Severe
- Chance of severe wind over 30 yrs
- 99.0%
Air-quality risk 2/10 · Minimal
- Unhealthy air days now
- 1 days/yr
- Unhealthy air days in 30 yrs
- 2 days/yr
Risk factors via First Street. Map © Google.
Why this score? — see what drove the B grade
The composite is a weighted blend of 9 inputs, each scored 0–100. Each bar is that input's sub-score; the figure is the points it added to the 100-point composite (weight × sub-score).
- Cash flow +26.8/30.0
- ARV discount +15.0/15.0
- DSCR +9.2/10.0
- 1% rule +6.3/10.0
- Appreciation +4.6/10.0
- Livability +3.3/5.0
- Rent growth +2.5/5.0
- Condition / age +2.5/5.0
- Schools +2.4/10.0
$125,000
🖨 Deal sheet (PDF) 📄 Offer letter ✓ Due diligence
Listing remarks
Well maintained 3 bedroom brick home with spacious yard. Large living room with adjoining dining space with built in bar with seating. Kitchen with double stainless sink, plenty of cabinets & pantry. Spacious additional bedrooms. Primary bedroom with private half bath. Other features include no carpet large indoor laundry, covered carport & additional utility/storage. Conveniently located near interstate access. Would make a great home or investment
Key facts
- Spacious yard
- Built in bar
- Private half bath
Tags
Property features AI
Finance
- Other: Located in the Lincoln Heights subdivision
Exterior
- Parking: Carport; Driveway; Concrete parking surfaces
- Utilities: Public water; Public sewer
- Home design: Detached single-family residence; Residential property
- Construction: Brick construction; Slab foundation; Built area approximately 1397
- Exterior features: Partial chain-link fencing
Interior
- Kitchen: Range, Oven, Electric cooktop, Refrigerator
- Flooring: Tile, Ceramic tile, Laminate
- Bathrooms: 1 full bathroom; 1 half bathroom
- Heating & cooling: Central heating; Central air conditioning
- Interior features: Range, Oven, Electric cooktop, Refrigerator; Tile, Ceramic tile and Laminate flooring
Neighborhood map
What this means for you Summary
Snapshot
- This is a 3-bed/1.5-bath single-family listed at $125k.
Deal economics
- At list price, monthly cash flow is $342 ($4k/yr) — positive.
- The deal already cash-flows at list — no discount required.
- Meets the 1% rule at list price ($1k rent vs $125k).
- Cap rate 9.6% vs local median 4.5% in Baker — top-decile yield for the area; either an underpriced asset or a hidden risk that comps aren't pricing in. Stress-test before assuming the spread holds.
Location & tenants
- Location reads 66/100 on livability (#131 in LA) — a middle-class / working-renter tenant base. Strengths: cost of living A+, housing A; Watch: schools C-, crime D+, amenities F.
- East Baton Rouge Parish (urban): math 22% / reading 34% proficiency, ranked #47 of 98 in LA (top 48%) — low school quality limits family demand, transient renter base, plan for 1-2y turnover; 77% free/reduced lunch — lower-income household profile, screen leases tightly.
- Market conditions: 101 active listings in the ZIP; lower-income renter base — watch delinquency; 2,252 units permitted in East Baton Rouge Parish in 2024 (440 in 5+ unit buildings).
- At $1,407/mo this rent would consume 61% of the median local household income ($28k/yr) (locally 1092% of renters already pay >50% of income on rent) — very limited rent-growth headroom before tenants either downsize or default.
Forward outlook
- Local home prices are declining (-0.9%/yr); year-one equity from $864 of loan paydown is wiped out by about $1k of value loss. Plan a longer hold.
- East Baton Rouge County population projected at +4% by 2050 — modest demand growth; plan on rents tracking national, not racing it.
- At projected returns (-0.9% appreciation + 3.0% rent growth), your $35k cash investment doubles in ~7 years — after that, you're playing with house money.
Negotiation context
- Only 9 days on market — expect competitive offers; lowballing is unlikely to land.
Risks & watch-outs
- Climate carrying-cost: severe wind risk, 99% chance of damaging wind over 30y; extreme-heat days projected 7→20/yr by 2055 (HVAC capex compounding) — expect insurance premiums to compound above CPI over the hold.
Questions for the listing agent
- Is there a deadline driving the sale (1031 exchange, divorce, estate, relocation)? That informs how much negotiation room exists.
- Crime grade is D in this area — have there been break-ins, vandalism, or insurance claims at this property in the last 3 years? What carrier currently insures it and at what premium?
- What's the average days-on-market for RENTAL listings here right now (not sales)? A rising rental-DOM trend means longer vacancies and softer asking-rent achievability than the comps imply.
- What's the recent tenant-quality profile in this submarket — average credit score on applications, eviction rate, late-payment / NSF rate, and stable-employment percentage? A property-management company in the area should have these aggregated.
- How much new for-sale + rental construction is in the pipeline within 1–3 miles? Heavy new supply typically softens prices + rents 12–24 months out; constrained supply supports both.
Investment metrics
- 1% rule
- 1.13% ✓
- Cap rate
- 9.57%
- Cash-on-cash
- 11.72%
- DSCR
- 1.52
- GRM
- 7.4
CMA / ARV
- ARV (on-the-fly)
- $195,223
- Comps found
- 4
Show comp detail 4 sales within ~0.75 mi
| Address | Dist | Beds/Ba | Sqft | Sold | Price | $/sf | Match |
|---|---|---|---|---|---|---|---|
| 13309 Abraham Dr | 0.05mi | 3/2.0 | 1,200 (+3%) | 1mo | $60,000 | $50 | 90 |
| 817 Netterville St | 0.16mi | 3/2.0 | 1,321 (+13%) | 1mo | $224,500 | $170 | 68 |
| 13414 Lincoln Dr | 0.12mi | 3/2.0 | 1,290 (+10%) | 14mo | $215,000 | $167 | 63 |
| 13526 Lincoln Dr | 0.15mi | 3/2.0 | 1,290 (+10%) | 22mo | $215,000 | $167 | 56 |
Match score weights: distance 35% · size 25% · config 20% · recency 20%. Top-matched comps best support the ARV.
Projected returns pro-forma
-0.87% appreciation · 3.0% rent growth · sell at horizon
- IRR
- 8.3%
- Equity multiple
- 1.37×
- Total profit
- $13,045
- Equity at exit
- $30,947
- IRR
- 14.3%
- Equity multiple
- 2.43×
- Total profit
- $50,174
- Equity at exit
- $33,160
Cash invested: $35,000 (down + closing). Projections, not guarantees.
Landlord ↔ Tenant lean methodology
- Overall (STATE)
- 90 Strongly Landlord-Friendly
- State Louisiana
- 90 Strongly Landlord-Friendly · R+12
- County
- — inherits STATE
- City
- — inherits STATE
ZIP-level market 70807
- Home prices YoY
- -1.1%
- Active inventory
- 101
- Price-to-rent
- 7.4×
Monthly cashflow live
- Estimated rent
- $1,407 medium interval (Pro) →
- Mortgage (P&I)
- −$656
- Tax from tax record
- −$63 /mo · $751/yr
- Insurance
- −$52
- HOA
- −$0
- Vacancy / Maint / Mgmt
- −$296
- Net cashflow
- $342
Break-even live
Sensitivity live
| Price | -10% $413 | -5% $377 | +0% $342 | +5% $306 | +10% $271 |
|---|---|---|---|---|---|
| Rent | -10% $231 | -5% $286 | +0% $342 | +5% $397 | +10% $453 |
| Rate | -1.0pp $405 | -0.5pp $374 | base $342 | +0.5pp $309 | +1.0pp $276 |
UW: 25.0% down · 7.5% · 30yr · 1.5% tax · 5.0% vac · 8.0% maint · 8.0% mgmt
Financing live
Cash to close
- Down payment
- $31,250
- Closing costs
- $3,750
- Reserves months
- —
- Total cash needed
- —
Loan-product check · same deal, 3 products live
Conventional
25% down · 7.5% · 30yr
- Down + closing
- —
- Monthly P&I
- —
- Monthly cashflow
- —
- DSCR
- —
- Eligible?
- —
Personal DTI + credit; lowest rate.
DSCR
20% down · 8.5% · 30yr
- Down + closing
- —
- Monthly P&I
- —
- Monthly cashflow
- —
- DSCR
- —
- Eligible?
- —
No personal income docs; deal must DSCR.
Hard money
10% down · 12.0% · 12mo
- Down + closing
- —
- Monthly P&I
- —
- Monthly cashflow
- —
- DSCR
- —
- Eligible?
- —
Short-term bridge; refi at stabilization.
Listing history 8 events
-
2026-06-19status $125,000 Pending 9 DOM
-
2026-06-18days on market $125,000 Active 9 DOM
-
2026-06-17days on market $125,000 Active 8 DOM
-
2026-06-16days on market $125,000 Active 7 DOM
-
2026-06-15days on market $125,000 Active 6 DOM
-
2026-06-14days on market $125,000 Active 4 DOM
-
2026-06-09remarks 457-char remark
-
2026-06-09$125,000 Active 1 DOM
ⓘ Source: listings_history table (triggers on properties + properties_extension) + one-shot
backfill from property_details.listing_events for pre-trigger history.
Tax reassessment forecast LA · Resets to sale price
- Current annual tax
- $751 · $63/mo
- Projected year-2 tax
- $751 · $63/mo
- Expected delta
- $0/yr ($0/mo · 0.0%)
ⓘ Screening estimate from a state-policy table — verify with the county assessor before closing.
Climate risk First Street
- Flood 1/10 Low FEMA zone X (unshaded) · 0% chance over 30 yrs
- Wildfire 1/10 Low
- Heat 8/10 Severe 7 d/yr ≥108°F today · 20 d/yr by 30 yrs out
- Wind 9/10 Extreme 99% chance of damaging wind over 30 yrs
- Air quality 2/10 Low 1 unhealthy d/yr today · 2 by 30 yrs out
Nearby sold comps map
Loading sold comps map…
Walkable amenities ~0.75 mi
Loading nearby amenities…
Taxation est. · year 1
- Rental income
- $16,890
- − Mortgage interest
- −$7,002
- − Property taxes
- −$751
- − Insurance
- −$625
- − Repairs & maintenance
- −$1,351
- − Management
- −$1,351
- − Depreciation
- −$3,636
- Taxable income
- $2,173
- Est. tax owed @ 24.0%
- −$522
- After-tax cash flow
- $3,579/yr
For passive investors: Depreciation is non-cash, so a rental often shows a tax loss while cash-flowing — sheltering income. Rental losses are passive: they offset passive income freely, and up to $25,000/yr can offset ordinary (W-2) income if you actively participate and your MAGI is under $100k (phasing out to $0 by $150k); unused losses carry forward. On sale, claimed depreciation is recaptured at up to 25%, and gains may owe capital-gains tax (a 1031 exchange can defer both). Figures are a year-1 estimate at your 24.0% rate — not tax advice; consult a CPA.
Schools (NCES district)
- District
- East Baton Rouge Parish
- NCES district ID
- 2200540
- Math proficiency
- 22% ▼ -36.00%
- Reading proficiency
- 34% ▼ -31.00%
- Median HH income
- $46,263
- Composite
- 24.14/100
- National rank
- #7745
- State rank
- #47 of 98 in LA
Livability — Baker
- Score
- 66/100
- State rank
- #131
- US rank
- #12021
Category grades
Schools grade is shown separately in the Schools card above.
Census & demographics
- County
- East Baton Rouge Parish · 399,686 people
- City population
- 17,433
- Metro
- Baton Rouge, LA
- Population (ZIP)
- 15,300
- Household income
- $27,534
- Rent vs Own
- Severe rent burden
- 1092.0
Population outlook (East Baton Rouge County) Hauer SSP2
- Today (2025)
- 464,810 people
- By 2030
- 472,137 · +1.6%
- By 2040
- 480,243 · +3.3%
- By 2050
- 484,422 · +4.2%
- By 2075
- 492,069 · +5.9%
- By 2100
- 476,347 · +2.5%
Race, ethnicity, and origin ACS 2023
- Neighborhood character
- Predominantly Black (91%)
- Race & ethnicity
- Black 91% Two or more races 6% White 3%
- Common ancestry
- Lithuanian 1%
- Foreign-born
- 1% · Canada
Political lean MEDSL · East Baton Rouge
- 2024 margin
- D (+11.1) · D 54.5% · R 43.4% · Other 2.1%
- 2008→2024 swing
- +8.9pp toward D · 2008: 2.2pp · 2024: 11.1pp
- All cycles
- 2024: D+11.1 2020: D+13.1 2016: D+9.2 2012: D+5.2 2008: D+2.2
Not yet ingested
- Civics
- —
Market trends
- HPI YoY
- ▼ -0.87%
- Current HPI
- 78.3629
- Rent YoY
- —
- Metro
- Baton Rouge, LA
- State GDP YoY
- ▲ 3.29%
- F500 in state
- 10
Industry mix (Fortune 500 HQ in LA)
| Industry | F500 HQs | Revenue |
|---|---|---|
| Telecommunications | 2 | $23B |
|
||
| Utilities | 1 | $12B |
|
||
| Wholesale / Distribution | 1 | $5B |
|
||
| Advertising | 1 | $2B |
|
||
Price history
2 events — show timeline
- 2026-06-08 Listed $125,000 GBRMLS
- 1985-02-14 Sold (Public Records) — Public Records
Property tax history
+30.1%/yrLatest (2025): $751 · -0.4% YoY. Source: county tax records.
Cash-flow waterfall
monthlySold comps — $/sqft
last 12 mo · ≤1 miLoading sold comps…