 🏷️ Likely Rental
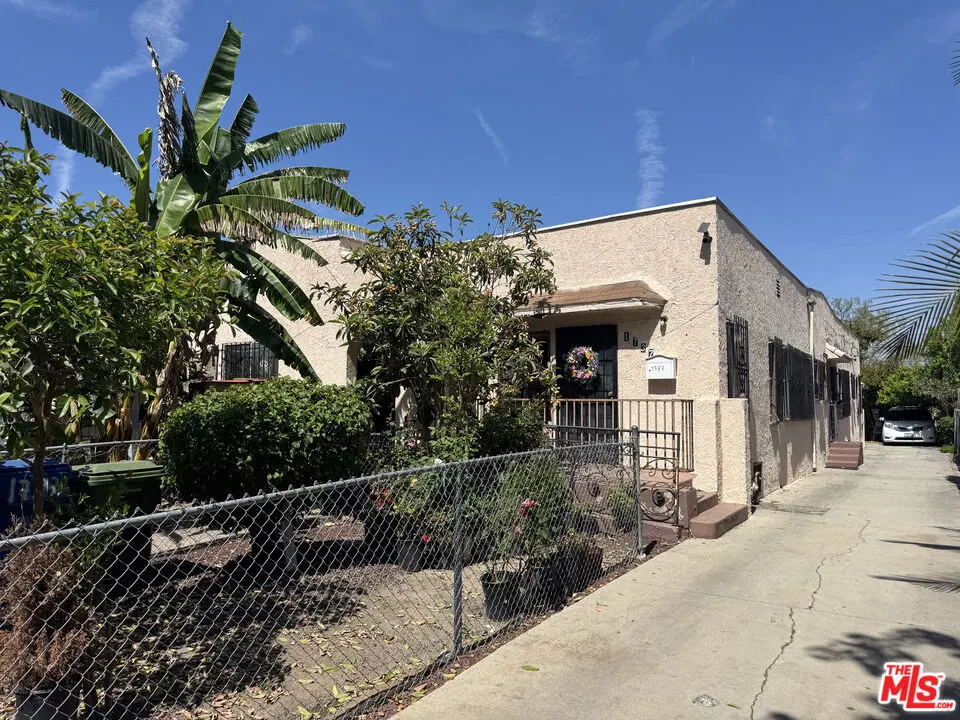
1737 W 37th Dr · Los Angeles, CA
Flood risk 1/10 · Minimal
- FEMA flood zone
- X (shaded)
- Chance of flooding over 30 yrs
- 0.0%
- Est. flood insurance / yr
- $507 – $1,088
Fire risk 1/10 · Minimal
- Est. fire insurance / yr
- $659 – $1,223
Heat risk 6/10 · Moderate
- Hot days now (above 87°F)
- 7 days/yr
- Hot days in 30 yrs
- 22 days/yr
Wind risk 1/10 · Minimal
- Chance of severe wind over 30 yrs
- —
Air-quality risk 5/10 · Moderate
- Unhealthy air days now
- 7 days/yr
- Unhealthy air days in 30 yrs
- 7 days/yr
Risk factors via First Street. Map © Google.
Why this score? — see what drove the C+ grade
The composite is a weighted blend of 9 inputs, each scored 0–100. Each bar is that input's sub-score; the figure is the points it added to the 100-point composite (weight × sub-score).
- Cash flow +22.2/30.0
- ARV discount +15.0/15.0
- DSCR +7.1/10.0
- 1% rule +4.8/10.0
- Schools +3.6/10.0
- Livability +3.4/5.0
- Rent growth +2.8/5.0
- Condition / age +2.5/5.0
- Appreciation +0.0/10.0
$575,000
🖨 Deal sheet (PDF) 📄 Offer letter ✓ Due diligence
Multi-family units
County records classify this as Multi-Family (2-4 Unit). Listing-text estimate: 2 units. confirmed
Listing remarks MLS
Situated in a high-demand pocket of South Los Angeles near USC and Exposition Park, this investment property is being sold with long-term tenants already in place, offering you immediate income from day one. Location adds another layer of long-term upside potential, with consistent rental demand driven by proximity to educational institutions, transit and amenities. Featuring side-by-side 2-bedroom, 1-bath units, this duplex shares a single common wall and an appealing, tenant-friendly layout. Detached two-bay garage in the rear is accessed by a long driveway, and there's an additional paved parking pad for off-street flexibility. Whether you're establishing a foothold for your property portfolio or looking to expand into a desirable Los Angeles submarket, this duplex is the opportunity you've been looking for.
Key facts
- 6,074 sq ft lot
- 2 garage spots
- Built 1924
Tags
Neighborhood map
What this means for you Summary
Snapshot
- This is a 2 × 2-bed/1.0-bath units multifamily listed at $575k.
Deal economics
- At list price, monthly cash flow is $939 ($11k/yr) — positive. Per door: $469/mo.
- The deal already cash-flows at list — no discount required.
- To meet the 1% rule (rent ≥ 1% of price), the offer needs to be $562k (2.2% below list).
- Recommended offer: $562k (2.2% below list) — sets the bar for 1% rule.
- Cap rate 8.3% vs local median 2.1% in Los Angeles — top-decile yield for the area; either an underpriced asset or a hidden risk that comps aren't pricing in. Stress-test before assuming the spread holds.
Location & tenants
- Location reads 68/100 on livability (#273 in CA) — a middle-class / working-renter tenant base. Strengths: amenities A+, commute A+, employment B; Watch: health & safety C-, crime F, cost of living F.
- Los Angeles Unified (urban): math 29% / reading 54% proficiency, ranked #223 of 517 in CA (top 43%) — families likely to look elsewhere, expect single-tenant / working-renter base with shorter leases; 67% free/reduced lunch — lower-income household profile, screen leases tightly.
- Zoned schools: Birdielee V. Bright Elementary (404 students, 92% FRL); Manual Arts Senior High (math 12% / reading 22%, grade F, #1,032 of 1,170 statewide, top 88%, 1,026 students, 97% FRL) — zoned schools average 95% FRL vs 67% district-wide (27 pts higher); higher-poverty schools than district average — tighter screening recommended.
- Zoned-school proficiency averages 17% at this address vs 42% district-wide (-24 pts) — the specific schools serving this property underperform the Los Angeles Unified average; the district grade overstates school quality for this exact location.
- Market conditions: Rents rising (+1.1%/yr); 120 active listings in the ZIP; 29 comparable units currently listed for rent nearby; rentals at typical pace (median 27d on market — plan ~3-4 weeks tenant-placement turnaround); 45% of comp listings sitting > 30 days — soft ceiling on asking rent; 19,697 units permitted in Los Angeles County in 2024 (9,426 in 5+ unit buildings).
- At $5,623/mo this rent would consume 107% of the median local household income ($63k/yr) (locally 3780% of renters already pay >50% of income on rent) — very limited rent-growth headroom before tenants either downsize or default.
Forward outlook
- Local home prices are declining (-3.0%/yr); year-one equity from $4k of loan paydown is wiped out by about $17k of value loss. Plan a longer hold.
- Los Angeles County population projected at +9% by 2050 — modest demand growth; plan on rents tracking national, not racing it.
Negotiation context
- It's been on market 23 days — a 2% lower offer ($566k) is reasonable based on typical stale-listing flexibility.
- Current owner paid $110k; list at $575k implies a 423% gain — meaningful room to come down on a strong offer.
Risks & watch-outs
- Watch-outs: built in 1924 — expect roof / HVAC / electrical / plumbing capex.
- Climate carrying-cost: extreme-heat days projected 7→22/yr by 2055 (HVAC capex compounding) — expect insurance premiums to compound above CPI over the hold.
Questions for the listing agent
- Can we see the unit-by-unit rent roll, current vacancy, and any below-market leases? What's the average tenancy length?
- What capital expenditures (roof, boiler, parking lot, exteriors) have been made in the last 5 years, and what's planned in the next 2?
- Built in 1924 — when were the roof, HVAC, electrical panel, plumbing, and water heater last replaced?
- Is there a deadline driving the sale (1031 exchange, divorce, estate, relocation)? That informs how much negotiation room exists.
- Schools are D-rated, which usually means shorter tenancies and higher turnover. Who's the typical renter profile here, and what's been the actual vacancy rate?
- Crime grade is F in this area — have there been break-ins, vandalism, or insurance claims at this property in the last 3 years? What carrier currently insures it and at what premium?
- What's the average days-on-market for RENTAL listings here right now (not sales)? A rising rental-DOM trend means longer vacancies and softer asking-rent achievability than the comps imply.
- What's the recent tenant-quality profile in this submarket — average credit score on applications, eviction rate, late-payment / NSF rate, and stable-employment percentage? A property-management company in the area should have these aggregated.
- How much new apartment / multifamily construction is in the pipeline within 1–3 miles? Heavy new supply (>2% of stock underway) typically softens rents 12–24 months out; light construction supports rent growth.
Investment metrics
- 1% rule
- 0.98% ✗
- Cap rate
- 8.25%
- Cash-on-cash
- 7.00%
- DSCR
- 1.31
- GRM
- 8.5
CMA / ARV
- ARV (median comp)
- $908,481
- List price
- $575,000
- Delta
- -36.71%
- Verdict
- UNDERPRICED
- Comps
- 20 within 1.0 mi
Show comp detail 12 sales within ~0.75 mi
| Address | Dist | Beds/Ba | Sqft | Sold | Price | $/sf | Match |
|---|---|---|---|---|---|---|---|
| 1726 Leighton Ave | 0.49mi | 4/3.0 | 2,336 (-2%) | 7mo | $625,000 | $268 | 65 |
| 1801 W 39th St | 0.38mi | 5/3.0 (+1) | 2,516 (+6%) | 1mo | $1,085,000 | $431 | 62 |
| 1844 Leighton Ave | 0.56mi | 4/2.0 | 2,310 (-3%) | 9mo | $625,000 | $271 | 62 |
| 3838 Arlington Ave | 0.48mi | 4/3.0 | 2,404 (+1%) | 15mo | $960,000 | $399 | 59 |
| 1805 W 35th St | 0.38mi | 4/3.0 | 2,116 (-11%) | 2mo | $937,500 | $443 | 59 |
| 1481 W 37th St | 0.43mi | 5/2.0 (+1) | 2,554 (+8%) | 6mo | $700,000 | $274 | 57 |
| 1629 W 37th St | 0.21mi | 4/4.0 | 2,176 (-8%) | 18mo | $960,000 | $441 | 54 |
| 3553 Cimarron St | 0.42mi | 3/3.0 (-1) | 2,068 (-13%) | 6mo | $951,000 | $460 | 45 |
| 1814 Leighton Ave | 0.53mi | 4/2.0 | 2,160 (-9%) | 22mo | $830,000 | $384 | 42 |
| 3918 Halldale Ave | 0.58mi | 5/2.0 (+1) | 2,100 (-12%) | 16mo | $675,000 | $321 | 36 |
| 2717 S Hobart Blvd | 0.75mi | 3/3.0 (-1) | 2,160 (-9%) | 8mo | $760,000 | $352 | 34 |
| 1235 W 39th St | 0.71mi | 3/2.0 (-1) | 2,149 (-9%) | 20mo | $765,000 | $356 | 30 |
Match score weights: distance 35% · size 25% · config 20% · recency 20%. Top-matched comps best support the ARV.
Projected returns pro-forma
-3.0% appreciation · 1.15% rent growth · sell at horizon
- IRR
- -7.5%
- Equity multiple
- 0.73×
- Total profit
- $-43,865
- Equity at exit
- $85,734
- IRR
- -0.3%
- Equity multiple
- 0.98×
- Total profit
- $-2,669
- Equity at exit
- $49,715
Cash invested: $161,000 (down + closing). Projections, not guarantees.
Landlord ↔ Tenant lean methodology
- Overall (CITY)
- 0 Strongly Tenant-Friendly
- State California
- 18 Strongly Tenant-Friendly · D+13
- County
- — inherits STATE
- City Los Angeles
- 0 Strongly Tenant-Friendly · D+22
ZIP-level market 90018
- Rents YoY
- 1.1%
- Active inventory
- 120
- Price-to-rent
- 17.0×
Monthly cashflow live
- Estimated rent
- $5,623 high interval (Pro) →
- Mortgage (P&I)
- −$3,015
- Tax from tax record
- −$248 /mo · $2,981/yr
- Insurance
- −$240
- HOA
- −$0
- Vacancy / Maint / Mgmt
- −$1,181
- Net cashflow
- $939
Break-even live
Sensitivity live
| Price | -10% $1,264 | -5% $1,102 | +0% $939 | +5% $776 | +10% $613 |
|---|---|---|---|---|---|
| Rent | -10% $495 | -5% $717 | +0% $939 | +5% $1,161 | +10% $1,383 |
| Rate | -1.0pp $1,228 | -0.5pp $1,085 | base $939 | +0.5pp $790 | +1.0pp $638 |
2-unit breakdown (identical units grouped — click to expand)
| Units | Beds | Baths | Est. rent |
|---|---|---|---|
| 2× units | 2 | 1 | $5,622 |
| #1 | 2 | 1 | $2,811 |
| #2 | 2 | 1 | $2,811 |
| Total (2 units) | $5,623 | ||
UW: 25.0% down · 7.5% · 30yr · 1.5% tax · 5.0% vac · 8.0% maint · 8.0% mgmt
Financing live
Cash to close
- Down payment
- $143,750
- Closing costs
- $17,250
- Reserves months
- —
- Total cash needed
- —
Loan-product check · same deal, 3 products live
Conventional
25% down · 7.5% · 30yr
- Down + closing
- —
- Monthly P&I
- —
- Monthly cashflow
- —
- DSCR
- —
- Eligible?
- —
Personal DTI + credit; lowest rate.
DSCR
20% down · 8.5% · 30yr
- Down + closing
- —
- Monthly P&I
- —
- Monthly cashflow
- —
- DSCR
- —
- Eligible?
- —
No personal income docs; deal must DSCR.
Hard money
10% down · 12.0% · 12mo
- Down + closing
- —
- Monthly P&I
- —
- Monthly cashflow
- —
- DSCR
- —
- Eligible?
- —
Short-term bridge; refi at stabilization.
Rent comps 29 comps
| Address | Beds | Baths | Sqft | Rent | $/sqft | DOM | Units | Dist |
|---|---|---|---|---|---|---|---|---|
| 3780 S La Salle Ave Unit 1 Los Angeles, CA | 5.0 | 3.0 | 1870 | $4,999 | $2.67 | 0d | 1 | 0.29mi |
| 1719 W 39th Pl Los Angeles, CA | 5.0 | 3.0 | 1725 | $4,650 | $2.70 | 18d | 1 | 0.43mi |
| 3624 Arlington Ave Los Angeles, CA | 4.0 | 2.0 | 1993 | $4,150 | $2.08 | 45d | 1 | 0.45mi |
| 3908 Halldale Ave Los Angeles, CA | 5.0 | 3.0 | 1730 | $4,700 | $2.72 | 15d | 1 | 0.57mi |
| 3987 Dalton Ave Unit 1-4 Los Angeles, CA | 4.0 | 4.5 | 1650 | $4,650 | $2.82 | 45d | 1 | 0.69mi |
| 1299 W 37th Dr Unit 1 Los Angeles, CA | 5.0 | 3.0 | 1800 | $5,600 | $3.11 | 45d | 1 | 0.72mi |
| 2713 S La Salle Ave Los Angeles, CA | 4.0 | 2.5 | 1800 | $4,500 | $2.50 | 26d | 1 | 0.76mi |
| 2716 S La Salle Ave Los Angeles, CA | 3.0 | 3.0 | 2499 | $5,400 | $2.16 | 4d | 1 | 0.77mi |
| 1163 W 38th St Los Angeles, CA | 3.0 | 3.0 | 2300 | $3,420 | $1.49 | 26d | 1 | 0.80mi |
| 1265 Browning Blvd Unit 1/2 Los Angeles, CA | 4.0 | 4.0 | 1816 | $3,666 | $2.02 | 26d | 1 | 0.81mi |
| 1150 W 38th St Los Angeles, CA | 3.0–19.0 | 3.0–18.5 | 4527 | $4,969 | $1.10 | 3d | 9 | 0.83mi |
| 1224 W 35th St Los Angeles, CA | 4.0 | 4.0 | 1600 | $1,240 | $0.78 | 9d | 1 | 0.88mi |
| 1130 1/2 W 39th St Unit 1130 1/2 Los Angeles, CA | 3.0 | 3.5 | 1614 | $5,100 | $3.16 | 45d | 1 | 0.90mi |
| 1128 W 39th St Unit 1128 Los Angeles, CA | 3.0 | 3.5 | 1614 | $5,100 | $3.16 | 26d | 1 | 0.90mi |
| 3944 S Budlong Ave Unit 223-3946 1/2 Los Angeles, CA | 3.0 | 3.0 | 1793 | $3,600 | $2.01 | 45d | 1 | 0.93mi |
| 3946 S Budlong Ave Unit 1/2 Los Angeles, CA | 3.0 | 3.0 | 1793 | $3,600 | $2.01 | 45d | 1 | 0.93mi |
| 4240 Denker Ave Los Angeles, CA | 4.0 | 3.0 | 2684 | $2,500 | $0.93 | 1d | 1 | 1.00mi |
| 3986 Hepburn Ave Los Angeles, CA | 3.0 | 3.0 | 2151 | $5,250 | $2.44 | 45d | 1 | 1.01mi |
| 1766 W 25th St Los Angeles, CA | 3.0 | 2.0 | 1900 | $4,500 | $2.37 | 45d | 1 | 1.03mi |
| 1766 W 25th St Unit 2 Los Angeles, CA | 3.0 | 2.0 | 1900 | $4,500 | $2.37 | 45d | 1 | 1.03mi |
| 4284 S Hobart Blvd Los Angeles, CA | 3.0 | 1.0 | 3040 | $3,300 | $1.09 | 45d | 1 | 1.03mi |
| 4062 S Budlong Ave Unit MAIN Los Angeles, CA | 3.0 | 1.0 | 2000 | $2,950 | $1.48 | 45d | 1 | 1.10mi |
| 3940 Hubert Ave Los Angeles, CA | 3.0 | 2.5 | 1900 | $3,985 | $2.10 | 26d | 1 | 1.16mi |
| 3420 12th Ave Unit 1/2 Los Angeles, CA | 3.0 | 2.5 | 1800 | $4,799 | $2.67 | 1d | 1 | 1.28mi |
| 2017 S La Salle Ave Los Angeles, CA | 5.0 | 3.0 | 2408 | $4,995 | $2.07 | 1d | 1 | 1.32mi |
| 902 W 41st St Los Angeles, CA | 4.0 | 3.0 | 1600 | $3,480 | $2.17 | 26d | 1 | 1.36mi |
| 2640 Menlo Ave Los Angeles, CA | 2.0–9.0 | 2.0–7.5 | 2185 | $5,629 | $2.58 | 0d | 2 | 1.39mi |
| 2211 6th Ave Unit 1/2 Los Angeles, CA | 4.0 | 4.5 | 1700 | $4,800 | $2.82 | 45d | 1 | 1.40mi |
| 2652 Ellendale Pl Los Angeles, CA | 2.0–5.0 | 2.0–3.0 | 1200 | $1,517 | $1.26 | 45d | 1 | 1.46mi |
Listing history 4 events
-
2026-05-08status Pending 822-char remark
Show marketing remark (822 chars)
Situated in a high-demand pocket of South Los Angeles near USC and Exposition Park, this investment property is being sold with long-term tenants already in place, offering you immediate income from day one. Location adds another layer of long-term upside potential, with consistent rental demand driven by proximity to educational institutions, transit and amenities. Featuring side-by-side 2-bedroom, 1-bath units, this duplex shares a single common wall and an appealing, tenant-friendly layout. Detached two-bay garage in the rear is accessed by a long driveway, and there's an additional paved parking pad for off-street flexibility. Whether you're establishing a foothold for your property portfolio or looking to expand into a desirable Los Angeles submarket, this duplex is the opportunity you've been looking for.
-
2026-04-15$575,000 Active 822-char remark
Show marketing remark (822 chars)
Situated in a high-demand pocket of South Los Angeles near USC and Exposition Park, this investment property is being sold with long-term tenants already in place, offering you immediate income from day one. Location adds another layer of long-term upside potential, with consistent rental demand driven by proximity to educational institutions, transit and amenities. Featuring side-by-side 2-bedroom, 1-bath units, this duplex shares a single common wall and an appealing, tenant-friendly layout. Detached two-bay garage in the rear is accessed by a long driveway, and there's an additional paved parking pad for off-street flexibility. Whether you're establishing a foothold for your property portfolio or looking to expand into a desirable Los Angeles submarket, this duplex is the opportunity you've been looking for.
-
1987-05-08soldstatus $110,000
-
1986-07-25soldstatus $66,500
ⓘ Source: listings_history table (triggers on properties + properties_extension) + one-shot
backfill from property_details.listing_events for pre-trigger history.
Tax reassessment forecast CA · Resets to sale price
- Current annual tax
- $2,981 · $248/mo
- Projected year-2 tax
- $4,370 · $364/mo
- Expected delta
- +$1,389/yr (+$116/mo · 46.6%)
ⓘ Screening estimate from a state-policy table — verify with the county assessor before closing.
Climate risk First Street
- Flood 1/10 Low FEMA zone X (shaded) · 0% chance over 30 yrs
- Wildfire 1/10 Low
- Heat 6/10 Major 7 d/yr ≥87°F today · 22 d/yr by 30 yrs out
- Wind 1/10 Low
- Air quality 5/10 Major 7 unhealthy d/yr today · 7 by 30 yrs out
Nearby sold comps map
Loading sold comps map…
Walkable amenities ~0.75 mi
Loading nearby amenities…
Taxation est. · year 1
- Rental income
- $67,476
- − Mortgage interest
- −$32,209
- − Property taxes
- −$2,981
- − Insurance
- −$2,875
- − Repairs & maintenance
- −$5,398
- − Management
- −$5,398
- − Depreciation
- −$16,727
- Taxable income
- $1,887
- Est. tax owed @ 24.0%
- −$453
- After-tax cash flow
- $10,812/yr
For passive investors: Depreciation is non-cash, so a rental often shows a tax loss while cash-flowing — sheltering income. Rental losses are passive: they offset passive income freely, and up to $25,000/yr can offset ordinary (W-2) income if you actively participate and your MAGI is under $100k (phasing out to $0 by $150k); unused losses carry forward. On sale, claimed depreciation is recaptured at up to 25%, and gains may owe capital-gains tax (a 1031 exchange can defer both). Figures are a year-1 estimate at your 24.0% rate — not tax advice; consult a CPA.
Schools (NCES district)
- District
- Los Angeles Unified
- NCES district ID
- 0622710
- Math proficiency
- 29% ▼ -4.00%
- Reading proficiency
- 54% ▲ 10.00%
- Median HH income
- $50,403
- Composite
- 35.67/100
- National rank
- #4875
- State rank
- #223 of 517 in CA
Livability — Los Angeles
- Score
- 68/100
- State rank
- #273
- US rank
- #9237
Category grades
Schools grade is shown separately in the Schools card above.
Census & demographics
- Census place
- Los Angeles, CA
- County
- Los Angeles County · 9,444,647 people
- City population
- 3,838,149
- Metro
- Los Angeles-Long Beach-Anaheim, CA
- Population (ZIP)
- 48,745
- Household income
- $62,864
- Rent vs Own
- Severe rent burden
- 3780.0
Population outlook (Los Angeles County) Hauer SSP2
- Today (2025)
- 10,940,515 people
- By 2030
- 11,256,481 · +2.9%
- By 2040
- 11,729,929 · +7.2%
- By 2050
- 11,948,407 · +9.2%
- By 2075
- 11,818,114 · +8.0%
- By 2100
- 10,842,928 · -0.9%
Race, ethnicity, and origin ACS 2023
- Neighborhood character
- Diverse neighborhood (Simpson 0.61)
- Race & ethnicity
- Hispanic / Latino 57% Black 24% Two or more races 16% White 8% Asian 6%
- Hispanic origin (detail)
- Mexican 29%
- Common ancestry
- British 2% Italian 1%
- Foreign-born
- 37% · Canada, South Korea, China
- Languages at home
- 38% English-only · Spanish 53% Korean 3% French/Haitian/Cajun 1%
Political lean MEDSL · Los Angeles
- 2024 margin
- Solid D (+32.9) · D 64.8% · R 31.9% · Other 3.3%
- 2008→2024 swing
- -7.4pp toward R · 2008: 40.4pp · 2024: 32.9pp
- All cycles
- 2024: D+32.9 2020: D+44.2 2016: D+48.0 2012: D+40.0 2008: D+40.4
Not yet ingested
- Civics
- —
Market trends
- HPI YoY
- ▼ -812.15%
- Current HPI
- 490.9265
- Rent YoY
- ▲ 1.15%
- Metro
- Los Angeles-Long Beach-Anaheim, CA
- State GDP YoY
- ▲ 3.21%
- F500 in state
- 116
Industry mix (Fortune 500 HQ in CA)
| Industry | F500 HQs | Revenue |
|---|---|---|
| Technology | 27 | $1,492B |
|
||
| Financial Services | 3 | $174B |
|
||
| Retail | 3 | $44B |
|
||
| Insurance | 3 | $26B |
|
||
| Media / Entertainment | 2 | $115B |
|
||
| Pharmaceuticals / Biotech | 2 | $62B |
|
||
Price history
+764.7% since first listed4 events — show timeline
- 2026-05-08 Pending — TheMLS
- 2026-04-15 Listed $575,000 TheMLS
- 1987-05-08 Sold (Public Records) $110,000 Public Records
- 1986-07-25 Sold (Public Records) $66,500 Public Records
Property tax history
+1.8%/yrLatest (2025): $2,981 · +2.1% YoY. Source: county tax records.
Cash-flow waterfall
monthlySold comps — $/sqft
last 12 mo · ≤1 miLoading sold comps…