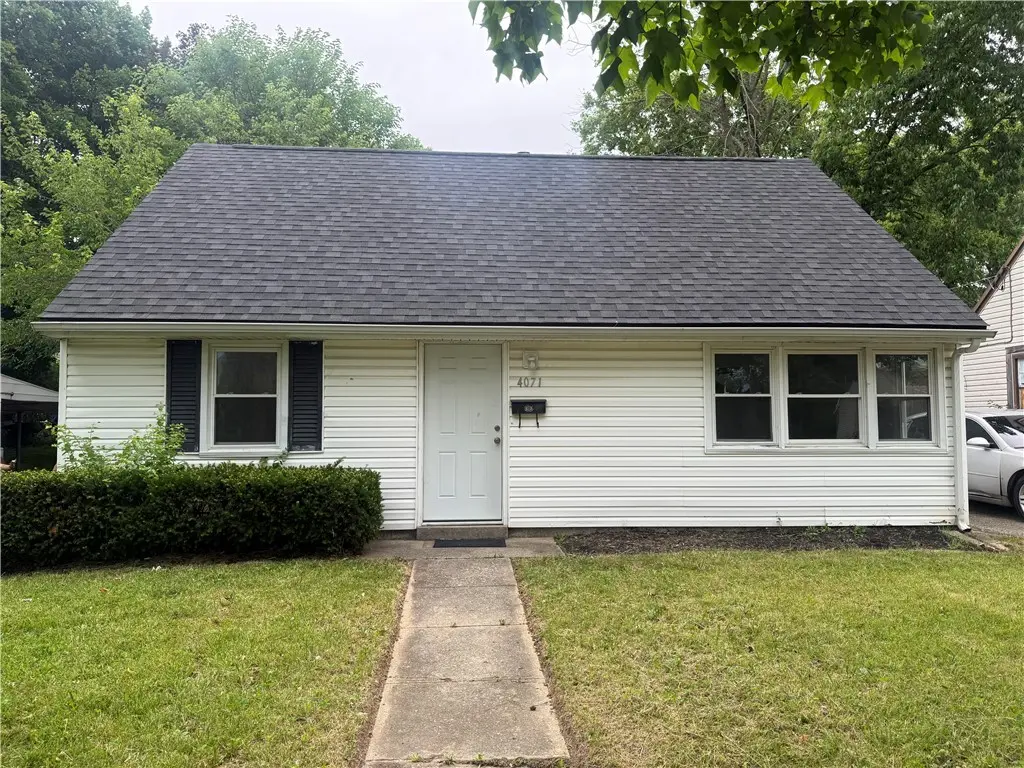
4071 Larkspur Dr · Dayton, OH
Flood risk 1/10 · Minimal
- FEMA flood zone
- X (unshaded)
- Chance of flooding over 30 yrs
- 0.0%
- Est. flood insurance / yr
- $507 – $1,088
Fire risk 1/10 · Minimal
- Est. fire insurance / yr
- $713 – $1,323
Heat risk 3/10 · Minor
- Hot days now (above 103°F)
- 7 days/yr
- Hot days in 30 yrs
- 19 days/yr
Wind risk 2/10 · Minimal
- Chance of severe wind over 30 yrs
- —
Air-quality risk 3/10 · Minor
- Unhealthy air days now
- 3 days/yr
- Unhealthy air days in 30 yrs
- 4 days/yr
Risk factors via First Street. Map © Google.
Why this score? — see what drove the C grade
The composite is a weighted blend of 9 inputs, each scored 0–100. Each bar is that input's sub-score; the figure is the points it added to the 100-point composite (weight × sub-score).
- Cash flow +25.3/30.0
- DSCR +8.3/10.0
- ARV discount +7.5/15.0
- 1% rule +5.9/10.0
- Rent growth +3.3/5.0
- Livability +3.2/5.0
- Condition / age +2.5/5.0
- Schools +1.3/10.0
- Appreciation +0.0/10.0
$99,900
🖨 Deal sheet 📄 Offer letter ✓ Due diligence
Listing remarks MLS
1,109 sq ft per PRC. EM requirements are minimum $500 for owner-occupant financed purchases and minimum $1000 or 10% for all investor and cash deals. Property being sold in AS IS condition. All offers must include pre-approval letter or verification of funds and copy of EM deposit. Offers submitted with out these items can not be sent to the seller for consideration. Counter offer/Seller addendums supersede original contract.
Key facts
- Huge backyard
- Updated flooring
- Updated kitchen
Tags
Property features AI
Finance
- Financial info: Offered for sale
Exterior
- Parking: No garage
- Utilities: Natural gas for heating; Electric power available; Public water and sewer (assumed from residential zoning and typical services)
- Home design: Single-family residence
- Construction: Vinyl siding; Slab foundation
- Exterior features: Residential zoning; Lot recorded as 6,151 sq ft (0.1412 acres)
Interior
- Kitchen: Kitchen on main level about 14 x 11
- Bedrooms: Second-floor bedroom about 14 x 11; Second-floor bedroom about 11 x 10; Main-level bedroom about 10 x 10; Main-level bedroom about 10 x 9
- Bathrooms: One full bathroom (main level)
- Heating & cooling: Central air and window unit(s) for cooling; Forced air heating using natural gas
- Interior features: Total of 6 rooms
Neighborhood map
What this means for you Summary
Snapshot
- This is a 3-bed/1.0-bath single-family listed at $100k.
Deal economics
- At list price, monthly cash flow is $228 ($3k/yr) — positive.
- The deal already cash-flows at list — no discount required.
- Meets the 1% rule at list price ($1k rent vs $100k).
- Cap rate 9.0% vs local median 7.4% in Dayton — meaningfully above typical; check what's discounted (condition, days-on-market, listing class) to confirm the premium yield is real.
Location & tenants
- Location reads 65/100 on livability (#716 in OH) — a middle-class / working-renter tenant base. Strengths: cost of living A+, housing A+, health & safety A; Watch: schools C-, amenities C-, crime F.
- Dayton City (urban): math 12% / reading 21% proficiency, ranked #641 of 656 in OH (top 98%) — low school quality limits family demand, transient renter base, plan for 1-2y turnover; 74% free/reduced lunch — lower-income household profile, screen leases tightly.
- Market conditions: Rents rising (+3.0%/yr); 156 active listings in the ZIP; 40 comparable units currently listed for rent nearby; rentals at typical pace (median 24d on market — plan ~3-4 weeks tenant-placement turnaround); lower-income renter base — watch delinquency; 907 units permitted in Montgomery County in 2024 (416 in 5+ unit buildings).
- This rent runs 31% of the median local income ($42k/yr) — at the standard rent-burdened threshold; future hikes will face affordability resistance.
Forward outlook
- Local home prices are declining (-3.0%/yr); year-one equity from $691 of loan paydown is wiped out by about $3k of value loss. Plan a longer hold.
- Montgomery County population projected at -10% by 2050 — secular population decline; favor cash flow + early exit over multi-decade hold.
Negotiation context
- Only 10 days on market — expect competitive offers; lowballing is unlikely to land.
- 3 sale attempts since 16y ago with the ask held roughly flat each time — persistent listings suggest the price (not the market) is what's stuck; bring a comps-based counter.
Risks & watch-outs
- Watch-outs: built in 1952 — expect roof / HVAC / electrical / plumbing capex.
Questions for the listing agent
- Built in 1952 — when were the roof, HVAC, electrical panel, plumbing, and water heater last replaced?
- Is there a deadline driving the sale (1031 exchange, divorce, estate, relocation)? That informs how much negotiation room exists.
- Crime grade is F in this area — have there been break-ins, vandalism, or insurance claims at this property in the last 3 years? What carrier currently insures it and at what premium?
- What's the average days-on-market for RENTAL listings here right now (not sales)? A rising rental-DOM trend means longer vacancies and softer asking-rent achievability than the comps imply.
- What's the recent tenant-quality profile in this submarket — average credit score on applications, eviction rate, late-payment / NSF rate, and stable-employment percentage? A property-management company in the area should have these aggregated.
- How much new for-sale + rental construction is in the pipeline within 1–3 miles? Heavy new supply typically softens prices + rents 12–24 months out; constrained supply supports both.
Investment metrics
- 1% rule
- 1.09% ✓
- Cap rate
- 9.03%
- Cash-on-cash
- 9.77%
- DSCR
- 1.43
- GRM
- 7.6
CMA / ARV
- ARV (on-the-fly)
- $99,810
- Comps found
- 12
Show comp detail 12 sales within ~0.75 mi
| Address | Dist | Beds/Ba | Sqft | Sold | Price | $/sf | Match |
|---|---|---|---|---|---|---|---|
| 4076 Prescott Ave | 0.04mi | 4/1.0 (+1) | 1,129 (+2%) | 6mo | $65,000 | $58 | 85 |
| 3971 Prescott Ave | 0.21mi | 3/1.0 | 1,020 (-8%) | 2mo | $77,500 | $76 | 76 |
| 4075 Middlehurst Ln | 0.12mi | 3/1.0 | 979 (-12%) | 2mo | $89,900 | $92 | 74 |
| 3920 Prescott Ave | 0.28mi | 3/1.0 | 1,020 (-8%) | 3mo | $50,000 | $49 | 71 |
| 2451 Grant Ave | 0.42mi | 3/1.0 | 1,056 (-5%) | 3mo | $75,000 | $71 | 70 |
| 3921 Middlehurst Ln | 0.30mi | 3/1.0 | 1,020 (-8%) | 4mo | $120,000 | $118 | 69 |
| 2212 Chamberlin Ave | 0.26mi | 3/1.0 | 996 (-10%) | 6mo | $110,000 | $110 | 66 |
| 2504 Grant Ave | 0.45mi | 4/1.0 (+1) | 1,056 (-5%) | 1mo | $95,000 | $90 | 65 |
| 1680 Wesleyan Rd | 0.65mi | 3/1.0 | 1,114 (+0%) | 5mo | $110,000 | $99 | 65 |
| 4647 Greenwich Village Ave | 0.53mi | 3/1.0 | 1,057 (-5%) | 5mo | $20,000 | $19 | 63 |
| 1906 Kensington Dr | 0.54mi | 3/1.0 | 1,034 (-7%) | 5mo | $82,000 | $79 | 59 |
| 4625 Saint Johns Ave | 0.54mi | 3/2.5 | 1,015 (-8%) | 6mo | $105,000 | $103 | 49 |
Match score weights: distance 35% · size 25% · config 20% · recency 20%. Top-matched comps best support the ARV.
Projected returns pro-forma
-3.0% appreciation · 3.03% rent growth · sell at horizon
- IRR
- -1.6%
- Equity multiple
- 0.94×
- Total profit
- $-1,669
- Equity at exit
- $14,895
- IRR
- 8.1%
- Equity multiple
- 1.62×
- Total profit
- $17,283
- Equity at exit
- $8,638
Cash invested: $27,972 (down + closing). Projections, not guarantees.
Landlord ↔ Tenant lean methodology
- Overall (STATE)
- 73 Landlord-Friendly
- State Ohio
- 73 Landlord-Friendly · R+6
- County
- — inherits STATE
- City
- — inherits STATE
ZIP-level market 45406
- Rents YoY
- 3.0%
- Active inventory
- 156
- Price-to-rent
- 7.6×
Monthly cashflow live
- Estimated rent
- $1,090 high interval (Pro) →
- Mortgage (P&I)
- −$524
- Tax from tax record
- −$68 /mo · $814/yr
- Insurance
- −$42
- HOA
- −$0
- Vacancy / Maint / Mgmt
- −$229
- Net cashflow
- $228
Break-even live
UW: 25.0% down · 7.5% · 30yr · 1.5% tax · 5.0% vac · 8.0% maint · 8.0% mgmt
Financing live
Cash to close
- Down payment
- $24,975
- Closing costs
- $2,997
- Reserves months
- —
- Total cash needed
- —
Loan-product check · same deal, 3 products live
Conventional
25% down · 7.5% · 30yr
- Down + closing
- —
- Monthly P&I
- —
- Monthly cashflow
- —
- DSCR
- —
- Eligible?
- —
Personal DTI + credit; lowest rate.
DSCR
20% down · 8.5% · 30yr
- Down + closing
- —
- Monthly P&I
- —
- Monthly cashflow
- —
- DSCR
- —
- Eligible?
- —
No personal income docs; deal must DSCR.
Hard money
10% down · 12.0% · 12mo
- Down + closing
- —
- Monthly P&I
- —
- Monthly cashflow
- —
- DSCR
- —
- Eligible?
- —
Short-term bridge; refi at stabilization.
Rent comps 40 comps
| Address | Beds | Baths | Sqft | Rent | $/sqft | DOM | Units | Dist |
|---|---|---|---|---|---|---|---|---|
| 4446 Waymire Ave Dayton, OH | 3.0 | 1.0 | 1100 | $1,100 | $1.00 | 21d | 1 | 0.31mi |
| 2408 Falmouth Ave Dayton, OH | 2.0 | 1.0 | 806 | $950 | $1.18 | 23d | 1 | 0.36mi |
| 1720 Kings Mill Ct Dayton, OH | 2.0 | 1.5 | 975 | $925 | $0.95 | 23d | 1 | 0.39mi |
| 3537 Otterbein Ave Unit d Dayton, OH | 2.0 | 1.0 | 900 | $925 | $1.03 | 43d | 1 | 0.46mi |
| 1732 Harold Dr Dayton, OH | 2.0 | 1.0 | 805 | $925 | $1.15 | 43d | 1 | 0.49mi |
| 2609 Fairport Ave Dayton, OH | 3.0 | 1.0 | 1000 | $1,025 | $1.02 | 2d | 1 | 0.51mi |
| 4629 Queens Ave Dayton, OH | 2.0 | 1.0 | 900 | $1,100 | $1.22 | 43d | 1 | 0.52mi |
| 3650 Otterbein Ave Unit 3650 Dayton, OH | 2.0 | 1.0 | 900 | $800 | $0.89 | 2d | 1 | 0.52mi |
| 3652 Otterbein Ave Unit 3652 Dayton, OH | 2.0 | 1.0 | 700 | $800 | $1.14 | 2d | 1 | 0.52mi |
| 3311 Otterbein Ave Dayton, OH | 3.0 | 1.5 | 1004 | $1,300 | $1.29 | 11d | 1 | 0.58mi |
| 3668 Karwin Dr Unit 3672 Dayton, OH | 2.0 | 1.0 | 1500 | $995 | $0.66 | 23d | 1 | 0.63mi |
| 3672 Karwin Dr Unit 3672 Dayton, OH | 2.0 | 1.0 | 1500 | $995 | $0.66 | 43d | 1 | 0.63mi |
| 3552 Stanford Pl Unit 3552 Dayton, OH | 2.0 | 1.0 | 800 | $800 | $1.00 | 43d | 1 | 0.69mi |
| 3552 Stanford Pl Dayton, OH | 2.0 | 1.0 | 800 | $800 | $1.00 | 23d | 1 | 0.69mi |
| 2002 Val Vista Ct Dayton, OH | 3.0 | 1.0 | 975 | $1,095 | $1.12 | 21d | 1 | 0.71mi |
| 2014 Hickorydale Dr Unit 2016 Dayton, OH | 2.0 | 1.0 | 800 | $900 | $1.12 | 43d | 1 | 0.76mi |
| 2109 Victoria Ave Dayton, OH | 2.0 | 1.0 | 714 | $950 | $1.33 | 3d | 1 | 0.78mi |
| 3207 Cornell Dr Dayton, OH | 3.0 | 1.0 | 1168 | $1,000 | $0.86 | 3d | 1 | 0.85mi |
| 5112 W Hillcrest Ave Unit 1 Dayton, OH | 3.0 | 1.0 | 972 | $700 | $0.72 | 23d | 1 | 0.89mi |
| 3007 Cornell Dr Dayton, OH | 2.0 | 1.0 | 827 | $1,000 | $1.21 | 3d | 1 | 0.93mi |
| 3711 Pittsburg Ave Dayton, OH | 2.0 | 1.0 | 800 | $875 | $1.09 | 43d | 1 | 1.04mi |
| 1927 Burroughs Dr Dayton, OH | 3.0 | 2.0 | 1409 | $1,245 | $0.88 | 14d | 1 | 1.04mi |
| 3220 Princeton Dr Dayton, OH | 3.0 | 1.0 | 900 | $1,000 | $1.11 | 43d | 1 | 1.07mi |
| 1207 W Fairview Ave Dayton, OH | 2.0 | 1.0 | 1023 | $825 | $0.81 | 43d | 1 | 1.15mi |
| 1207 W Fairview Ave Dayton, OH | 2.0 | 1.0 | 1023 | $825 | $0.81 | 3d | 1 | 1.15mi |
| 2247 Salem Ave Unit 2249 Dayton, OH | 3.0 | 1.5 | 1300 | $1,400 | $1.08 | 43d | 1 | 1.19mi |
| 2247 Salem Ave Unit 2247 Dayton, OH | 3.0 | 1.5 | 1300 | $1,350 | $1.04 | 3d | 1 | 1.19mi |
| 3222 Athens Ave Unit C Dayton, OH | 2.0 | 1.0 | 700 | $700 | $1.00 | 43d | 1 | 1.20mi |
| 2232 Salem Ave Dayton, OH | 3.0 | 1.0 | 1250 | $1,200 | $0.96 | 3d | 1 | 1.20mi |
| 829 Uhrig Ave Unit 3 Dayton, OH | 2.0 | 1.0 | 760 | $875 | $1.15 | 14d | 1 | 1.23mi |
| 1816 N James H McGee Blvd Apt B Dayton, OH | 3.0 | 1.0 | 950 | $1,150 | $1.21 | 43d | 1 | 1.25mi |
| 1816 N James H McGee Blvd Unit C Dayton, OH | 3.0 | 1.0 | 950 | $1,150 | $1.21 | 2d | 1 | 1.25mi |
| 1816 N James H McGee Blvd Apt A Dayton, OH | 3.0 | 1.0 | 950 | $1,200 | $1.26 | 2d | 1 | 1.25mi |
| 1004 W Fairview Ave Dayton, OH | 2.0 | 1.0 | 1053 | $950 | $0.90 | 23d | 1 | 1.27mi |
| 4576 Live Oak Dr Dayton, OH | 3.0 | 1.0 | 864 | $1,400 | $1.62 | 43d | 1 | 1.28mi |
| 1019 Cherry Dr Dayton, OH | 4.0 | 1.0 | 1057 | $1,125 | $1.06 | 43d | 1 | 1.32mi |
| 3858 Haney Rd Dayton, OH | 2.0 | 1.0 | 850 | $825 | $0.97 | 2d | 1 | 1.32mi |
| 4132 Natchez Ave Dayton, OH | 3.0 | 1.5 | 991 | $1,250 | $1.26 | 3d | 1 | 1.35mi |
| 3031 Garvin Rd Unit C Dayton, OH | 2.0 | 2.0 | 1269 | $1,150 | $0.91 | 43d | 1 | 1.40mi |
| 920 Huron Ave Dayton, OH | 2.0 | 1.0 | 950 | $995 | $1.05 | 3d | 1 | 1.44mi |
Listing history 9 events
-
2026-06-18days on market $99,900 Active 10 DOM
-
2026-06-17days on market $99,900 Active 9 DOM
-
2026-06-16days on market $99,900 Active 8 DOM
-
2026-06-15days on market $99,900 Active 7 DOM
-
2026-06-14days on market $99,900 Active 5 DOM
-
2026-06-13days on market $99,900 Active 4 DOM
-
2026-06-10days on market $99,900 Active 2 DOM
-
2026-06-09remarks 355-char remark
-
2026-06-09$99,900 Active 1 DOM
ⓘ Source: listings_history table (triggers on properties + properties_extension) + one-shot
backfill from property_details.listing_events for pre-trigger history.
Tax reassessment forecast OH · Partial reset (capped growth)
- Current annual tax
- $814 · $68/mo
- Projected year-2 tax
- $1,186 · $99/mo
- Expected delta
- +$372/yr (+$31/mo · 45.7%)
ⓘ Screening estimate from a state-policy table — verify with the county assessor before closing.
Climate risk First Street
- Flood 1/10 Low FEMA zone X (unshaded) · 0% chance over 30 yrs
- Wildfire 1/10 Low
- Heat 3/10 Moderate 7 d/yr ≥103°F today · 19 d/yr by 30 yrs out
- Wind 2/10 Low
- Air quality 3/10 Moderate 3 unhealthy d/yr today · 4 by 30 yrs out
Nearby sold comps map
Loading sold comps map…
Walkable amenities ~0.75 mi
Loading nearby amenities…
Taxation est. · year 1
- Rental income
- $13,080
- − Mortgage interest
- −$5,596
- − Property taxes
- −$814
- − Insurance
- −$500
- − Repairs & maintenance
- −$1,046
- − Management
- −$1,046
- − Depreciation
- −$2,906
- Taxable income
- $1,171
- Est. tax owed @ 24.0%
- −$281
- After-tax cash flow
- $2,452/yr
For passive investors: Depreciation is non-cash, so a rental often shows a tax loss while cash-flowing — sheltering income. Rental losses are passive: they offset passive income freely, and up to $25,000/yr can offset ordinary (W-2) income if you actively participate and your MAGI is under $100k (phasing out to $0 by $150k); unused losses carry forward. On sale, claimed depreciation is recaptured at up to 25%, and gains may owe capital-gains tax (a 1031 exchange can defer both). Figures are a year-1 estimate at your 24.0% rate — not tax advice; consult a CPA.
Schools (NCES district)
- District
- Dayton City
- NCES district ID
- 3904384
- Math proficiency
- 12% ▼ -12.00%
- Reading proficiency
- 21% ▼ -11.00%
- Median HH income
- $28,688
- Composite
- 12.94/100
- National rank
- #9579
- State rank
- #641 of 656 in OH
Livability — Dayton
- Score
- 65/100
- State rank
- #716
- US rank
- #12895
Category grades
Schools grade is shown separately in the Schools card above.
Census & demographics
- Census place
- Dayton, OH
- County
- Montgomery County · 459,541 people
- City population
- 164,387
- Metro
- Dayton-Kettering, OH
- Population (ZIP)
- 19,991
- Household income
- $41,796
- Rent vs Own
- Severe rent burden
- 1504.0
Population outlook (Montgomery County) Hauer SSP2
- Today (2025)
- 523,241 people
- By 2030
- 514,948 · -1.6%
- By 2040
- 493,378 · -5.7%
- By 2050
- 469,639 · -10.2%
- By 2075
- 418,360 · -20.0%
- By 2100
- 353,315 · -32.5%
Race, ethnicity, and origin ACS 2023
- Neighborhood character
- Predominantly Black (75%)
- Race & ethnicity
- Black 75% White 16% Two or more races 7% Hispanic / Latino 3%
- Common ancestry
- Italian 2% Lithuanian 1% Slovak 1%
- Foreign-born
- 2% · Canada
- Languages at home
- 97% English-only · Spanish 1%
Political lean MEDSL · Montgomery
- 2024 margin
- Toss-up / Even · D 49.8% · R 49.3%
- 2008→2024 swing
- -5.8pp toward R · 2008: 6.2pp · 2024: 0.5pp
- All cycles
- 2024: D+0.5 2020: D+2.2 2016: R+1.2 2012: D+3.1 2008: D+6.2
Not yet ingested
- Civics
- —
Market trends
- HPI YoY
- ▼ -113.75%
- Current HPI
- 197.1302
- Rent YoY
- ▲ 3.03%
- Metro
- Dayton-Kettering, OH
- State GDP YoY
- ▲ 1.98%
- F500 in state
- 48
Industry mix (Fortune 500 HQ in OH)
| Industry | F500 HQs | Revenue |
|---|---|---|
| Insurance | 3 | $145B |
|
||
| Industrial Machinery | 3 | $49B |
|
||
| Financial Services | 3 | $24B |
|
||
| Consumer Goods | 2 | $93B |
|
||
| Aerospace / Defense | 2 | $47B |
|
||
| Utilities | 2 | $33B |
|
||
Price history
+668.5% since first listed14 events — show timeline
- 2026-06-05 Listed $99,900 Dayton MLS
- 2023-10-15 Rental Removed $975 APPFOLIO
- 2023-07-25 Listed for Rent $975 APPFOLIO
- 2018-09-05 Sold (Public Records) $284,400 Public Records
- 2018-09-05 Sold (Public Records) $315,400 Public Records
- 2010-07-07 Sold (MLS) $8,500 Dayton MLS
- 2010-07-07 Sold (MLS) $8,500 Dayton MLS
- 2010-06-24 Listing Removed — Dayton MLS
- 2010-05-10 Listed $9,900 Dayton MLS
- 2008-01-02 Sold (Public Records) $57,500 Public Records
- 2004-12-06 Sold (Public Records) $78,000 Public Records
- 2003-01-06 Sold (Public Records) $68,000 Public Records
- 1990-11-30 Sold (Public Records) $13,000 Public Records
- 1990-11-30 Sold (Public Records) $13,000 Public Records
Property tax history
-1.2%/yrLatest (2025): $814 · -0.2% YoY. Source: county tax records.
Cash-flow waterfall
monthlySold comps — $/sqft
last 12 mo · ≤1 miLoading sold comps…