 🏷️ Likely Rental
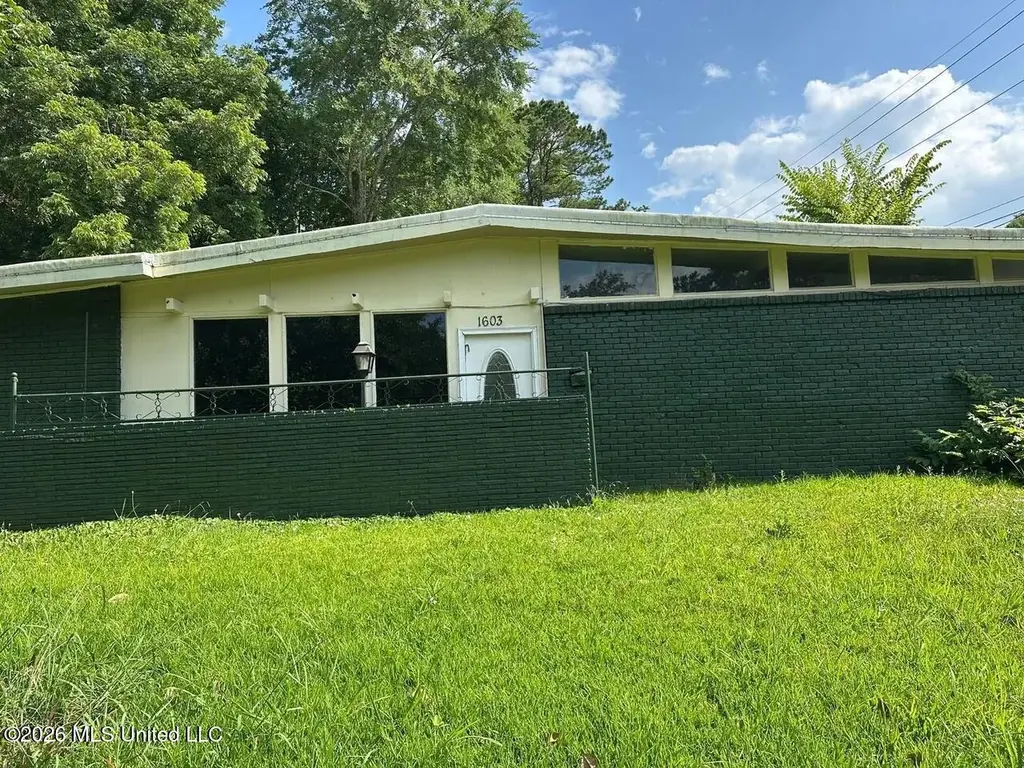
1603 Winchester St · Jackson, MS
Flood risk 1/10 · Minimal
- FEMA flood zone
- X (unshaded)
- Chance of flooding over 30 yrs
- 0.0%
- Est. flood insurance / yr
- $507 – $1,088
Fire risk 1/10 · Minimal
- Est. fire insurance / yr
- $1,241 – $2,305
Heat risk 7/10 · Major
- Hot days now (above 108°F)
- 7 days/yr
- Hot days in 30 yrs
- 20 days/yr
Wind risk 8/10 · Major
- Chance of severe wind over 30 yrs
- 80.0%
Air-quality risk 2/10 · Minimal
- Unhealthy air days now
- 0 days/yr
- Unhealthy air days in 30 yrs
- 1 days/yr
Risk factors via First Street. Map © Google.
Why this score? — see what drove the B grade
The composite is a weighted blend of 9 inputs, each scored 0–100. Each bar is that input's sub-score; the figure is the points it added to the 100-point composite (weight × sub-score).
- Cash flow +27.8/30.0
- ARV discount +15.0/15.0
- DSCR +9.8/10.0
- 1% rule +7.7/10.0
- Rent growth +4.5/5.0
- Livability +3.4/5.0
- Condition / age +2.5/5.0
- Schools +1.1/10.0
- Appreciation +0.0/10.0
$169,900
🖨 Deal sheet 📄 Offer letter ✓ Due diligence
Listing remarks MLS
This investment home is perfect for the the seasoned and newbie investors who would like to add this property to their rental portfolio. This is a DSCR Loan approved property. Features guaranteed cash flow of $1,640 per month with a HUD tenant. Its a spacious 4br/2ba corner lot home with NO carpets, large bedrooms, wood burning brick fireplace, and ample parking. It's near main roads of Ridgewood, Northside, Old Canton, Lakeland, near I55, hospitals and clinics, near Span Elementary and Jackson Academy Private School, shopping, dining and entertaining. Don't miss out on this long term investment opportunity for tax write offs, build equity, and get cash flow! Call a Realtor now for information. **Do NOT Disturb tenant**
Key facts
- Ample parking
- Corner lot
- 0.28 acre lot
Tags
Neighborhood map
What this means for you Summary
Snapshot
- This is a 4-bed/2.0-bath single-family listed at $170k.
Deal economics
- At list price, monthly cash flow is $520 ($6k/yr) — positive.
- The deal already cash-flows at list — no discount required.
- Meets the 1% rule at list price ($2k rent vs $170k).
- Recommended offer: $160k (6.0% below list) — sets the bar for market timing.
Location & tenants
- Location reads 68/100 on livability (#66 in MS) — a middle-class / working-renter tenant base. Strengths: commute A+, cost of living A+, housing A+; Watch: schools F, amenities F, employment F.
- Jackson Public School District (urban): math 9% / reading 18% proficiency, ranked #112 of 130 in MS (top 86%) — low school quality limits family demand, transient renter base, plan for 1-2y turnover; 88% free/reduced lunch — lower-income household profile, screen leases tightly.
- Market conditions: Rents rising fast (+7.9%/yr); 221 active listings in the ZIP; 7 comparable units currently listed for rent nearby; rentals at typical pace (median 24d on market — plan ~3-4 weeks tenant-placement turnaround); 167 units permitted in Hinds County in 2024 (0 in 5+ unit buildings).
- This rent runs 37% of the median local income ($69k/yr) — at the standard rent-burdened threshold; future hikes will face affordability resistance.
Forward outlook
- Local home prices are declining (-3.0%/yr); year-one equity from $1k of loan paydown is wiped out by about $5k of value loss. Plan a longer hold.
- Hinds County population projected to shrink 6% by 2050 — rents likely to lag national; underwrite the cash flow, not the appreciation.
- At projected returns (-3.0% appreciation + 7.9% rent growth), your $48k cash investment doubles in ~7 years — after that, you're playing with house money.
Negotiation context
- It's been on market 82 days — a 6% lower offer ($160k) is reasonable based on typical stale-listing flexibility.
- 3 sale attempts with the ask held roughly flat each time — persistent listings suggest the price (not the market) is what's stuck; bring a comps-based counter.
Risks & watch-outs
- Watch-outs: built in 1958 — expect roof / HVAC / electrical / plumbing capex.
- Climate carrying-cost: severe wind risk, 80% chance of damaging wind over 30y; extreme-heat days projected 7→20/yr by 2055 (HVAC capex compounding) — expect insurance premiums to compound above CPI over the hold.
Questions for the listing agent
- It's been on market 82 days. Have you received any prior offers? Is the seller open to a 6% concession, seller financing, or rate buy-down credit?
- Built in 1958 — when were the roof, HVAC, electrical panel, plumbing, and water heater last replaced?
- Why hasn't it sold? Are there any deal-killer items the seller is aware of (foundation, flood, title, zoning, code violations)?
- Is there a deadline driving the sale (1031 exchange, divorce, estate, relocation)? That informs how much negotiation room exists.
- Schools are F-rated, which usually means shorter tenancies and higher turnover. Who's the typical renter profile here, and what's been the actual vacancy rate?
- What's the average days-on-market for RENTAL listings here right now (not sales)? A rising rental-DOM trend means longer vacancies and softer asking-rent achievability than the comps imply.
- What's the recent tenant-quality profile in this submarket — average credit score on applications, eviction rate, late-payment / NSF rate, and stable-employment percentage? A property-management company in the area should have these aggregated.
- How much new for-sale + rental construction is in the pipeline within 1–3 miles? Heavy new supply typically softens prices + rents 12–24 months out; constrained supply supports both.
Investment metrics
- 1% rule
- 1.27% ✓
- Cap rate
- 9.97%
- Cash-on-cash
- 13.12%
- DSCR
- 1.58
- GRM
- 6.5
CMA / ARV
- ARV (median comp)
- $251,681
- List price
- $169,900
- Delta
- -32.49%
- Verdict
- UNDERPRICED
- Comps
- 20 within 1.0 mi
Show comp detail 12 sales within ~0.75 mi
| Address | Dist | Beds/Ba | Sqft | Sold | Price | $/sf | Match |
|---|---|---|---|---|---|---|---|
| 1609 Sheffield Dr | 0.12mi | 3/2.0 (-1) | 2,320 (+1%) | 1mo | $375,000 | $162 | 87 |
| 1534 Brecon Dr | 0.07mi | 4/2.0 | 2,512 (+9%) | 5mo | $275,000 | $109 | 77 |
| 4550 Ridgewood Rd | 0.32mi | 3/2.5 (-1) | 2,315 (+1%) | 4mo | $190,350 | $82 | 74 |
| 4311 Roswell Ct | 0.53mi | 4/2.0 | 2,141 (-7%) | 2mo | $265,000 | $124 | 62 |
| 2009 Southwood Rd | 0.55mi | 4/3.0 | 2,410 (+5%) | 3mo | $259,500 | $108 | 60 |
| 1415 Winchester St | 0.22mi | 4/3.0 | 2,643 (+15%) | 3mo | $169,900 | $64 | 58 |
| 318 Rollingwood Dr | 0.73mi | 4/2.5 | 2,391 (+4%) | 3mo | $275,000 | $115 | 55 |
| 1777 Brecon Dr | 0.31mi | 3/2.0 (-1) | 1,971 (-14%) | 5mo | $189,900 | $96 | 53 |
| 1903 Bellewood Rd | 0.41mi | 4/3.5 | 2,597 (+13%) | 4mo | $292,000 | $112 | 50 |
| 4429 Forest Park Dr | 0.43mi | 3/2.0 (-1) | 1,968 (-14%) | 1mo | $240,000 | $122 | 50 |
| 4407 Forest Park Dr | 0.47mi | 3/3.0 (-1) | 2,070 (-10%) | 3mo | $239,000 | $115 | 50 |
| 2017 Southwood Rd | 0.57mi | 4/3.0 | 2,599 (+13%) | 2mo | $325,000 | $125 | 46 |
Match score weights: distance 35% · size 25% · config 20% · recency 20%. Top-matched comps best support the ARV.
Projected returns pro-forma
-3.0% appreciation · 7.9% rent growth · sell at horizon
- IRR
- 8.5%
- Equity multiple
- 1.35×
- Total profit
- $16,835
- Equity at exit
- $25,333
- IRR
- 21.6%
- Equity multiple
- 3.28×
- Total profit
- $108,371
- Equity at exit
- $14,690
Cash invested: $47,572 (down + closing). Projections, not guarantees.
Landlord ↔ Tenant lean methodology
- Overall (STATE)
- 90 Strongly Landlord-Friendly
- State Mississippi
- 90 Strongly Landlord-Friendly · R+11
- County
- — inherits STATE
- City
- — inherits STATE
ZIP-level market 39211
- Rents YoY
- 7.9%
- Active inventory
- 221
- Price-to-rent
- 6.5×
Monthly cashflow live
- Estimated rent
- $2,166 high interval (Pro) →
- Mortgage (P&I)
- −$891
- Tax from tax record
- −$229 /mo · $2,750/yr
- Insurance
- −$71
- HOA
- −$0
- Vacancy / Maint / Mgmt
- −$455
- Net cashflow
- $520
Break-even live
UW: 25.0% down · 7.5% · 30yr · 1.5% tax · 5.0% vac · 8.0% maint · 8.0% mgmt
Financing live
Cash to close
- Down payment
- $42,475
- Closing costs
- $5,097
- Reserves months
- —
- Total cash needed
- —
Loan-product check · same deal, 3 products live
Conventional
25% down · 7.5% · 30yr
- Down + closing
- —
- Monthly P&I
- —
- Monthly cashflow
- —
- DSCR
- —
- Eligible?
- —
Personal DTI + credit; lowest rate.
DSCR
20% down · 8.5% · 30yr
- Down + closing
- —
- Monthly P&I
- —
- Monthly cashflow
- —
- DSCR
- —
- Eligible?
- —
No personal income docs; deal must DSCR.
Hard money
10% down · 12.0% · 12mo
- Down + closing
- —
- Monthly P&I
- —
- Monthly cashflow
- —
- DSCR
- —
- Eligible?
- —
Short-term bridge; refi at stabilization.
Rent comps 7 comps
| Address | Beds | Baths | Sqft | Rent | $/sqft | DOM | Units | Dist |
|---|---|---|---|---|---|---|---|---|
| 4750 Old Canton Rd Jackson, MS | 4.0 | 3.0 | 2085 | $2,200 | $1.06 | 23d | 1 | 0.22mi |
| 5125 Old Canton Rd Jackson, MS | 3.0 | 3.0 | 2025 | $2,100 | $1.04 | 23d | 1 | 0.48mi |
| 212 Pimlico Pl Jackson, MS | 3.0 | 2.0 | 1600 | $900 | $0.56 | 14d | 1 | 0.56mi |
| 1046 Newland St Jackson, MS | 4.0 | 2.5 | 2700 | $3,200 | $1.19 | 23d | 1 | 0.68mi |
| 20 N Hill Pkwy Jackson, MS | 1.0–3.0 | 1.0–2.5 | 1046 | $1,100 | $1.05 | 14d | 31 | 0.78mi |
| 5538 Pine Lane Dr Jackson, MS | 3.0 | 2.0 | 1627 | $1,465 | $0.90 | 43d | 1 | 1.31mi |
| 5544 Wayneland Dr Jackson, MS | 3.0 | 2.0 | 1800 | $1,831 | $1.02 | 43d | 1 | 1.35mi |
Listing history 28 events
-
2026-06-18days on market $169,900 Active 82 DOM
-
2026-06-17days on market $169,900 Active 81 DOM
-
2026-06-16days on market $169,900 Active 80 DOM
-
2026-06-15days on market $169,900 Active 79 DOM
-
2026-06-14days on market $169,900 Active 77 DOM
-
2026-06-13days on market $169,900 Active 76 DOM
-
2026-06-10days on market $169,900 Active 74 DOM
-
2026-06-09days on market $169,900 Active 73 DOM
-
2026-06-08days on market $169,900 Active 72 DOM
-
2026-06-07days on market $169,900 Active 71 DOM
-
2026-06-05days on market $169,900 Active 68 DOM
-
2026-06-03days on market $169,900 Active 67 DOM
-
2026-06-02days on market $169,900 Active 66 DOM
-
2026-06-01days on market $169,900 Active 65 DOM
-
2026-05-31days on market $169,900 Active 64 DOM
-
2026-05-30days on market $169,900 Active 63 DOM
-
2026-03-28$169,900 Active 729-char remark
Show marketing remark (729 chars)
This investment home is perfect for the the seasoned and newbie investors who would like to add this property to their rental portfolio. This is a DSCR Loan approved property. Features guaranteed cash flow of $1,640 per month with a HUD tenant. Its a spacious 4br/2ba corner lot home with NO carpets, large bedrooms, wood burning brick fireplace, and ample parking. It's near main roads of Ridgewood, Northside, Old Canton, Lakeland, near I55, hospitals and clinics, near Span Elementary and Jackson Academy Private School, shopping, dining and entertaining. Don't miss out on this long term investment opportunity for tax write offs, build equity, and get cash flow! Call a Realtor now for information. **Do NOT Disturb tenant**
-
2025-08-22historical $2,009
-
2025-07-07$2,009
-
2025-06-28historical $2,009
-
2025-06-18$2,009
-
2024-07-31soldstatus
-
2022-08-10soldstatus
-
2019-04-16soldstatus
-
2018-06-07soldstatus
-
2006-02-10soldstatus
-
1986-07-31soldstatus
-
1980-06-23soldstatus
ⓘ Source: listings_history table (triggers on properties + properties_extension) + one-shot
backfill from property_details.listing_events for pre-trigger history.
Tax reassessment forecast MS · Resets to sale price
- Current annual tax
- $2,750 · $229/mo
- Projected year-2 tax
- $2,750 · $229/mo
- Expected delta
- $0/yr ($0/mo · -0.0%)
ⓘ Screening estimate from a state-policy table — verify with the county assessor before closing.
Climate risk First Street
- Flood 1/10 Low FEMA zone X (unshaded) · 0% chance over 30 yrs
- Wildfire 1/10 Low
- Heat 7/10 Severe 7 d/yr ≥108°F today · 20 d/yr by 30 yrs out
- Wind 8/10 Severe 80% chance of damaging wind over 30 yrs
- Air quality 2/10 Low 0 unhealthy d/yr today · 1 by 30 yrs out
Nearby sold comps map
Loading sold comps map…
Walkable amenities ~0.75 mi
Loading nearby amenities…
Taxation est. · year 1
- Rental income
- $25,989
- − Mortgage interest
- −$9,517
- − Property taxes
- −$2,750
- − Insurance
- −$850
- − Repairs & maintenance
- −$2,079
- − Management
- −$2,079
- − Depreciation
- −$4,943
- Taxable income
- $3,771
- Est. tax owed @ 24.0%
- −$905
- After-tax cash flow
- $5,335/yr
For passive investors: Depreciation is non-cash, so a rental often shows a tax loss while cash-flowing — sheltering income. Rental losses are passive: they offset passive income freely, and up to $25,000/yr can offset ordinary (W-2) income if you actively participate and your MAGI is under $100k (phasing out to $0 by $150k); unused losses carry forward. On sale, claimed depreciation is recaptured at up to 25%, and gains may owe capital-gains tax (a 1031 exchange can defer both). Figures are a year-1 estimate at your 24.0% rate — not tax advice; consult a CPA.
Schools (NCES district)
- District
- Jackson Public School District
- NCES district ID
- 2802190
- Math proficiency
- 9% ▼ -14.00%
- Reading proficiency
- 18% ▼ -7.00%
- Median HH income
- $33,234
- Composite
- 10.89/100
- National rank
- #9755
- State rank
- #112 of 130 in MS
Livability — Jackson
- Score
- 68/100
- State rank
- #66
- US rank
- #9695
Category grades
Schools grade is shown separately in the Schools card above.
Census & demographics
- Census place
- Jackson, MS
- County
- Hinds County · 167,040 people
- City population
- 140,204
- Metro
- Jackson, MS
- Population (ZIP)
- 23,838
- Household income
- $69,426
- Rent vs Own
- Severe rent burden
- 736.0
Population outlook (Hinds County) Hauer SSP2
- Today (2025)
- 242,528 people
- By 2030
- 241,113 · -0.6%
- By 2040
- 235,557 · -2.9%
- By 2050
- 226,946 · -6.4%
- By 2075
- 199,995 · -17.5%
- By 2100
- 164,165 · -32.3%
Race, ethnicity, and origin ACS 2023
- Neighborhood character
- Majority Black (59%)
- Race & ethnicity
- Black 59% White 36% Hispanic / Latino 3% Two or more races 2%
- Common ancestry
- Serbian 2% Italian 2% Slovak 1%
- Foreign-born
- 2% · Canada, China
- Languages at home
- 96% English-only · Spanish 3% Chinese 1%
Political lean MEDSL · Hinds
- 2024 margin
- Solid D (+46.1) · D 72.4% · R 26.3% · Other 1.4%
- 2008→2024 swing
- +7.1pp toward D · 2008: 39.0pp · 2024: 46.1pp
- All cycles
- 2024: D+46.1 2020: D+48.3 2016: D+43.7 2012: D+45.1 2008: D+39.0
Not yet ingested
- Civics
- —
Market trends
- HPI YoY
- ▼ -135.99%
- Current HPI
- 145.5192
- Rent YoY
- ▲ 7.90%
- Metro
- Jackson, MS
- State GDP YoY
- —
- F500 in state
- 0
Price history
+8356.9% since first listed12 events — show timeline
- 2026-03-28 Listed $169,900 MLSU
- 2025-08-22 Rental Removed $2,009 APPFOLIO
- 2025-07-07 Listed for Rent $2,009 APPFOLIO
- 2025-06-28 Rental Removed $2,009 APPFOLIO
- 2025-06-18 Listed for Rent $2,009 APPFOLIO
- 2024-07-31 Sold (Public Records) — Public Records
- 2022-08-10 Sold (Public Records) — Public Records
- 2019-04-16 Sold (Public Records) — Public Records
- 2018-06-07 Sold (Public Records) — Public Records
- 2006-02-10 Sold (Public Records) — Public Records
- 1986-07-31 Sold (Public Records) — Public Records
- 1980-06-23 Sold (Public Records) — Public Records
Property tax history
+1.4%/yrLatest (2025): $2,750 · +82.4% YoY. Source: county tax records.
Cash-flow waterfall
monthlySold comps — $/sqft
last 12 mo · ≤1 miLoading sold comps…