614 W 5th St · Elk City, OK
Flood risk 1/10 · Minimal
- FEMA flood zone
- X
- Chance of flooding over 30 yrs
- 0.0%
- Est. flood insurance / yr
- $435 – $905
Fire risk 3/10 · Minor
- Est. fire insurance / yr
- $2,463 – $4,575
Heat risk 6/10 · Moderate
- Hot days now (above threshold)
- 7 days/yr
- Hot days in 30 yrs
- 19 days/yr
Wind risk No data
- Chance of severe wind over 30 yrs
- —
Air-quality risk No data
- Unhealthy air days now
- —
- Unhealthy air days in 30 yrs
- —
Risk factors via First Street. Map © Google.
Why this score? — see what drove the B- grade
The composite is a weighted blend of 9 inputs, each scored 0–100. Each bar is that input's sub-score; the figure is the points it added to the 100-point composite (weight × sub-score).
- Cash flow +30.0/30.0
- 1% rule +10.0/10.0
- DSCR +10.0/10.0
- ARV discount +7.5/15.0
- Livability +3.2/5.0
- Rent growth +2.5/5.0
- Condition / age +2.5/5.0
- Schools +1.3/10.0
- Appreciation +0.0/10.0
$45,000
🖨 Deal sheet 📄 Offer letter ✓ Due diligence
Listing remarks
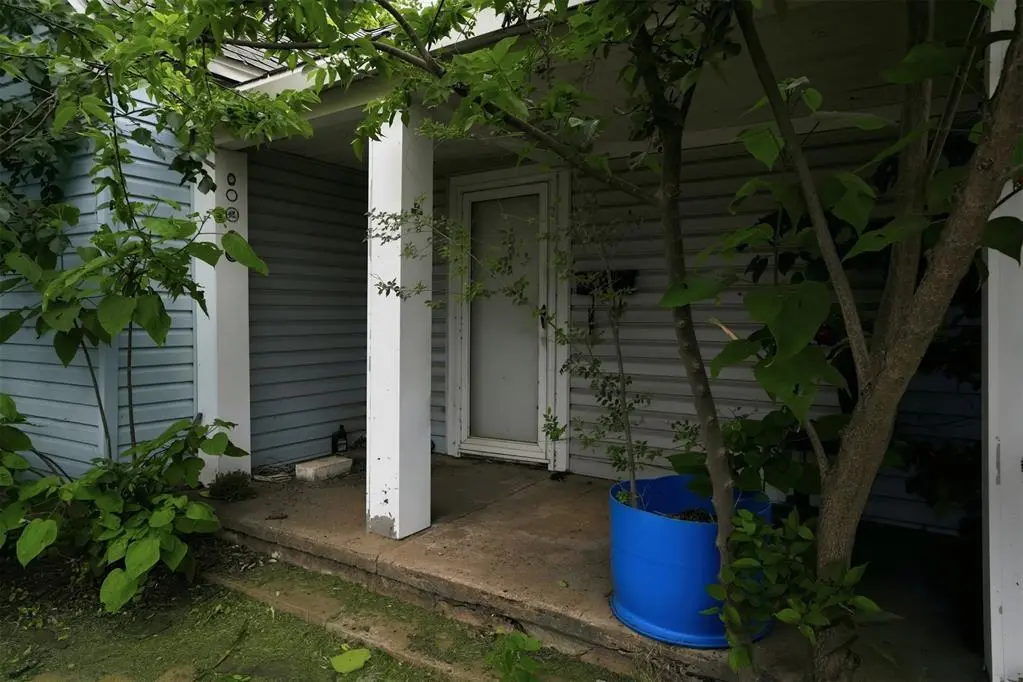
Affordable Opportunity in Elk City, Oklahoma! This 1 1/2 story home is priced to sell at just $45,000 and offers endless potential for the right buyer with vision and creativity. Featuring 2 bedrooms and 1 1/2 bathrooms, this property could make a great starter home, rental investment, or renovation project. With some updates and personal touches, this home has the opportunity to truly shine again. Conveniently located in Elk City. Property is being sold in its current condition. If you’ve been searching for an affordable home with potential in Western Oklahoma, don’t miss this opportunity!
Key facts
- 7,000 sq ft lot
- Built 1915
- Listed 42 days
Property features AI
Finance
- Other: Vacant; No home warranty; Living area reported as 1,064 (assessor); No storm shelter; Interior lot in the Houchens addition
- Financial info: Sold as-is; cash offers accepted; Not assumable
- HOA & community: No mandatory association dues
Exterior
- Parking: Other parking
- Utilities: Electricity available; Natural gas available; Public utilities
- Home design: Single family residence; Residential property; One and one-half level; Property faces north
- Construction: Vinyl siding; Composition roof; Steel frame windows; Combination foundation; Existing property
- Exterior features: Chain link fence; Interior lot
Interior
- Kitchen: 1 dining area
- Bedrooms: 2 bedrooms
- Bathrooms: 1 full bath; 1 half bath
- Heating & cooling: No heating; No cooling
- Interior features: In-law plan; Covered porch
Neighborhood map
What this means for you Summary
Snapshot
- This is a 2-bed/1.0-bath single-family listed at $45k.
Deal economics
- At list price, monthly cash flow is $475 ($6k/yr) — positive.
- The deal already cash-flows at list — no discount required.
- Meets the 1% rule at list price ($977 rent vs $45k).
- Recommended offer: $44k (3.0% below list) — sets the bar for market timing.
- Cap rate 19.0% vs local median 4.1% in Elk City — top-decile yield for the area; either an underpriced asset or a hidden risk that comps aren't pricing in. Stress-test before assuming the spread holds.
Location & tenants
- Location reads 65/100 on livability (#141 in OK) — a middle-class / working-renter tenant base. Strengths: cost of living A+, housing A, crime B+; Watch: employment D+, amenities F, commute F.
- Elk City (town): math 14% / reading 15% proficiency, ranked #218 of 270 in OK (top 81%) — low school quality limits family demand, transient renter base, plan for 1-2y turnover.
- Zoned schools: Elk City Es (math 22% / reading 17%, grade F, #479 of 845 statewide, top 63%, 753 students, 0% FRL); Elk City Hs (math 8% / reading 22%, grade F, #332 of 447 statewide, top 78%, 615 students, 0% FRL) — zoned schools average 0% FRL vs 48% district-wide (48 pts lower); this property's tenant base skews higher-income than the district average.
- Market conditions: 122 active listings in the ZIP; 16 units permitted in Beckham County in 2024 (0 in 5+ unit buildings).
Forward outlook
- Local home prices are declining (-3.0%/yr); year-one equity from $311 of loan paydown is wiped out by about $1k of value loss. Plan a longer hold.
- Beckham County population projected at +35% by 2050 — long-run rental-demand tailwind backs the buy-and-hold thesis.
- At projected returns (-3.0% appreciation + 3.0% rent growth), your $13k cash investment doubles in ~3 years — after that, you're playing with house money.
Negotiation context
- It's been on market 42 days — a 3% lower offer ($44k) is reasonable based on typical stale-listing flexibility.
- Current owner paid $17k; list at $45k implies a 165% gain — meaningful room to come down on a strong offer.
Risks & watch-outs
- Watch-outs: built in 1915 — expect roof / HVAC / electrical / plumbing capex.
- Climate carrying-cost: extreme-heat days projected 7→19/yr by 2055 (HVAC capex compounding) — expect insurance premiums to compound above CPI over the hold.
Questions for the listing agent
- It's been on market 42 days. Have you received any prior offers? Is the seller open to a 3% concession, seller financing, or rate buy-down credit?
- Built in 1915 — when were the roof, HVAC, electrical panel, plumbing, and water heater last replaced?
- Is there a deadline driving the sale (1031 exchange, divorce, estate, relocation)? That informs how much negotiation room exists.
- Schools are F-rated, which usually means shorter tenancies and higher turnover. Who's the typical renter profile here, and what's been the actual vacancy rate?
- What's the average days-on-market for RENTAL listings here right now (not sales)? A rising rental-DOM trend means longer vacancies and softer asking-rent achievability than the comps imply.
- What's the recent tenant-quality profile in this submarket — average credit score on applications, eviction rate, late-payment / NSF rate, and stable-employment percentage? A property-management company in the area should have these aggregated.
- How much new for-sale + rental construction is in the pipeline within 1–3 miles? Heavy new supply typically softens prices + rents 12–24 months out; constrained supply supports both.
Investment metrics
- 1% rule
- 2.17% ✓
- Cap rate
- 18.96%
- Cash-on-cash
- 45.26%
- DSCR
- 3.01
- GRM
- 3.8
CMA / ARV
- ARV (on-the-fly)
- $92,568
- Comps found
- 12
Show comp detail 12 sales within ~0.75 mi
| Address | Dist | Beds/Ba | Sqft | Sold | Price | $/sf | Match |
|---|---|---|---|---|---|---|---|
| 211 S Boone Ave | 0.11mi | 3/2.0 (+1) | 1,084 (+2%) | 15mo | $40,000 | $37 | 70 |
| 311 W 1st St | 0.37mi | 2/1.0 | 1,096 (+3%) | 16mo | $66,000 | $60 | 64 |
| 422 N Washington Ave | 0.40mi | 3/1.0 (+1) | 1,150 (+8%) | 1mo | $80,000 | $70 | 62 |
| 1401 W 2nd St | 0.58mi | 2/1.0 | 986 (-7%) | 1mo | $41,000 | $42 | 60 |
| 622 N Boone Ave | 0.49mi | 2/2.0 | 1,144 (+8%) | 3mo | $100,000 | $87 | 58 |
| 420 N Howard Ave | 0.43mi | 3/1.0 (+1) | 1,008 (-5%) | 10mo | $18,500 | $18 | 58 |
| 419 W 8th St | 0.24mi | 3/2.0 (+1) | 1,150 (+8%) | 14mo | $130,000 | $113 | 55 |
| 415 Eisenhower Blvd | 0.71mi | 3/1.0 (+1) | 1,012 (-5%) | 1mo | $97,000 | $96 | 53 |
| 1403 W Broadway Ave | 0.54mi | 3/1.0 (+1) | 1,008 (-5%) | 10mo | $80,000 | $79 | 53 |
| 906 Halsey Dr | 0.68mi | 3/1.0 (+1) | 970 (-9%) | 12mo | $92,000 | $95 | 39 |
| 910 W 1st St | 0.35mi | 3/2.0 (+1) | 1,217 (+14%) | 15mo | $130,000 | $107 | 38 |
| 1221 W A Ave | 0.58mi | 3/1.5 (+1) | 1,211 (+14%) | 20mo | $130,000 | $107 | 26 |
Match score weights: distance 35% · size 25% · config 20% · recency 20%. Top-matched comps best support the ARV.
Projected returns pro-forma
-3.0% appreciation · 3.0% rent growth · sell at horizon
- IRR
- 42.4%
- Equity multiple
- 2.82×
- Total profit
- $22,979
- Equity at exit
- $6,710
- IRR
- 48.5%
- Equity multiple
- 5.68×
- Total profit
- $59,003
- Equity at exit
- $3,891
Cash invested: $12,600 (down + closing). Projections, not guarantees.
Landlord ↔ Tenant lean methodology
- Overall (STATE)
- 83 Strongly Landlord-Friendly
- State Oklahoma
- 83 Strongly Landlord-Friendly · R+20
- County
- — inherits STATE
- City
- — inherits STATE
ZIP-level market 73644
- Home prices YoY
- -24.0%
- Active inventory
- 122
- Price-to-rent
- 3.8×
Monthly cashflow live
- Estimated rent
- $977 medium interval (Pro) →
- Mortgage (P&I)
- −$236
- Tax from tax record
- −$42 /mo · $500/yr
- Insurance
- −$19
- HOA
- −$0
- Vacancy / Maint / Mgmt
- −$205
- Net cashflow
- $475
Break-even live
UW: 25.0% down · 7.5% · 30yr · 1.5% tax · 5.0% vac · 8.0% maint · 8.0% mgmt
Financing live
Cash to close
- Down payment
- $11,250
- Closing costs
- $1,350
- Reserves months
- —
- Total cash needed
- —
Loan-product check · same deal, 3 products live
Conventional
25% down · 7.5% · 30yr
- Down + closing
- —
- Monthly P&I
- —
- Monthly cashflow
- —
- DSCR
- —
- Eligible?
- —
Personal DTI + credit; lowest rate.
DSCR
20% down · 8.5% · 30yr
- Down + closing
- —
- Monthly P&I
- —
- Monthly cashflow
- —
- DSCR
- —
- Eligible?
- —
No personal income docs; deal must DSCR.
Hard money
10% down · 12.0% · 12mo
- Down + closing
- —
- Monthly P&I
- —
- Monthly cashflow
- —
- DSCR
- —
- Eligible?
- —
Short-term bridge; refi at stabilization.
Listing history 16 events
-
2026-06-18days on market $45,000 Active 42 DOM
-
2026-06-17days on market $45,000 Active 41 DOM
-
2026-06-16days on market $45,000 Active 40 DOM
-
2026-06-15days on market $45,000 Active 39 DOM
-
2026-06-13days on market $45,000 Active 37 DOM
-
2026-06-12days on market $45,000 Active 36 DOM
-
2026-06-09days on market $45,000 Active 33 DOM
-
2026-06-08days on market $45,000 Active 32 DOM
-
2026-06-08days on market $45,000 Active 31 DOM
-
2026-06-07days on market $45,000 Active 30 DOM
-
2026-06-04days on market $45,000 Active 27 DOM
-
2026-06-02days on market $45,000 Active 26 DOM
-
2026-06-01days on market $45,000 Active 25 DOM
-
2026-05-31days on market $45,000 Active 24 DOM
-
2026-05-07$45,000 Active
-
1999-10-12soldstatus $17,000
ⓘ Source: listings_history table (triggers on properties + properties_extension) + one-shot
backfill from property_details.listing_events for pre-trigger history.
Tax reassessment forecast OK · Resets to sale price
- Current annual tax
- $500 · $42/mo
- Projected year-2 tax
- $500 · $42/mo
- Expected delta
- $0/yr ($0/mo · 0.0%)
ⓘ Screening estimate from a state-policy table — verify with the county assessor before closing.
Climate risk First Street
- Flood 1/10 Low FEMA zone X · 0% chance over 30 yrs
- Wildfire 3/10 Moderate
- Heat 6/10 Major
Nearby sold comps map
Loading sold comps map…
Walkable amenities ~0.75 mi
Loading nearby amenities…
Taxation est. · year 1
- Rental income
- $11,720
- − Mortgage interest
- −$2,521
- − Property taxes
- −$500
- − Insurance
- −$225
- − Repairs & maintenance
- −$938
- − Management
- −$938
- − Depreciation
- −$1,309
- Taxable income
- $5,290
- Est. tax owed @ 24.0%
- −$1,270
- After-tax cash flow
- $4,433/yr
For passive investors: Depreciation is non-cash, so a rental often shows a tax loss while cash-flowing — sheltering income. Rental losses are passive: they offset passive income freely, and up to $25,000/yr can offset ordinary (W-2) income if you actively participate and your MAGI is under $100k (phasing out to $0 by $150k); unused losses carry forward. On sale, claimed depreciation is recaptured at up to 25%, and gains may owe capital-gains tax (a 1031 exchange can defer both). Figures are a year-1 estimate at your 24.0% rate — not tax advice; consult a CPA.
Schools (NCES district)
- District
- Elk City
- NCES district ID
- 4010740
- Math proficiency
- 14% ▼ -11.00%
- Reading proficiency
- 15% ▼ -14.00%
- Median HH income
- $49,040
- Composite
- 13.26/100
- National rank
- #9547
- State rank
- #218 of 270 in OK
Livability — Elk City
- Score
- 65/100
- State rank
- #141
- US rank
- #13090
Category grades
Schools grade is shown separately in the Schools card above.
Census & demographics
- Census place
- Elk City, OK
- City population
- 13,687
- Population (ZIP)
- 13,687
Population outlook (Beckham County) Hauer SSP2
- Today (2025)
- 26,564 people
- By 2030
- 28,217 · +6.2%
- By 2040
- 31,865 · +20.0%
- By 2050
- 35,862 · +35.0%
- By 2075
- 47,189 · +77.6%
- By 2100
- 55,622 · +109.4%
Race, ethnicity, and origin ACS 2023
- Neighborhood character
- Predominantly White (80%)
- Race & ethnicity
- White 80% Hispanic / Latino 15% Two or more races 6% Black 1% Asian 1%
- Hispanic origin (detail)
- Mexican 13%
- Common ancestry
- Iranian 2% Lithuanian 2% Italian 2%
- Foreign-born
- 4% · Canada, China
- Languages at home
- 89% English-only · Spanish 10%
Political lean MEDSL · Beckham
- 2024 margin
- Solid R (+70.1) · D 14.2% · R 84.3% · Other 1.4%
- 2008→2024 swing
- -14.0pp toward R · 2008: -56.1pp · 2024: -70.1pp
- All cycles
- 2024: R+70.1 2020: R+72.0 2016: R+70.8 2012: R+59.1 2008: R+56.1
Not yet ingested
- Civics
- —
Market trends
- HPI YoY
- ▼ -56.11%
- Current HPI
- 178.0217
- Rent YoY
- —
- Metro
- —
- State GDP YoY
- ▲ 1.55%
- F500 in state
- 6
Industry mix (Fortune 500 HQ in OK)
| Industry | F500 HQs | Revenue |
|---|---|---|
| Energy | 3 | $48B |
|
||
Price history
+164.7% since first listed2 events — show timeline
- 2026-05-07 Listed $45,000 MLSOK
- 1999-10-12 Sold (Public Records) $17,000 Public Records
Property tax history
+25.3%/yrLatest (2025): $500 · +10.1% YoY. Source: county tax records.
Cash-flow waterfall
monthlySold comps — $/sqft
last 12 mo · ≤1 miLoading sold comps…