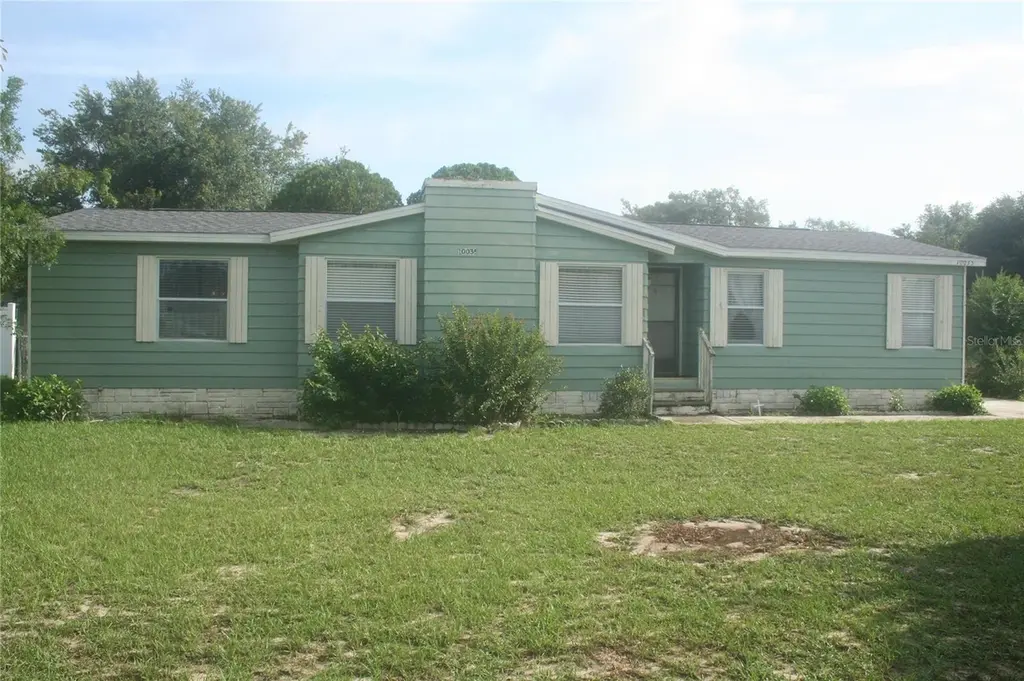
10035 SE 126th Ln · Ocklawaha, FL
Flood risk 1/10 · Minimal
- FEMA flood zone
- X (unshaded)
- Chance of flooding over 30 yrs
- 0.0%
- Est. flood insurance / yr
- $507 – $1,088
Fire risk 5/10 · Moderate
- Est. fire insurance / yr
- $947 – $1,759
Heat risk 9/10 · Severe
- Hot days now (above 109°F)
- 7 days/yr
- Hot days in 30 yrs
- 22 days/yr
Wind risk 9/10 · Severe
- Chance of severe wind over 30 yrs
- 99.0%
Air-quality risk 3/10 · Minor
- Unhealthy air days now
- 2 days/yr
- Unhealthy air days in 30 yrs
- 2 days/yr
Risk factors via First Street. Map © Google.
Why this score? — see what drove the C+ grade
The composite is a weighted blend of 9 inputs, each scored 0–100. Each bar is that input's sub-score; the figure is the points it added to the 100-point composite (weight × sub-score).
- Cash flow +28.4/30.0
- DSCR +10.0/10.0
- ARV discount +7.5/15.0
- 1% rule +6.6/10.0
- Schools +3.6/10.0
- Rent growth +2.5/5.0
- Livability +2.5/5.0
- Condition / age +2.5/5.0
- Appreciation +0.0/10.0
$159,900
🖨 Deal sheet 📄 Offer letter ✓ Due diligence
Listing remarks MLS
LARGE 3 BEDROOM 2 BATH MOBILE IN LAKE WEIR HEIGHTS IN BELLEVIEW! BEAUTIFUL FRONT AND BACK YARD. HUGE LIVING ROOM. SEPARATE DINING ROOM AND EAT IN COZY KITCHEN. SPLIT BEDROOM PLAN. LARGE MASTER BEDROOM. DUAL SINKS AND GARDEN TUB IN MASTER BATH. SCREENED IN BACK PORCH. STORAGE SHED OFF OF CARPORT. THIS IS ONE HOUSE YOU WILL LOVE TO MAKE YOUR HOME! EQUAL HOUSING OPPORTUNITY.
Key facts
- Walk-in closets
- Split bedroom plan
- Water pipes replaced
Tags
Property features AI
Finance
- Other: Lot approximately 0.25 acre (89 x 120); Zoning: R4
- Financial info: No lease restrictions; Homestead exempt
- HOA & community: No HOA
Exterior
- Parking: No parking details provided
- Utilities: Public water; Septic tank; Cable connected; Phone available; Water connected
- Home design: Manufactured home (double wide); Single-story; South-facing
- Construction: Metal siding; Metal roof; Pillar/post/pier foundation; Completed condition
- Exterior features: Shed(s); Asphalt road frontage; Public maintained road
Interior
- Kitchen: Range; Microwave; Refrigerator; Eat-in kitchen
- Bedrooms: 3 bedrooms
- Flooring: Carpet; Hardwood; Vinyl
- Bathrooms: 2 full bathrooms
- Heating & cooling: Central heating; Heat pump; Central air conditioning
- Interior features: Ceiling fans; Eat-in kitchen; Living/Dining room combo; Split bedroom layout; Vaulted ceilings; Walk-in closets; Aluminum frame windows
- Laundry & utility: Inside laundry room; Washer hookup; Electric dryer hookup
Neighborhood map
What this means for you Summary
Snapshot
- This is a 2-bed/2.0-bath manufactured listed at $160k.
Deal economics
- At list price, monthly cash flow is $518 ($6k/yr) — positive.
- The deal already cash-flows at list — no discount required.
- Meets the 1% rule at list price ($2k rent vs $160k).
- Recommended offer: $158k (1.5% below list) — sets the bar for market timing.
- Cap rate 10.2% vs local median 5.1% in Ocklawaha — top-decile yield for the area; either an underpriced asset or a hidden risk that comps aren't pricing in. Stress-test before assuming the spread holds.
Location & tenants
- Location reads: area grade C — affects rentability + tenant quality, not the cash-flow math above.
- Marion (rural): math 42% / reading 43% proficiency, ranked #61 of 73 in FL (top 84%) — families likely to look elsewhere, expect single-tenant / working-renter base with shorter leases; 61% free/reduced lunch — lower-income household profile, screen leases tightly.
- Market conditions: 357 active listings in the ZIP; 5 comparable units currently listed for rent nearby; rentals at typical pace (median 21d on market — plan ~3-4 weeks tenant-placement turnaround); 7,071 units permitted in Marion County in 2024 (534 in 5+ unit buildings).
Forward outlook
- Local home prices are declining (-3.0%/yr); year-one equity from $1k of loan paydown is wiped out by about $5k of value loss. Plan a longer hold.
- Marion County population projected at +13% by 2050 — modest demand growth; plan on rents tracking national, not racing it.
- At projected returns (-3.0% appreciation + 3.0% rent growth), your $45k cash investment doubles in ~9 years — after that, you're playing with house money.
Negotiation context
- It's been on market 17 days — a 2% lower offer ($158k) is reasonable based on typical stale-listing flexibility.
- 3 sale attempts since 21y ago with the ask held roughly flat each time — persistent listings suggest the price (not the market) is what's stuck; bring a comps-based counter.
- Current owner paid $27k; list at $160k implies a 488% gain — meaningful room to come down on a strong offer.
Risks & watch-outs
- Climate carrying-cost: severe wind risk, 99% chance of damaging wind over 30y; moderate wildfire risk; extreme-heat days projected 7→22/yr by 2055 (HVAC capex compounding) — expect insurance premiums to compound above CPI over the hold.
Questions for the listing agent
- Is there a deadline driving the sale (1031 exchange, divorce, estate, relocation)? That informs how much negotiation room exists.
- What's the average days-on-market for RENTAL listings here right now (not sales)? A rising rental-DOM trend means longer vacancies and softer asking-rent achievability than the comps imply.
- What's the recent tenant-quality profile in this submarket — average credit score on applications, eviction rate, late-payment / NSF rate, and stable-employment percentage? A property-management company in the area should have these aggregated.
- How much new for-sale + rental construction is in the pipeline within 1–3 miles? Heavy new supply typically softens prices + rents 12–24 months out; constrained supply supports both.
Investment metrics
- 1% rule
- 1.16% ✓
- Cap rate
- 10.18%
- Cash-on-cash
- 13.87%
- DSCR
- 1.62
- GRM
- 7.2
CMA / ARV
No comps found within radius.
Projected returns pro-forma
-3.0% appreciation · 3.0% rent growth · sell at horizon
- IRR
- 4.0%
- Equity multiple
- 1.16×
- Total profit
- $6,987
- Equity at exit
- $23,842
- IRR
- 13.5%
- Equity multiple
- 2.08×
- Total profit
- $48,260
- Equity at exit
- $13,825
Cash invested: $44,772 (down + closing). Projections, not guarantees.
Landlord ↔ Tenant lean methodology
- Overall (STATE)
- 87 Strongly Landlord-Friendly
- State Florida
- 87 Strongly Landlord-Friendly · R+3
- County
- — inherits STATE
- City
- — inherits STATE
ZIP-level market 34420
- Home prices YoY
- -32.8%
- Active inventory
- 357
- Price-to-rent
- 7.2×
Monthly cashflow live
- Estimated rent
- $1,860 high interval (Pro) →
- Mortgage (P&I)
- −$839
- Tax from tax record
- −$46 /mo · $556/yr
- Insurance
- −$67
- HOA
- −$0
- Vacancy / Maint / Mgmt
- −$391
- Net cashflow
- $518
Break-even live
UW: 25.0% down · 7.5% · 30yr · 1.5% tax · 5.0% vac · 8.0% maint · 8.0% mgmt
Financing live
Cash to close
- Down payment
- $39,975
- Closing costs
- $4,797
- Reserves months
- —
- Total cash needed
- —
Loan-product check · same deal, 3 products live
Conventional
25% down · 7.5% · 30yr
- Down + closing
- —
- Monthly P&I
- —
- Monthly cashflow
- —
- DSCR
- —
- Eligible?
- —
Personal DTI + credit; lowest rate.
DSCR
20% down · 8.5% · 30yr
- Down + closing
- —
- Monthly P&I
- —
- Monthly cashflow
- —
- DSCR
- —
- Eligible?
- —
No personal income docs; deal must DSCR.
Hard money
10% down · 12.0% · 12mo
- Down + closing
- —
- Monthly P&I
- —
- Monthly cashflow
- —
- DSCR
- —
- Eligible?
- —
Short-term bridge; refi at stabilization.
Rent comps 5 comps
| Address | Beds | Baths | Sqft | Rent | $/sqft | DOM | Units | Dist |
|---|---|---|---|---|---|---|---|---|
| 12495 SE 100th Ave Belleview, FL | 3.0 | 2.0 | 1568 | $1,850 | $1.18 | 14d | 1 | 0.18mi |
| 12257 SE 100th Ave Belleview, FL | 3.0 | 2.0 | 1555 | $1,650 | $1.06 | 14d | 1 | 0.43mi |
| 9484 SE 124th Loop Summerfield, FL | 2.0 | 2.0 | 1475 | $1,949 | $1.32 | 21d | 1 | 0.58mi |
| 9375 SE 134th St Summerfield, FL | 2.0 | 2.0 | 1284 | $2,300 | $1.79 | 21d | 1 | 0.90mi |
| 13421 SE 92nd Court Rd Summerfield, FL | 2.0 | 2.0 | 1374 | $1,800 | $1.31 | 21d | 1 | 1.04mi |
Listing history 20 events
-
2026-06-18days on market $159,900 Active 17 DOM
-
2026-06-17days on market $159,900 Active 16 DOM
-
2026-06-16days on market $159,900 Active 15 DOM
-
2026-06-15days on market $159,900 Active 14 DOM
-
2026-06-14days on market $159,900 Active 12 DOM
-
2026-06-13days on market $159,900 Active 11 DOM
-
2026-06-10days on market $159,900 Active 9 DOM
-
2026-06-09days on market $159,900 Active 8 DOM
-
2026-06-08days on market $159,900 Active 7 DOM
-
2026-06-07statusdays on market $159,900 Active 6 DOM
-
2026-06-03status $159,900 Pending 4 DOM
-
2026-06-02days on market $159,900 Active 4 DOM
-
2026-06-01days on market $159,900 Active 3 DOM
-
2026-05-31days on market $159,900 Active 2 DOM
-
2026-05-29$159,900 Active
-
2014-12-15soldstatus $27,200 374-char remark
Show marketing remark (374 chars)
LARGE 3 BEDROOM 2 BATH MOBILE IN LAKE WEIR HEIGHTS IN BELLEVIEW! BEAUTIFUL FRONT AND BACK YARD. HUGE LIVING ROOM. SEPARATE DINING ROOM AND EAT IN COZY KITCHEN. SPLIT BEDROOM PLAN. LARGE MASTER BEDROOM. DUAL SINKS AND GARDEN TUB IN MASTER BATH. SCREENED IN BACK PORCH. STORAGE SHED OFF OF CARPORT. THIS IS ONE HOUSE YOU WILL LOVE TO MAKE YOUR HOME! EQUAL HOUSING OPPORTUNITY.
-
2014-06-23$27,000 374-char remark
Show marketing remark (374 chars)
LARGE 3 BEDROOM 2 BATH MOBILE IN LAKE WEIR HEIGHTS IN BELLEVIEW! BEAUTIFUL FRONT AND BACK YARD. HUGE LIVING ROOM. SEPARATE DINING ROOM AND EAT IN COZY KITCHEN. SPLIT BEDROOM PLAN. LARGE MASTER BEDROOM. DUAL SINKS AND GARDEN TUB IN MASTER BATH. SCREENED IN BACK PORCH. STORAGE SHED OFF OF CARPORT. THIS IS ONE HOUSE YOU WILL LOVE TO MAKE YOUR HOME! EQUAL HOUSING OPPORTUNITY.
-
2005-10-10soldstatus $78,000
-
2005-06-09historical
-
2005-06-08$78,000
ⓘ Source: listings_history table (triggers on properties + properties_extension) + one-shot
backfill from property_details.listing_events for pre-trigger history.
Tax reassessment forecast FL · Resets to sale price
- Current annual tax
- $556 · $46/mo
- Projected year-2 tax
- $1,327 · $111/mo
- Expected delta
- +$771/yr (+$64/mo · 138.8%)
ⓘ Screening estimate from a state-policy table — verify with the county assessor before closing.
Climate risk First Street
- Flood 1/10 Low FEMA zone X (unshaded) · 0% chance over 30 yrs
- Wildfire 5/10 Major
- Heat 9/10 Extreme 7 d/yr ≥109°F today · 22 d/yr by 30 yrs out
- Wind 9/10 Extreme 99% chance of damaging wind over 30 yrs
- Air quality 3/10 Moderate 2 unhealthy d/yr today · 2 by 30 yrs out
Nearby sold comps map
Loading sold comps map…
Walkable amenities ~0.75 mi
Loading nearby amenities…
Taxation est. · year 1
- Rental income
- $22,314
- − Mortgage interest
- −$8,957
- − Property taxes
- −$556
- − Insurance
- −$800
- − Repairs & maintenance
- −$1,785
- − Management
- −$1,785
- − Depreciation
- −$4,652
- Taxable income
- $3,780
- Est. tax owed @ 24.0%
- −$907
- After-tax cash flow
- $5,303/yr
For passive investors: Depreciation is non-cash, so a rental often shows a tax loss while cash-flowing — sheltering income. Rental losses are passive: they offset passive income freely, and up to $25,000/yr can offset ordinary (W-2) income if you actively participate and your MAGI is under $100k (phasing out to $0 by $150k); unused losses carry forward. On sale, claimed depreciation is recaptured at up to 25%, and gains may owe capital-gains tax (a 1031 exchange can defer both). Figures are a year-1 estimate at your 24.0% rate — not tax advice; consult a CPA.
Schools (NCES district)
- District
- Marion
- NCES district ID
- 1201260
- Math proficiency
- 42% ▼ -7.00%
- Reading proficiency
- 43% ▼ -4.00%
- Median HH income
- $40,015
- Composite
- 35.61/100
- National rank
- #4890
- State rank
- #61 of 73 in FL
Livability — Ocklawaha
No livability data for this city. (Only ~50 U.S. cities are tracked.)
Census & demographics
- City population
- 9,318
- Population (ZIP)
- 19,167
Population outlook (Marion County) Hauer SSP2
- Today (2025)
- 365,905 people
- By 2030
- 376,768 · +3.0%
- By 2040
- 396,555 · +8.4%
- By 2050
- 412,723 · +12.8%
- By 2075
- 446,090 · +21.9%
- By 2100
- 436,193 · +19.2%
Race, ethnicity, and origin ACS 2023
- Neighborhood character
- Predominantly White (81%)
- Race & ethnicity
- White 81% Hispanic / Latino 12% Two or more races 10% Black 1%
- Hispanic origin (detail)
- Puerto Rican 7% Cuban 2%
- Common ancestry
- Lithuanian 4% Iranian 2% Romanian 2%
- Foreign-born
- 5% · Canada, Jamaica
- Languages at home
- 89% English-only · Spanish 7% Other Indo-European 2% German/W. Germanic 1%
Political lean MEDSL · Marion
- 2024 margin
- Solid R (+31.6) · D 33.8% · R 65.5%
- 2008→2024 swing
- -20.0pp toward R · 2008: -11.6pp · 2024: -31.6pp
- All cycles
- 2024: R+31.6 2020: R+25.9 2016: R+26.2 2012: R+16.2 2008: R+11.6
Not yet ingested
- Civics
- —
Market trends
- HPI YoY
- ▼ -120.90%
- Current HPI
- 247.3176
- Rent YoY
- —
- Metro
- —
- State GDP YoY
- ▲ 3.28%
- F500 in state
- 36
Industry mix (Fortune 500 HQ in FL)
| Industry | F500 HQs | Revenue |
|---|---|---|
| Industrial Technology | 2 | $29B |
|
||
| Insurance | 2 | $17B |
|
||
| Retail | 1 | $60B |
|
||
| Technology Distribution | 1 | $58B |
|
||
| Homebuilding | 1 | $35B |
|
||
| Technology Manufacturing | 1 | $35B |
|
||
Price history
+105.0% since first listed6 events — show timeline
- 2026-05-29 Listed $159,900 Stellar MLS as Distributed by MLS Grid
- 2014-12-15 Sold (MLS) $27,200 Stellar MLS as Distributed by MLS Grid
- 2014-06-23 Listed $27,000 Stellar MLS as Distributed by MLS Grid
- 2005-10-10 Sold (Public Records) $78,000 Public Records
- 2005-06-09 Listing Removed — Stellar MLS as Distributed by MLS Grid
- 2005-06-08 Listed $78,000 Stellar MLS as Distributed by MLS Grid
Property tax history
-1.8%/yrLatest (2025): $556 · +68.4% YoY. Source: county tax records.
Cash-flow waterfall
monthlySold comps — $/sqft
last 12 mo · ≤1 miLoading sold comps…