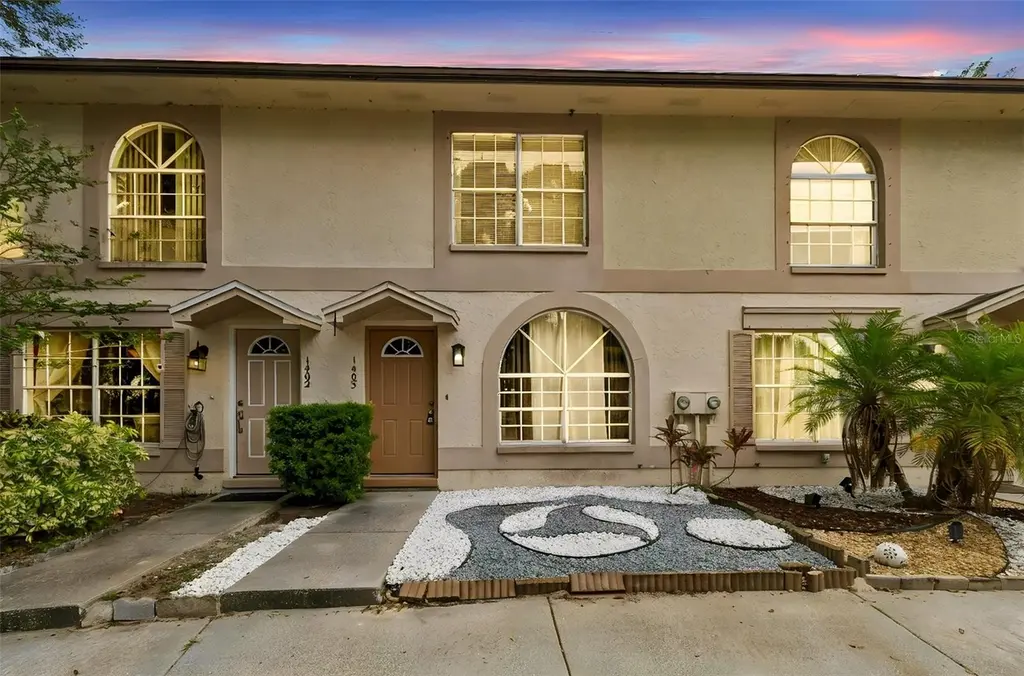
1403 Brigadoon Dr · Clearwater, FL
Flood risk 1/10 · Minimal
- FEMA flood zone
- X (unshaded)
- Chance of flooding over 30 yrs
- 0.0%
- Est. flood insurance / yr
- $507 – $1,088
Fire risk 1/10 · Minimal
- Est. fire insurance / yr
- $947 – $1,759
Heat risk 10/10 · Severe
- Hot days now (above 107°F)
- 7 days/yr
- Hot days in 30 yrs
- 24 days/yr
Wind risk 10/10 · Severe
- Chance of severe wind over 30 yrs
- 99.0%
Air-quality risk 3/10 · Minor
- Unhealthy air days now
- 3 days/yr
- Unhealthy air days in 30 yrs
- 3 days/yr
Risk factors via First Street. Map © Google.
Why this score? — see what drove the D grade
The composite is a weighted blend of 9 inputs, each scored 0–100. Each bar is that input's sub-score; the figure is the points it added to the 100-point composite (weight × sub-score).
- Cash flow +12.2/30.0
- ARV discount +7.5/15.0
- 1% rule +4.8/10.0
- Schools +4.3/10.0
- Livability +4.1/5.0
- DSCR +3.6/10.0
- Condition / age +2.5/5.0
- Rent growth +1.1/5.0
- Appreciation +0.0/10.0
$200,000
🖨 Deal sheet 📄 Offer letter ✓ Due diligence
Listing remarks MLS
Townhouse located next to a great park with walking and biking trails to Courtney Causeway where you can enjoy Tampa Bay. This home has a nice back yard to sit and enjoy the water view at Kapok park. 2 level townhouse with 2 bedrooms on the 2nd level with a full bath. First floor has open Livingroom and kitchen with a counter divider. A half bath to accommodate guests. Screened patio off the backside of the home where you will find a washer/dryer room with storage. Newer kitchen appliances and laminate flooring throughout. Roof and AC about 10yrs old. New Hot water heater. Exterior painted a few years ago. Pet-friendly community that is centrally located. Close to shopping and dining. Short distance to the beach.
Key facts
- Fully remodeled
- New shower
- Move in ready
Tags
Property features AI
Finance
- Other: Unfurnished; Unit is on floor 1; Condo land included; Approximate living area 896 square feet
- HOA & community: Monthly HOA fee of $187 (includes structure maintenance); Association required (Proactive Property Mngmt/Katie); Community pool; Pets allowed
Exterior
- Utilities: Public water; Public sewer; Cable connected; Broadband/high-speed internet available; Electricity connected; Water connected; Sewer connected
- Home design: Townhouse (Residential); Two stories; Faces northwest; Entry on first floor
- Construction: Stucco and frame construction; Shingle roof; Slab foundation; Built on 2 levels
- Exterior features: Rain gutters; Sidewalk
Interior
- Kitchen: Dishwasher; Microwave; Range; Refrigerator
- Bedrooms: 2 bedrooms
- Bathrooms: 1 full bath; 1 half bath
- Heating & cooling: Central heating; Central air conditioning
- Interior features: Ceiling fans
- Laundry & utility: Dedicated laundry room
Neighborhood map
What this means for you Summary
Snapshot
- This is a 2-bed/1.5-bath townhouse listed at $200k.
Deal economics
- At list price, monthly cash flow is $-41 ($-491/yr) — negative.
- To cash-flow at today's rent, offer at most $193k (3.6% below list).
- To meet the 1% rule (rent ≥ 1% of price), the offer needs to be $197k (1.7% below list).
- Recommended offer: $193k (3.6% below list) — sets the bar for cash-flow.
- Cap rate 6.0% vs local median 2.9% in Clearwater — top-decile yield for the area; either an underpriced asset or a hidden risk that comps aren't pricing in. Stress-test before assuming the spread holds.
Location & tenants
- Location reads 82/100 on livability (#60 in FL, #988 nationally) — a professional / high-income tenant draw. Strengths: commute A+, housing A+, health & safety A+; Watch: schools C-, employment C-.
- Pinellas (suburban): math 51% / reading 51% proficiency, ranked #31 of 73 in FL (top 42%) — acceptable for families but not a draw, mixed tenant base, ~2y average lease.
- Market conditions: Rents falling (-5.6%/yr); 116 active listings in the ZIP; 40 comparable units currently listed for rent nearby; rentals leasing fast (median 8d on market — plan ~1-2 weeks tenant-placement turnaround); 2,676 units permitted in Pinellas County in 2024 (1,422 in 5+ unit buildings).
- This rent runs 35% of the median local income ($67k/yr) — at the standard rent-burdened threshold; future hikes will face affordability resistance.
Forward outlook
- Local home prices are declining (-3.0%/yr); year-one equity from $1k of loan paydown is wiped out by about $6k of value loss. Plan a longer hold.
- Pinellas County population projected at +14% by 2050 — modest demand growth; plan on rents tracking national, not racing it.
Negotiation context
- Only 8 days on market — expect competitive offers; lowballing is unlikely to land.
- 2 sale attempts since 9y ago with the ask held roughly flat each time — persistent listings suggest the price (not the market) is what's stuck; bring a comps-based counter.
- Current owner paid $135k; 48% above their basis — modest negotiation headroom, anchor on the comps not their cost.
Risks & watch-outs
- Climate carrying-cost: severe wind risk, 99% chance of damaging wind over 30y; extreme-heat days projected 7→24/yr by 2055 (HVAC capex compounding) — expect insurance premiums to compound above CPI over the hold.
Questions for the listing agent
- What do current leases actually rent for vs. the listed asking? Can we see a recent rent roll and the last 12 months of T-12 income?
- What does the HOA fee cover, when was the last increase, and are there any pending special assessments or reserve-fund shortfalls?
- Is there a deadline driving the sale (1031 exchange, divorce, estate, relocation)? That informs how much negotiation room exists.
- The area grade is low — what's the realistic commute time and amenity access for the typical tenant pool here? Any planned neighborhood developments (good or bad) we should know about?
- What's the average days-on-market for RENTAL listings here right now (not sales)? A rising rental-DOM trend means longer vacancies and softer asking-rent achievability than the comps imply.
- What's the recent tenant-quality profile in this submarket — average credit score on applications, eviction rate, late-payment / NSF rate, and stable-employment percentage? A property-management company in the area should have these aggregated.
- How much new for-sale + rental construction is in the pipeline within 1–3 miles? Heavy new supply typically softens prices + rents 12–24 months out; constrained supply supports both.
Investment metrics
- 1% rule
- 0.98% ✗
- Cap rate
- 6.05%
- Cash-on-cash
- -0.88%
- DSCR
- 0.96
- GRM
- 8.5
CMA / ARV
- ARV (on-the-fly)
- $127,232
- Comps found
- 1
Show comp detail 1 sale within ~0.75 mi
| Address | Dist | Beds/Ba | Sqft | Sold | Price | $/sf | Match |
|---|---|---|---|---|---|---|---|
| 2979 Mission Dr E | 0.58mi | 2/1.0 | 812 (-9%) | 21mo | $115,000 | $142 | 38 |
Match score weights: distance 35% · size 25% · config 20% · recency 20%. Top-matched comps best support the ARV.
Projected returns pro-forma
-3.0% appreciation · 0.0% rent growth · sell at horizon
- IRR
- -21.6%
- Equity multiple
- 0.27×
- Total profit
- $-40,615
- Equity at exit
- $29,821
- IRR
- -26.9%
- Equity multiple
- -0.08×
- Total profit
- $-60,333
- Equity at exit
- $17,292
Cash invested: $56,000 (down + closing). Projections, not guarantees.
Landlord ↔ Tenant lean methodology
- Overall (STATE)
- 87 Strongly Landlord-Friendly
- State Florida
- 87 Strongly Landlord-Friendly · R+3
- County
- — inherits STATE
- City
- — inherits STATE
ZIP-level market 33759
- Rents YoY
- -5.6%
- Active inventory
- 116
- Price-to-rent
- 8.5×
Monthly cashflow live
- Estimated rent
- $1,965 high interval (Pro) →
- Mortgage (P&I)
- −$1,049
- Tax from tax record
- −$274 /mo · $3,293/yr
- Insurance
- −$83
- HOA
- −$187
- Vacancy / Maint / Mgmt
- −$413
- Net cashflow
- $-41
Break-even live
UW: 25.0% down · 7.5% · 30yr · 1.5% tax · 5.0% vac · 8.0% maint · 8.0% mgmt
Financing live
Cash to close
- Down payment
- $50,000
- Closing costs
- $6,000
- Reserves months
- —
- Total cash needed
- —
Loan-product check · same deal, 3 products live
Conventional
25% down · 7.5% · 30yr
- Down + closing
- —
- Monthly P&I
- —
- Monthly cashflow
- —
- DSCR
- —
- Eligible?
- —
Personal DTI + credit; lowest rate.
DSCR
20% down · 8.5% · 30yr
- Down + closing
- —
- Monthly P&I
- —
- Monthly cashflow
- —
- DSCR
- —
- Eligible?
- —
No personal income docs; deal must DSCR.
Hard money
10% down · 12.0% · 12mo
- Down + closing
- —
- Monthly P&I
- —
- Monthly cashflow
- —
- DSCR
- —
- Eligible?
- —
Short-term bridge; refi at stabilization.
Rent comps 40 comps
| Address | Beds | Baths | Sqft | Rent | $/sqft | DOM | Units | Dist |
|---|---|---|---|---|---|---|---|---|
| 1602 Brigadoon Dr Clearwater, FL | 2.0 | 1.5 | 896 | $1,800 | $2.01 | 4d | 1 | 0.06mi |
| 2403 Brigadoon Dr Clearwater, FL | 2.0 | 2.5 | 1088 | $3,100 | $2.85 | 4d | 1 | 0.14mi |
| 1285 Mission Hills Blvd Unit 36B Clearwater, FL | 2.0 | 1.0 | 812 | $1,500 | $1.85 | 3d | 1 | 0.35mi |
| 1301 Fairwood Ave Clearwater, FL | 3.0 | 2.0 | 1104 | $2,355 | $2.13 | 4d | 1 | 0.46mi |
| 530 Fairwood Ave Clearwater, FL | 2.0–3.0 | 1.0–2.0 | 1042 | $1,309 | $1.26 | 2d | 27 | 0.51mi |
| 1403 Arrowhead Cir W Unit 13E Clearwater, FL | 2.0 | 2.0 | 886 | $1,750 | $1.98 | 24d | 1 | 0.52mi |
| 2690 Drew St Clearwater, FL | 1.0–3.0 | 1.0–2.0 | 974 | $1,500 | $1.54 | 1d | 12 | 0.62mi |
| 2973 Feather Dr Clearwater, FL | 2.0 | 1.0 | 812 | $1,450 | $1.79 | 24d | 1 | 0.64mi |
| 3021 State Road 590 Clearwater, FL | 1.0–3.0 | 1.0–2.0 | 977 | $1,788 | $1.83 | 1d | 28 | 0.64mi |
| 2600 W Grand Reserve Cir Clearwater, FL | 1.0–3.0 | 1.0–2.0 | 1097 | $2,145 | $1.96 | 1d | 36 | 0.64mi |
| 2973 Gulf to Bay Blvd Unit 2 Clearwater, FL | 2.0 | 2.0 | 1064 | $3,219 | $3.03 | 24d | 1 | 0.80mi |
| 205 S McMullen Booth Rd #203 Clearwater, FL | 2.0 | 1.0 | 1087 | $999 | $0.92 | 14d | 1 | 0.84mi |
| 2975 Gulf To Bay Blvd Clearwater, FL | 2.0 | 1.0–2.0 | 874 | $5,180 | $5.92 | 4d | 49 | 0.84mi |
| 209 S McMullen Booth Rd #188 Clearwater, FL | 1.0 | 1.0 | 747 | $2,200 | $2.95 | 16d | 1 | 0.86mi |
| 239 S McMullen Booth Rd #38 Clearwater, FL | 1.0 | 1.0 | 747 | $2,000 | $2.68 | 24d | 1 | 0.87mi |
| 361 S McMullen Booth Rd #112 Clearwater, FL | 1.0 | 1.0 | 747 | $2,000 | $2.68 | 24d | 1 | 0.89mi |
| 420 N Bayshore Blvd #102 Clearwater, FL | 2.0 | 2.0 | 1030 | $1,680 | $1.63 | 4d | 1 | 0.89mi |
| 343 S McMullen Booth Rd #151 Clearwater, FL | 1.0 | 1.0 | 900 | $1,800 | $2.00 | 24d | 1 | 0.90mi |
| 341 S McMullen Booth Rd #145 Clearwater, FL | 1.0 | 1.0 | 863 | $1,195 | $1.38 | 1d | 1 | 0.90mi |
| 2909 Gulf To Bay Blvd Clearwater, FL | 1.0–2.0 | 1.0–2.0 | 931 | $1,849 | $1.98 | 3d | 9 | 0.91mi |
| 2625 Florida 590 Unit 1414 Clearwater, FL | 1.0 | 1.0 | 600 | $1,300 | $2.17 | 24d | 1 | 0.92mi |
| 353 S McMullen Booth Rd #133 Clearwater, FL | 1.0 | 1.0 | 747 | $1,450 | $1.94 | 24d | 1 | 0.92mi |
| 2981 Gulf To Bay Blvd Clearwater, FL | 1.0–3.0 | 1.0–2.0 | 1198 | $4,145 | $3.46 | 3d | 27 | 0.92mi |
| 351 S McMullen Booth Rd #129 Clearwater, FL | 1.0 | 1.0 | 863 | $1,300 | $1.51 | 14d | 1 | 0.93mi |
| 383 S McMullen Booth Rd #68 Clearwater, FL | 2.0 | 1.0 | 1087 | $1,950 | $1.79 | 4d | 1 | 0.93mi |
| 359 S McMullen Booth Rd #122 Clearwater, FL | 1.0 | 1.0 | 747 | $1,290 | $1.73 | 7d | 1 | 0.93mi |
| 389 S McMullen Booth Rd #12 Clearwater, FL | 2.0 | 1.0 | 968 | $1,395 | $1.44 | 24d | 1 | 0.94mi |
| 237 S McMullen Booth Rd #50 Clearwater, FL | 1.0 | 1.0 | 747 | $1,500 | $2.01 | 24d | 1 | 0.94mi |
| 1730 Audrey Dr Unit 2 Clearwater, FL | 1.0 | 1.0 | 700 | $2,100 | $3.00 | 24d | 1 | 1.03mi |
| 101 S Old Coachman Rd Clearwater, FL | 3.0 | 1.0–2.0 | 983 | $2,296 | $2.34 | 3d | 16 | 1.08mi |
| 730 N Old Coachman Rd Clearwater, FL | 2.0 | 2.0 | 950 | $1,705 | $1.79 | 2d | 3 | 1.11mi |
| 2481 NE Coachman Rd Clearwater, FL | 1.0–2.0 | 1.0–2.0 | 762 | $2,023 | $2.65 | 1d | 14 | 1.20mi |
| 2729 Seville Blvd Clearwater, FL | 1.0–3.0 | 1.0–2.0 | 1057 | $2,432 | $2.30 | 1d | 33 | 1.25mi |
| 2550 Stag Run Blvd Clearwater, FL | 1.0–3.0 | 1.0–2.0 | 1189 | $1,870 | $1.57 | 1d | 19 | 1.30mi |
| 1001 Pearce Dr #302 Clearwater, FL | 1.0 | 1.5 | 1048 | $1,750 | $1.67 | 4d | 1 | 1.33mi |
| 1003 S Bayshore Blvd #103 Safety Harbor, FL | 2.0 | 2.0 | 900 | $2,300 | $2.56 | 24d | 1 | 1.37mi |
| 1160 7th St S Safety Harbor, FL | 2.0 | 1.0 | 650 | $1,645 | $2.53 | 7d | 1 | 1.40mi |
| 1158 7th St S Unit 1160 Safety Harbor, FL | 2.0 | 1.0 | 650 | $1,645 | $2.53 | 7d | 1 | 1.41mi |
| 2 N Fernwood Ave #14 Clearwater, FL | 2.0 | 1.0 | 800 | $1,550 | $1.94 | 12d | 1 | 1.41mi |
| 2 N Fernwood Ave Clearwater, FL | 2.0 | 1.0 | 800 | $1,650 | $2.06 | 24d | 1 | 1.41mi |
HOA detail
- Monthly dues
- $187 · $2,244/yr
- Likely covers
- water
Listing history 5 events
-
2026-06-13statusdays on market $200,000 Pending 8 DOM
-
2026-06-09days on market $200,000 Active 4 DOM
-
2026-06-08days on market $200,000 Active 3 DOM
-
2026-06-07remarks 657-char remark
-
2026-06-07$200,000 Active 2 DOM
ⓘ Source: listings_history table (triggers on properties + properties_extension) + one-shot
backfill from property_details.listing_events for pre-trigger history.
Tax reassessment forecast FL · Resets to sale price
- Current annual tax
- $3,293 · $274/mo
- Projected year-2 tax
- $3,293 · $274/mo
- Expected delta
- $0/yr ($0/mo · 0.0%)
ⓘ Screening estimate from a state-policy table — verify with the county assessor before closing.
Climate risk First Street
- Flood 1/10 Low FEMA zone X (unshaded) · 0% chance over 30 yrs
- Wildfire 1/10 Low
- Heat 10/10 Extreme 7 d/yr ≥107°F today · 24 d/yr by 30 yrs out
- Wind 10/10 Extreme 99% chance of damaging wind over 30 yrs
- Air quality 3/10 Moderate 3 unhealthy d/yr today · 3 by 30 yrs out
Nearby sold comps map
Loading sold comps map…
Walkable amenities ~0.75 mi
Loading nearby amenities…
Taxation est. · year 1
- Rental income
- $23,585
- − Mortgage interest
- −$11,203
- − Property taxes
- −$3,293
- − Insurance
- −$1,000
- − Repairs & maintenance
- −$1,887
- − Management
- −$1,887
- − HOA
- −$2,244
- − Depreciation
- −$5,818
- Taxable loss
- −$3,747
- Est. tax savings @ 24.0%
- +$899
- After-tax cash flow
- $408/yr
For passive investors: Depreciation is non-cash, so a rental often shows a tax loss while cash-flowing — sheltering income. Rental losses are passive: they offset passive income freely, and up to $25,000/yr can offset ordinary (W-2) income if you actively participate and your MAGI is under $100k (phasing out to $0 by $150k); unused losses carry forward. On sale, claimed depreciation is recaptured at up to 25%, and gains may owe capital-gains tax (a 1031 exchange can defer both). Figures are a year-1 estimate at your 24.0% rate — not tax advice; consult a CPA.
Schools (NCES district)
- District
- Pinellas
- NCES district ID
- 1201560
- Math proficiency
- 51% ▼ -5.00%
- Reading proficiency
- 51% ▼ -3.00%
- Median HH income
- $46,270
- Composite
- 43.27/100
- National rank
- #3046
- State rank
- #31 of 73 in FL
Livability — Clearwater
- Score
- 82/100
- State rank
- #60
- US rank
- #988
Category grades
Schools grade is shown separately in the Schools card above.
Census & demographics
- Census place
- Clearwater, FL
- County
- Pinellas County · 939,478 people
- City population
- 170,933
- Metro
- Tampa-St. Petersburg-Clearwater, FL
- Population (ZIP)
- 17,557
- Household income
- $67,492
- Rent vs Own
- Severe rent burden
- 1209.0
Population outlook (Pinellas County) Hauer SSP2
- Today (2025)
- 1,027,532 people
- By 2030
- 1,063,586 · +3.5%
- By 2040
- 1,125,020 · +9.5%
- By 2050
- 1,168,637 · +13.7%
- By 2075
- 1,265,188 · +23.1%
- By 2100
- 1,260,357 · +22.7%
Race, ethnicity, and origin ACS 2023
- Neighborhood character
- Majority White (65%)
- Race & ethnicity
- White 65% Hispanic / Latino 19% Two or more races 14% Black 7% Asian 3%
- Hispanic origin (detail)
- Mexican 7% Puerto Rican 3% Cuban 3%
- Common ancestry
- Romanian 4% Slovak 3% Italian 2%
- Foreign-born
- 16% · Canada, Jamaica, Vietnam
- Languages at home
- 79% English-only · Spanish 12% Other Indo-European 4% Russian/Polish/Slavic 1%
Political lean MEDSL · Pinellas
- 2024 margin
- Lean R (+5.2) · D 46.9% · R 52.1%
- 2008→2024 swing
- -13.5pp toward R · 2008: 8.3pp · 2024: -5.2pp
- All cycles
- 2024: R+5.2 2020: D+0.2 2016: R+1.1 2012: D+5.6 2008: D+8.3
Not yet ingested
- Civics
- —
Market trends
- HPI YoY
- ▼ -249.16%
- Current HPI
- 343.0721
- Rent YoY
- ▼ -5.57%
- Metro
- Tampa-St. Petersburg-Clearwater, FL
- State GDP YoY
- ▲ 3.28%
- F500 in state
- 36
Industry mix (Fortune 500 HQ in FL)
| Industry | F500 HQs | Revenue |
|---|---|---|
| Industrial Technology | 2 | $29B |
|
||
| Insurance | 2 | $17B |
|
||
| Retail | 1 | $60B |
|
||
| Technology Distribution | 1 | $58B |
|
||
| Homebuilding | 1 | $35B |
|
||
| Technology Manufacturing | 1 | $35B |
|
||
Price history
-79.6% since first listed8 events — show timeline
- 2026-06-06 Listed $200,000 Stellar MLS as Distributed by MLS Grid
- 2023-02-20 Sold (Public Records) $135,000 Public Records
- 2017-06-12 Sold (Public Records) $85,000 Public Records
- 2017-06-07 Sold (MLS) $85,000 Stellar MLS as Distributed by MLS Grid
- 2017-04-07 Pending — Stellar MLS as Distributed by MLS Grid
- 2017-03-18 Listed $115,500 Stellar MLS as Distributed by MLS Grid
- 1987-05-18 Sold (Public Records) $981,000 Public Records
- 1987-05-01 Sold (Public Records) $981,000 Public Records
Property tax history
+12.3%/yrLatest (2025): $3,293 · +8.4% YoY. Source: county tax records.
Cash-flow waterfall
monthlySold comps — $/sqft
last 12 mo · ≤1 miLoading sold comps…