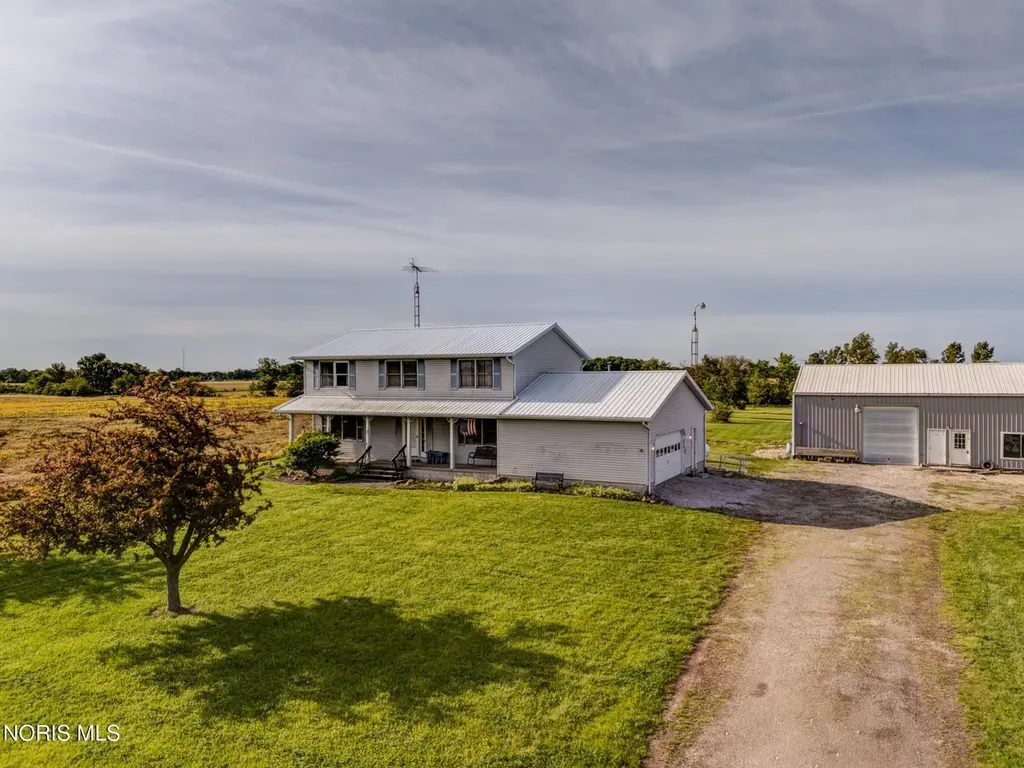
12640 W State Route 163 · Oak Harbor, OH
Flood risk 1/10 · Minimal
- FEMA flood zone
- X (unshaded)
- Chance of flooding over 30 yrs
- 0.0%
- Est. flood insurance / yr
- $473 – $860
Fire risk 1/10 · Minimal
- Est. fire insurance / yr
- $713 – $1,323
Heat risk 3/10 · Minor
- Hot days now (above 98°F)
- 7 days/yr
- Hot days in 30 yrs
- 17 days/yr
Wind risk 2/10 · Minimal
- Chance of severe wind over 30 yrs
- —
Air-quality risk 2/10 · Minimal
- Unhealthy air days now
- 1 days/yr
- Unhealthy air days in 30 yrs
- 2 days/yr
Risk factors via First Street. Map © Google.
Why this score? — see what drove the D- grade
The composite is a weighted blend of 9 inputs, each scored 0–100. Each bar is that input's sub-score; the figure is the points it added to the 100-point composite (weight × sub-score).
- Cash flow +9.2/30.0
- ARV discount +7.5/15.0
- Schools +6.6/10.0
- Livability +3.8/5.0
- 1% rule +3.3/10.0
- DSCR +2.6/10.0
- Rent growth +2.5/5.0
- Condition / age +2.5/5.0
- Appreciation +0.0/10.0
$150,000
🖨 Deal sheet 📄 Offer letter ✓ Due diligence
Listing remarks
Live On-Site Real Estate Auction! Minimum Bid $150,000. Auction date is June 13th at 11am with preview and registration at 10am. Situated on 2.15 Acres in Oak Harbor, surrounded by open space and scenic views, this is perfect for those seeking a quieter lifestyle, yet still conveniently located! 3,108 Sq. Ft with 4-bedrooms, 2-baths and a full basement. Spacious 36 x 47 pole barn, ideal for equipment, hobbies or workshop. This home has it all! Whether you're looking for space, privacy, or an investment opportunity, this property delivers! Info & Terms on Auctioneer's website. Open House Event June 8th 3-6pm. 10% Buyer's Premium.
Key facts
- 2.15 acre lot
- 4 parking spots
- Built 1989
Property features AI
Exterior
- Parking: Parking for 4 vehicles; Driveway
- Utilities: Electricity connected (150 amp service); Propane available; Septic tank; Well water
- Home design: Single-family house; Two levels
- Construction: Vinyl siding; Shingle roof; Block foundation; Has basement (block)
- Exterior features: Fire pit; Ramped access; Deck; Front porch; Barn(s)
Interior
- Kitchen: Eat-in kitchen; Refrigerator; Water heater
- Bedrooms: Bedroom 2 on Upper level (approx. 15 x 11); Bedroom 3 on Upper level (approx. 15 x 12); Bedroom 4 on Upper level (approx. 12 x 9)
- Flooring: Carpet; Ceramic tile
- Bathrooms: 2 full bathrooms
- Heating & cooling: Propane heating; Central air conditioning
- Interior features: Built-in shower chair; Double vanity; Eat-in kitchen; Roll-in shower; Storage; Walk-in closets; Primary bathroom; Double-pane windows
- Laundry & utility: Laundry on main level
Neighborhood map
What this means for you Summary
Snapshot
- This is a 3-bed/2.0-bath single-family listed at $150k.
Deal economics
- At list price, monthly cash flow is $-113 ($-1k/yr) — negative.
- To cash-flow at today's rent, offer at most $130k (13.3% below list).
- To meet the 1% rule (rent ≥ 1% of price), the offer needs to be $124k (17.4% below list).
- Recommended offer: $124k (17.4% below list) — sets the bar for 1% rule.
- Cap rate 5.4% vs local median 2.2% in Oak Harbor — top-decile yield for the area; either an underpriced asset or a hidden risk that comps aren't pricing in. Stress-test before assuming the spread holds.
Location & tenants
- Location reads 76/100 on livability (#211 in OH, #3,308 nationally) — a middle-class / working-renter tenant base. Strengths: crime A+, cost of living A+, housing A+; Watch: employment D, amenities F, commute F.
- Benton Carroll Salem Local (town): math 79% / reading 76% proficiency, ranked #74 of 656 in OH (top 11%) — strong family-tenant draw, lease renewals of 3-5y typical.
- Zoned schools: Oak Harbor High School (math 75% / reading 80%, grade A-, #52 of 781 statewide, top 7%, 673 students, 25% FRL) — zoned schools at 25% FRL track the district average.
- Market conditions: 42 active listings in the ZIP; 128 units permitted in Ottawa County in 2024 (0 in 5+ unit buildings).
Forward outlook
- Local home prices are declining (-3.0%/yr); year-one equity from $1k of loan paydown is wiped out by about $4k of value loss. Plan a longer hold.
- Ottawa County population projected at -19% by 2050 — secular population decline; favor cash flow + early exit over multi-decade hold.
Negotiation context
- It's been on market 26 days — a 2% lower offer ($148k) is reasonable based on typical stale-listing flexibility.
Questions for the listing agent
- What do current leases actually rent for vs. the listed asking? Can we see a recent rent roll and the last 12 months of T-12 income?
- Is there a deadline driving the sale (1031 exchange, divorce, estate, relocation)? That informs how much negotiation room exists.
- Schools are A-rated — typically a magnet for longer-tenancy family renters. What's the average tenant stay here, and is there a school-zone premium baked into asking?
- The area grade is low — what's the realistic commute time and amenity access for the typical tenant pool here? Any planned neighborhood developments (good or bad) we should know about?
- What's the average days-on-market for RENTAL listings here right now (not sales)? A rising rental-DOM trend means longer vacancies and softer asking-rent achievability than the comps imply.
- What's the recent tenant-quality profile in this submarket — average credit score on applications, eviction rate, late-payment / NSF rate, and stable-employment percentage? A property-management company in the area should have these aggregated.
- How much new for-sale + rental construction is in the pipeline within 1–3 miles? Heavy new supply typically softens prices + rents 12–24 months out; constrained supply supports both.
Investment metrics
- 1% rule
- 0.83% ✗
- Cap rate
- 5.39%
- Cash-on-cash
- -3.22%
- DSCR
- 0.86
- GRM
- 10.1
CMA / ARV
No comps found within radius.
Projected returns pro-forma
-3.0% appreciation · 3.0% rent growth · sell at horizon
- IRR
- -21.6%
- Equity multiple
- 0.25×
- Total profit
- $-31,440
- Equity at exit
- $22,365
- IRR
- -15.3%
- Equity multiple
- 0.13×
- Total profit
- $-36,419
- Equity at exit
- $12,969
Cash invested: $42,000 (down + closing). Projections, not guarantees.
Landlord ↔ Tenant lean methodology
- Overall (STATE)
- 73 Landlord-Friendly
- State Ohio
- 73 Landlord-Friendly · R+6
- County
- — inherits STATE
- City
- — inherits STATE
ZIP-level market 43449
- Home prices YoY
- -29.3%
- Active inventory
- 42
- Price-to-rent
- 10.1×
Monthly cashflow live
- Estimated rent
- $1,239 medium interval (Pro) →
- Mortgage (P&I)
- −$787
- Tax from tax record
- −$242 /mo · $2,908/yr
- Insurance
- −$62
- HOA
- −$0
- Vacancy / Maint / Mgmt
- −$260
- Net cashflow
- $-113
Break-even live
UW: 25.0% down · 7.5% · 30yr · 1.5% tax · 5.0% vac · 8.0% maint · 8.0% mgmt
Financing live
Cash to close
- Down payment
- $37,500
- Closing costs
- $4,500
- Reserves months
- —
- Total cash needed
- —
Loan-product check · same deal, 3 products live
Conventional
25% down · 7.5% · 30yr
- Down + closing
- —
- Monthly P&I
- —
- Monthly cashflow
- —
- DSCR
- —
- Eligible?
- —
Personal DTI + credit; lowest rate.
DSCR
20% down · 8.5% · 30yr
- Down + closing
- —
- Monthly P&I
- —
- Monthly cashflow
- —
- DSCR
- —
- Eligible?
- —
No personal income docs; deal must DSCR.
Hard money
10% down · 12.0% · 12mo
- Down + closing
- —
- Monthly P&I
- —
- Monthly cashflow
- —
- DSCR
- —
- Eligible?
- —
Short-term bridge; refi at stabilization.
Listing history 12 events
-
2026-06-13statusdays on market $150,000 Pending 26 DOM
-
2026-06-12days on market $150,000 Active 25 DOM
-
2026-06-09days on market $150,000 Active 22 DOM
-
2026-06-08days on market $150,000 Active 21 DOM
-
2026-06-07days on market $150,000 Active 20 DOM
-
2026-06-07days on market $150,000 Active 19 DOM
-
2026-06-04days on market $150,000 Active 16 DOM
-
2026-06-02days on market $150,000 Active 15 DOM
-
2026-06-01days on market $150,000 Active 14 DOM
-
2026-05-31days on market $150,000 Active 13 DOM
-
2026-05-18$150,000 Active
-
2026-05-06historical $150,000
ⓘ Source: listings_history table (triggers on properties + properties_extension) + one-shot
backfill from property_details.listing_events for pre-trigger history.
Tax reassessment forecast OH · Partial reset (capped growth)
- Current annual tax
- $2,908 · $242/mo
- Projected year-2 tax
- $2,908 · $242/mo
- Expected delta
- $0/yr ($0/mo · 0.0%)
ⓘ Screening estimate from a state-policy table — verify with the county assessor before closing.
Climate risk First Street
- Flood 1/10 Low FEMA zone X (unshaded) · 0% chance over 30 yrs
- Wildfire 1/10 Low
- Heat 3/10 Moderate 7 d/yr ≥98°F today · 17 d/yr by 30 yrs out
- Wind 2/10 Low
- Air quality 2/10 Low 1 unhealthy d/yr today · 2 by 30 yrs out
Nearby sold comps map
Loading sold comps map…
Walkable amenities ~0.75 mi
Loading nearby amenities…
Taxation est. · year 1
- Rental income
- $14,865
- − Mortgage interest
- −$8,402
- − Property taxes
- −$2,908
- − Insurance
- −$750
- − Repairs & maintenance
- −$1,189
- − Management
- −$1,189
- − Depreciation
- −$4,364
- Taxable loss
- −$3,937
- Est. tax savings @ 24.0%
- +$945
- After-tax cash flow
- $-409/yr
For passive investors: Depreciation is non-cash, so a rental often shows a tax loss while cash-flowing — sheltering income. Rental losses are passive: they offset passive income freely, and up to $25,000/yr can offset ordinary (W-2) income if you actively participate and your MAGI is under $100k (phasing out to $0 by $150k); unused losses carry forward. On sale, claimed depreciation is recaptured at up to 25%, and gains may owe capital-gains tax (a 1031 exchange can defer both). Figures are a year-1 estimate at your 24.0% rate — not tax advice; consult a CPA.
Schools (NCES district)
- District
- Benton Carroll Salem Local
- NCES district ID
- 3904892
- Math proficiency
- 79% ▼ -6.00%
- Reading proficiency
- 76% ▼ -2.00%
- Median HH income
- $55,133
- Composite
- 66.1/100
- National rank
- #438
- State rank
- #74 of 656 in OH
Livability — Oak Harbor
- Score
- 76/100
- State rank
- #211
- US rank
- #3308
Category grades
Schools grade is shown separately in the Schools card above.
Census & demographics
- County
- Ottawa · 37,113 people
- Metro
- Sandusky, OH
- Population (ZIP)
- 8,053
- Household income
- $71,496
- Rent vs Own
- Severe rent burden
- 11.2
Population outlook (Ottawa County) Hauer SSP2
- Today (2025)
- 39,548 people
- By 2030
- 38,297 · -3.2%
- By 2040
- 35,070 · -11.3%
- By 2050
- 31,956 · -19.2%
- By 2075
- 27,454 · -30.6%
- By 2100
- 23,596 · -40.3%
Race, ethnicity, and origin ACS 2023
- Neighborhood character
- Predominantly White (93%)
- Race & ethnicity
- White 93% Hispanic / Latino 5% Two or more races 2%
- Common ancestry
- Romanian 3% Lithuanian 3% Italian 3%
- Foreign-born
- 1% · Canada
- Languages at home
- 99% English-only · Spanish 1%
Political lean MEDSL · Ottawa
- 2024 margin
- Strong R (+25.1) · D 37.0% · R 62.1%
- 2008→2024 swing
- -31.3pp toward R · 2008: 6.3pp · 2024: -25.1pp
- All cycles
- 2024: R+25.1 2020: R+23.4 2016: R+19.6 2012: D+4.1 2008: D+6.3
Not yet ingested
- Civics
- —
Market trends
- HPI YoY
- ▼ -79.76%
- Current HPI
- 192.8443
- Rent YoY
- —
- Metro
- —
- State GDP YoY
- ▲ 1.98%
- F500 in state
- 48
Industry mix (Fortune 500 HQ in OH)
| Industry | F500 HQs | Revenue |
|---|---|---|
| Insurance | 3 | $145B |
|
||
| Industrial Machinery | 3 | $49B |
|
||
| Financial Services | 3 | $24B |
|
||
| Consumer Goods | 2 | $93B |
|
||
| Aerospace / Defense | 2 | $47B |
|
||
| Utilities | 2 | $33B |
|
||
Price history
+0.0% since first listed2 events — show timeline
- 2026-05-18 Listed $150,000 NORIS
- 2026-05-06 Coming Soon $150,000 NORIS
Property tax history
+3.7%/yrLatest (2025): $2,908 · -1.3% YoY. Source: county tax records.
Cash-flow waterfall
monthlySold comps — $/sqft
last 12 mo · ≤1 miLoading sold comps…