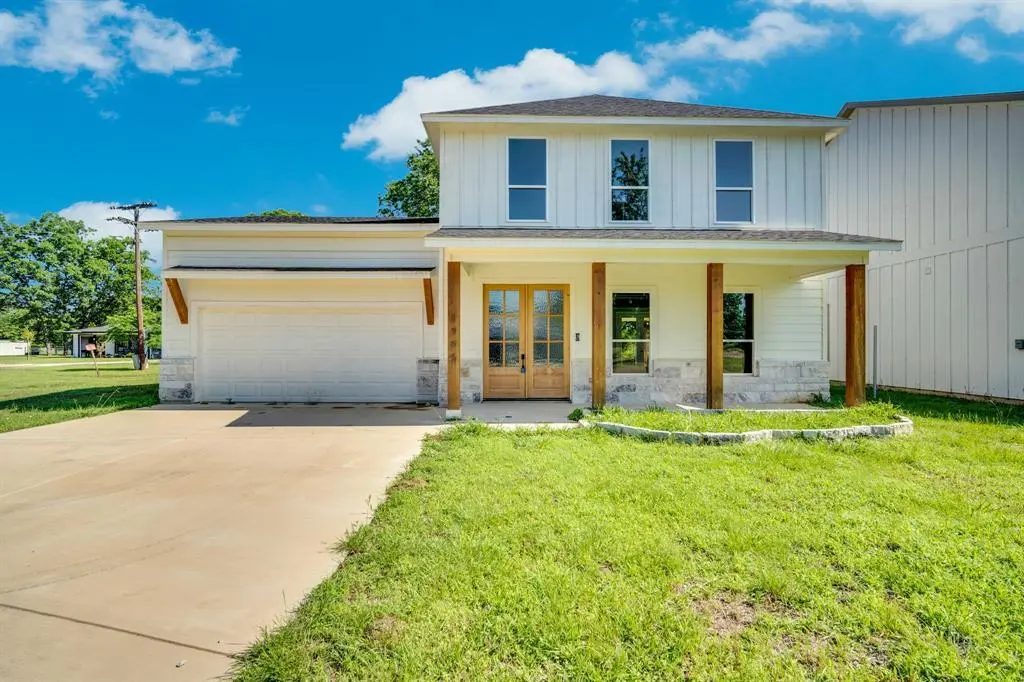
1995 Lakeview Dr · Tool, TX
Flood risk No data
- FEMA flood zone
- —
- Chance of flooding over 30 yrs
- —
- Est. flood insurance / yr
- —
Fire risk No data
- Est. fire insurance / yr
- —
Heat risk No data
- Hot days now (above threshold)
- —
- Hot days in 30 yrs
- —
Wind risk No data
- Chance of severe wind over 30 yrs
- —
Air-quality risk No data
- Unhealthy air days now
- —
- Unhealthy air days in 30 yrs
- —
Risk factors via First Street. Map © Google.
Why this score? — see what drove the B grade
The composite is a weighted blend of 9 inputs, each scored 0–100. Each bar is that input's sub-score; the figure is the points it added to the 100-point composite (weight × sub-score).
- Cash flow +30.0/30.0
- 1% rule +10.0/10.0
- DSCR +10.0/10.0
- ARV discount +7.5/15.0
- Condition / age +4.8/5.0
- Schools +4.3/10.0
- Livability +3.3/5.0
- Rent growth +2.5/5.0
- Appreciation +0.0/10.0
$285,000
🖨 Deal sheet 📄 Offer letter ✓ Due diligence
Listing remarks
Discover brand new construction offering 2,062 sq ft of modern living space, featuring 4 bedrooms and 3.5 bathrooms, including two master suites — one on each level for ultimate flexibility and comfort. Located in the desirable Wildwood Acres community, residents enjoy fantastic amenities such as a private boat ramp and two beautiful parks complete with playgrounds and barbecue areas. Launch your boat just moments from home and spend your days exploring the water or relaxing in the parks. Inside, the home features a thoughtfully designed open floor plan, spacious living areas, and comfortable bedrooms. A two car garage provides ample parking and storage, while large, covered patios in
Key facts
- Two beautiful parks
- Private boat ramp
- Large covered patios
Tags
Property features AI
Finance
- Other: Possession at closing/funding; Property type: Residential — Single Family Residence
- Financial info: Listing status: Active; Special listing condition: Real Estate Owned
- HOA & community: No homeowners association
Exterior
- Parking: Attached 2-car garage; 2 covered parking spaces; Driveway
- Security: Audio and video recording consent for visitors (surveillance devices present)
- Utilities: City water; City sewer; Not in a municipal utility district
- Home design: Single family residence; Two-story home; New construction (2024) — incomplete
- Construction: Composition roof; Built in 2024 (new construction — incomplete)
- Exterior features: Covered porch(es); Lot under 0.5 acre (approximately 0.17 acre); Subdivision: Wildwood Acres Sub
Interior
- Kitchen: Farm sink; Kitchen island; Built-in cabinets; Pantry and walk-in pantry; Eat-in kitchen
- Bedrooms: 4 bedrooms total — primary bedroom on the first floor with walk-in closet; three additional bedrooms on the second floor
- Bathrooms: 3 full bathrooms and 1 half bath; Primary bath with dual sinks, built-in cabinets, and ensuite layout; Additional bathrooms with built-in cabinets
- Heating & cooling: Central heating; Central air; Ceiling fan(s)
- Interior features: Open floorplan; Decorative lighting; Cable TV available; Eat-in kitchen; Kitchen island; Pantry; Built-in cabinets (in some baths and kitchen); Dual sinks in primary bath; Ensuite primary bath
- Laundry & utility: Full-size washer/dryer area; Washer hookup; Electric dryer hookup; Utility room
Neighborhood map
What this means for you Summary
Snapshot
- This is a 4-bed/3.5-bath single-family listed at $285k. Condition is rated excellent.
Deal economics
- At list price, monthly cash flow is $5k ($57k/yr) — positive.
- The deal already cash-flows at list — no discount required.
- Meets the 1% rule at list price ($9k rent vs $285k).
- Recommended offer: $281k (1.5% below list) — sets the bar for market timing.
- Cap rate 26.3% vs local median 2.8% in Tool — top-decile yield for the area; either an underpriced asset or a hidden risk that comps aren't pricing in. Stress-test before assuming the spread holds.
Location & tenants
- Location reads 66/100 on livability (#651 in TX) — a middle-class / working-renter tenant base. Strengths: crime A+, cost of living A+, housing A+; Watch: employment D, amenities F, commute F.
- Malakoff ISD (town): math 48% / reading 54% proficiency, ranked #187 of 826 in TX (top 23%) — acceptable for families but not a draw, mixed tenant base, ~2y average lease; 61% free/reduced lunch — lower-income household profile, screen leases tightly.
- Zoned schools: Malakoff El (math 58% / reading 54%, grade C+, #574 of 4,322 statewide, top 14%, 457 students, 75% FRL).
- Market conditions: 440 active listings in the ZIP; 1 comparable units currently listed for rent nearby; 263 units permitted in Henderson County in 2024 (0 in 5+ unit buildings).
Forward outlook
- Local home prices are declining (-3.0%/yr); year-one equity from $2k of loan paydown is wiped out by about $9k of value loss. Plan a longer hold.
- At projected returns (-3.0% appreciation + 3.0% rent growth), your $80k cash investment doubles in ~2 years — after that, you're playing with house money.
Negotiation context
- It's been on market 20 days — a 2% lower offer ($281k) is reasonable based on typical stale-listing flexibility.
- 5 sale attempts since 2y ago with the ask held roughly flat each time — persistent listings suggest the price (not the market) is what's stuck; bring a comps-based counter.
Questions for the listing agent
- Is there a deadline driving the sale (1031 exchange, divorce, estate, relocation)? That informs how much negotiation room exists.
- What's the average days-on-market for RENTAL listings here right now (not sales)? A rising rental-DOM trend means longer vacancies and softer asking-rent achievability than the comps imply.
- What's the recent tenant-quality profile in this submarket — average credit score on applications, eviction rate, late-payment / NSF rate, and stable-employment percentage? A property-management company in the area should have these aggregated.
- How much new for-sale + rental construction is in the pipeline within 1–3 miles? Heavy new supply typically softens prices + rents 12–24 months out; constrained supply supports both.
Investment metrics
- 1% rule
- 2.99% ✓
- Cap rate
- 26.32%
- Cash-on-cash
- 71.53%
- DSCR
- 4.18
- GRM
- 2.8
CMA / ARV
- ARV (on-the-fly)
- $737,616
- Comps found
- 6
Show comp detail 6 sales within ~0.75 mi
| Address | Dist | Beds/Ba | Sqft | Sold | Price | $/sf | Match |
|---|---|---|---|---|---|---|---|
| 2404 Southport Tack | 0.29mi | 3/3.5 (-1) | 1,900 (-6%) | 3mo | $545,000 | $287 | 68 |
| 2223 Wildwood Way | 0.20mi | 4/2.0 | 1,986 (-2%) | 16mo | $399,900 | $201 | 67 |
| 2213 N Wind Dr | 0.41mi | 4/2.5 | 2,169 (+7%) | 8mo | $1,390,000 | $641 | 60 |
| 2312 Driftwood Dr | 0.50mi | 3/2.0 (-1) | 2,047 (+1%) | 11mo | $574,999 | $281 | 55 |
| 2524 Wildwood Way | 0.27mi | 4/2.0 | 2,200 (+8%) | 15mo | $799,000 | $363 | 55 |
| 2512 Oak Dr | 0.59mi | 5/3.0 (+1) | 2,293 (+13%) | 10mo | $975,000 | $425 | 36 |
Match score weights: distance 35% · size 25% · config 20% · recency 20%. Top-matched comps best support the ARV.
Projected returns pro-forma
-3.0% appreciation · 3.0% rent growth · sell at horizon
- IRR
- 71.2%
- Equity multiple
- 4.22×
- Total profit
- $256,890
- Equity at exit
- $42,494
- IRR
- 75.1%
- Equity multiple
- 8.70×
- Total profit
- $614,305
- Equity at exit
- $24,642
Cash invested: $79,800 (down + closing). Projections, not guarantees.
Landlord ↔ Tenant lean methodology
- Overall (STATE)
- 87 Strongly Landlord-Friendly
- State Texas
- 87 Strongly Landlord-Friendly · R+5
- County
- — inherits STATE
- City
- — inherits STATE
ZIP-level market 75143
- Home prices YoY
- -11.4%
- Active inventory
- 440
- Price-to-rent
- 2.8×
Monthly cashflow live
- Estimated rent
- $8,514 medium interval (Pro) →
- Mortgage (P&I)
- −$1,495
- Tax est. 1.5%
- −$356 /mo · $4,275/yr
- Insurance
- −$119
- HOA
- −$0
- Vacancy / Maint / Mgmt
- −$1,788
- Net cashflow
- $4,756
Break-even live
UW: 25.0% down · 7.5% · 30yr · 1.5% tax · 5.0% vac · 8.0% maint · 8.0% mgmt
Financing live
Cash to close
- Down payment
- $71,250
- Closing costs
- $8,550
- Reserves months
- —
- Total cash needed
- —
Loan-product check · same deal, 3 products live
Conventional
25% down · 7.5% · 30yr
- Down + closing
- —
- Monthly P&I
- —
- Monthly cashflow
- —
- DSCR
- —
- Eligible?
- —
Personal DTI + credit; lowest rate.
DSCR
20% down · 8.5% · 30yr
- Down + closing
- —
- Monthly P&I
- —
- Monthly cashflow
- —
- DSCR
- —
- Eligible?
- —
No personal income docs; deal must DSCR.
Hard money
10% down · 12.0% · 12mo
- Down + closing
- —
- Monthly P&I
- —
- Monthly cashflow
- —
- DSCR
- —
- Eligible?
- —
Short-term bridge; refi at stabilization.
Rent comps 1 comps
| Address | Beds | Baths | Sqft | Rent | $/sqft | DOM | Units | Dist |
|---|---|---|---|---|---|---|---|---|
| 1012 Chestnut Dr Unit 1301590P Tool, TX | 3.0 | 2.0 | 1894 | $8,514 | $4.50 | 43d | 1 | 0.31mi |
Listing history 15 events
-
2026-06-19days on market $285,000 Active 20 DOM
-
2026-06-18price $285,000 Active 19 DOM
-
2026-06-18days on market $299,900 Active 19 DOM
-
2026-06-17days on market $299,900 Active 18 DOM
-
2026-06-16days on market $299,900 Active 17 DOM
-
2026-06-15days on market $299,900 Active 16 DOM
-
2026-06-14days on market $299,900 Active 14 DOM
-
2026-06-12days on market $299,900 Active 13 DOM
-
2026-06-09days on market $299,900 Active 10 DOM
-
2026-06-08days on market $299,900 Active 9 DOM
-
2026-06-07days on market $299,900 Active 8 DOM
-
2026-06-02days on market $299,900 Active 3 DOM
-
2026-06-01days on market $299,900 Active 2 DOM
-
2026-05-30remarks 693-char remark
-
2026-05-30$299,900 Active 1 DOM
ⓘ Source: listings_history table (triggers on properties + properties_extension) + one-shot
backfill from property_details.listing_events for pre-trigger history.
Nearby sold comps map
Loading sold comps map…
Walkable amenities ~0.75 mi
Loading nearby amenities…
Taxation est. · year 1
- Rental income
- $102,168
- − Mortgage interest
- −$15,964
- − Property taxes
- −$4,275
- − Insurance
- −$1,425
- − Repairs & maintenance
- −$8,173
- − Management
- −$8,173
- − Depreciation
- −$8,291
- Taxable income
- $55,866
- Est. tax owed @ 24.0%
- −$13,408
- After-tax cash flow
- $43,670/yr
For passive investors: Depreciation is non-cash, so a rental often shows a tax loss while cash-flowing — sheltering income. Rental losses are passive: they offset passive income freely, and up to $25,000/yr can offset ordinary (W-2) income if you actively participate and your MAGI is under $100k (phasing out to $0 by $150k); unused losses carry forward. On sale, claimed depreciation is recaptured at up to 25%, and gains may owe capital-gains tax (a 1031 exchange can defer both). Figures are a year-1 estimate at your 24.0% rate — not tax advice; consult a CPA.
Condition & rehab AI · 12 photos
This brand new construction home in Wildwood Acres offers modern living space, ample amenities, and a prime location. It is move-in ready with no repairs needed and high potential for value increase through minor updates.
Value-add opportunities
- Both Landscaping and curb appeal improvements — Enhances curb appeal and adds value for both resale and rental.
- Both Add a smart home system — Improves convenience and adds modern amenities for both buyers and renters.
Renovation cost estimate screening
Value-add ROI direction
- Both Landscaping and curb appeal improvements — Enhances curb appeal and adds value for both resale and rental. ↑
- Both Add a smart home system — Improves convenience and adds modern amenities for both buyers and renters. ↑
ⓘ Cost ranges are severity-bucket heuristics (US national rule-of-thumb). Get contractor quotes + a written scope before underwriting a rehab budget.
Schools (NCES district)
- District
- Malakoff ISD
- NCES district ID
- 4828780
- Math proficiency
- 48% ▼ -14.00%
- Reading proficiency
- 54% ▼ -5.00%
- Median HH income
- $38,970
- Composite
- 42.54/100
- National rank
- #3200
- State rank
- #187 of 826 in TX
Livability — Tool
- Score
- 66/100
- State rank
- #651
- US rank
- #12292
Category grades
Schools grade is shown separately in the Schools card above.
Census & demographics
- Population (ZIP)
- 14,676
Population outlook (Henderson County) Hauer SSP2
- Today (2025)
- 80,471 people
- By 2030
- 80,608 · +0.2%
- By 2040
- 80,087 · -0.5%
- By 2050
- 78,208 · -2.8%
- By 2075
- 72,423 · -10.0%
- By 2100
- 61,012 · -24.2%
Race, ethnicity, and origin ACS 2023
- Neighborhood character
- Predominantly White (80%)
- Race & ethnicity
- White 80% Hispanic / Latino 13% Two or more races 8% Black 2%
- Hispanic origin (detail)
- Mexican 13%
- Common ancestry
- Italian 2% Iranian 2% Lithuanian 1%
- Foreign-born
- 4% · Canada, China
- Languages at home
- 90% English-only · Spanish 9%
Political lean MEDSL · Henderson
- 2024 margin
- Solid R (+63.5) · D 18.0% · R 81.4%
- 2008→2024 swing
- -18.8pp toward R · 2008: -44.6pp · 2024: -63.5pp
- All cycles
- 2024: R+63.5 2020: R+60.2 2016: R+60.0 2012: R+54.8 2008: R+44.6
Not yet ingested
- Civics
- —
Market trends
- HPI YoY
- ▼ -42.99%
- Current HPI
- 332.57
- Rent YoY
- —
- Metro
- —
- State GDP YoY
- ▲ 3.95%
- F500 in state
- 110
Industry mix (Fortune 500 HQ in TX)
| Industry | F500 HQs | Revenue |
|---|---|---|
| Energy | 16 | $1,198B |
|
||
| Technology | 5 | $198B |
|
||
| Engineering / Construction | 4 | $72B |
|
||
| Energy Services | 3 | $60B |
|
||
| Utilities | 3 | $41B |
|
||
| Healthcare | 2 | $330B |
|
||
Price history
-14.3% since first listed7 events — show timeline
- 2026-05-22 Listed $299,900 NTREIS
- 2025-03-15 Listing Removed — NTREIS
- 2024-09-26 Relisted — NTREIS
- 2024-09-05 Listing Removed — NTREIS
- 2024-08-06 Listed $349,999 HCBOR
- 2024-08-06 Listed $349,999 HCBOR
- 2024-08-05 Listed $349,999 NTREIS
Cash-flow waterfall
monthlySold comps — $/sqft
last 12 mo · ≤1 miLoading sold comps…