 🏗️ New Construction
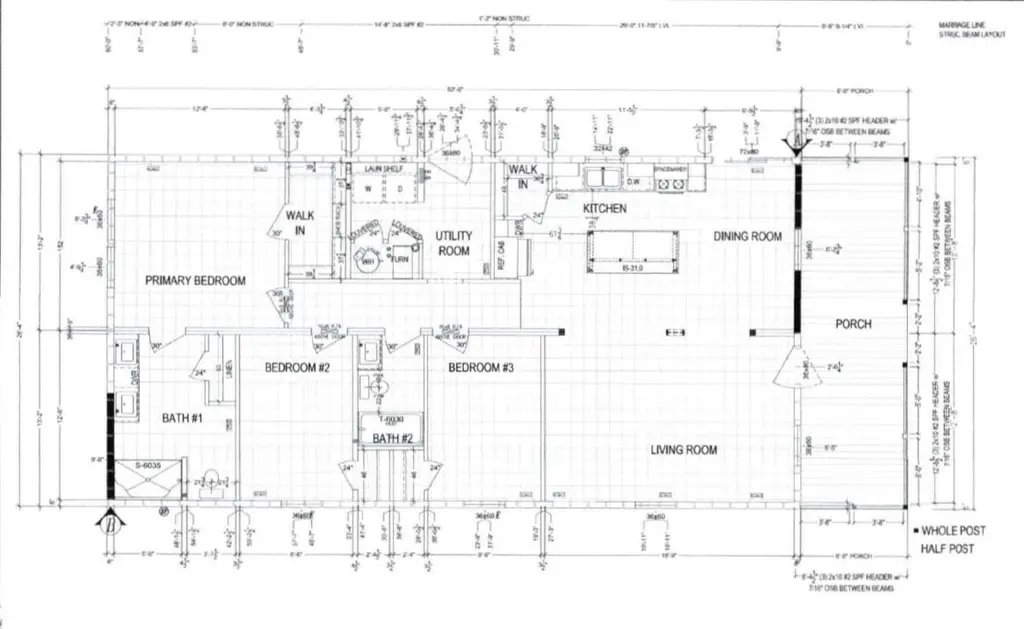
Clayton Parke Place Plan · Elkhart, IN
Flood risk No data
- FEMA flood zone
- —
- Chance of flooding over 30 yrs
- —
- Est. flood insurance / yr
- —
Fire risk No data
- Est. fire insurance / yr
- —
Heat risk No data
- Hot days now (above threshold)
- —
- Hot days in 30 yrs
- —
Wind risk No data
- Chance of severe wind over 30 yrs
- —
Air-quality risk No data
- Unhealthy air days now
- —
- Unhealthy air days in 30 yrs
- —
Risk factors via First Street. Map © Google.
Why this score? — see what drove the D+ grade
The composite is a weighted blend of 9 inputs, each scored 0–100. Each bar is that input's sub-score; the figure is the points it added to the 100-point composite (weight × sub-score).
- Cash flow +17.6/30.0
- ARV discount +7.5/15.0
- DSCR +5.5/10.0
- 1% rule +4.7/10.0
- Rent growth +4.3/5.0
- Livability +3.4/5.0
- Schools +1.8/10.0
- Condition / age +1.0/5.0
- Appreciation +0.0/10.0
$153,250
🖨 Deal sheet 📄 Offer letter ✓ Due diligence
Listing remarks MLS
Check out this stunning new Clayton Home, featuring the solid feel of full drywall and the charm of a massive wrap-around porch!
Key facts
- Full drywall
- Wrap-around porch
- Listed 119 days
Tags
Neighborhood map
What this means for you Summary
Snapshot
- This is a 3-bed/2.0-bath manufactured listed at $153k. Condition is rated poor.
Deal economics
- At list price, monthly cash flow is $115 ($1k/yr) — positive.
- The deal already cash-flows at list — no discount required.
- To meet the 1% rule (rent ≥ 1% of price), the offer needs to be $141k (7.9% below list).
- Recommended offer: $139k (9.0% below list) — sets the bar for market timing.
- Cap rate 7.2% vs local median 4.0% in Elkhart — top-decile yield for the area; either an underpriced asset or a hidden risk that comps aren't pricing in. Stress-test before assuming the spread holds.
Location & tenants
- Location reads 68/100 on livability (#224 in IN) — a middle-class / working-renter tenant base. Strengths: cost of living A+, housing A+, health & safety A+; Watch: amenities C-, schools F, crime F.
- Elkhart Community Schools (urban): math 18% / reading 25% proficiency, ranked #271 of 301 in IN (top 90%) — low school quality limits family demand, transient renter base, plan for 1-2y turnover.
- Market conditions: Rents rising fast (+7.0%/yr); 269 active listings in the ZIP; 5 comparable units currently listed for rent nearby; rentals at typical pace (median 21d on market — plan ~3-4 weeks tenant-placement turnaround); 40% of comp listings sitting > 30 days — soft ceiling on asking rent; 484 units permitted in Elkhart County in 2024 (136 in 5+ unit buildings).
Forward outlook
- Local home prices are declining (-3.0%/yr); year-one equity from $1k of loan paydown is wiped out by about $4k of value loss. Plan a longer hold.
- Elkhart County population projected at +7% by 2050 — modest demand growth; plan on rents tracking national, not racing it.
Negotiation context
- It's been on market 120 days — a 9% lower offer ($139k) is reasonable based on typical stale-listing flexibility.
Questions for the listing agent
- It's been on market 120 days. Have you received any prior offers? Is the seller open to a 9% concession, seller financing, or rate buy-down credit?
- Have any recent inspections been done? Can we get a copy of the seller's disclosures and any deferred-maintenance estimates?
- Why hasn't it sold? Are there any deal-killer items the seller is aware of (foundation, flood, title, zoning, code violations)?
- Is there a deadline driving the sale (1031 exchange, divorce, estate, relocation)? That informs how much negotiation room exists.
- Schools are F-rated, which usually means shorter tenancies and higher turnover. Who's the typical renter profile here, and what's been the actual vacancy rate?
- Crime grade is F in this area — have there been break-ins, vandalism, or insurance claims at this property in the last 3 years? What carrier currently insures it and at what premium?
- The area grade is low — what's the realistic commute time and amenity access for the typical tenant pool here? Any planned neighborhood developments (good or bad) we should know about?
- What's the average days-on-market for RENTAL listings here right now (not sales)? A rising rental-DOM trend means longer vacancies and softer asking-rent achievability than the comps imply.
- What's the recent tenant-quality profile in this submarket — average credit score on applications, eviction rate, late-payment / NSF rate, and stable-employment percentage? A property-management company in the area should have these aggregated.
- How much new for-sale + rental construction is in the pipeline within 1–3 miles? Heavy new supply typically softens prices + rents 12–24 months out; constrained supply supports both.
Investment metrics
- 1% rule
- 0.97% ✗
- Cap rate
- 7.24%
- Cash-on-cash
- 3.39%
- DSCR
- 1.15
- GRM
- 8.5
CMA / ARV
- ARV (median comp)
- $144,732
- List price
- $153,250
- Delta
- 5.89%
- Verdict
- FAIR
- Comps
- 4 within 1.0 mi
Show comp detail 2 sales within ~0.75 mi
| Address | Dist | Beds/Ba | Sqft | Sold | Price | $/sf | Match |
|---|---|---|---|---|---|---|---|
| 1909 Grover St | 0.52mi | 3/2.0 | 1,349 (-2%) | 10mo | $137,000 | $102 | 65 |
| 25025 Dunny St | 0.46mi | 3/2.0 | 1,568 (+14%) | 7mo | $192,500 | $123 | 48 |
Match score weights: distance 35% · size 25% · config 20% · recency 20%. Top-matched comps best support the ARV.
Projected returns pro-forma
-3.0% appreciation · 7.03% rent growth · sell at horizon
- IRR
- -6.5%
- Equity multiple
- 0.75×
- Total profit
- $-10,185
- Equity at exit
- $21,580
- IRR
- 7.5%
- Equity multiple
- 1.67×
- Total profit
- $27,156
- Equity at exit
- $12,514
Cash invested: $40,525 (down + closing). Projections, not guarantees.
Landlord ↔ Tenant lean methodology
- Overall (STATE)
- 90 Strongly Landlord-Friendly
- State Indiana
- 90 Strongly Landlord-Friendly · R+11
- County
- — inherits STATE
- City
- — inherits STATE
ZIP-level market 46514
- Rents YoY
- 7.0%
- Active inventory
- 269
- Price-to-rent
- 9.1×
Monthly cashflow live
- Estimated rent
- $1,411 high interval (Pro) →
- Mortgage (P&I)
- −$759
- Tax est. 1.5%
- −$181 /mo · $2,171/yr
- Insurance
- −$60
- HOA
- −$0
- Vacancy / Maint / Mgmt
- −$296
- Net cashflow
- $115
Break-even live
UW: 25.0% down · 7.5% · 30yr · 1.5% tax · 5.0% vac · 8.0% maint · 8.0% mgmt
Financing live
Cash to close
- Down payment
- $36,183
- Closing costs
- $4,342
- Reserves months
- —
- Total cash needed
- —
Loan-product check · same deal, 3 products live
Conventional
25% down · 7.5% · 30yr
- Down + closing
- —
- Monthly P&I
- —
- Monthly cashflow
- —
- DSCR
- —
- Eligible?
- —
Personal DTI + credit; lowest rate.
DSCR
20% down · 8.5% · 30yr
- Down + closing
- —
- Monthly P&I
- —
- Monthly cashflow
- —
- DSCR
- —
- Eligible?
- —
No personal income docs; deal must DSCR.
Hard money
10% down · 12.0% · 12mo
- Down + closing
- —
- Monthly P&I
- —
- Monthly cashflow
- —
- DSCR
- —
- Eligible?
- —
Short-term bridge; refi at stabilization.
Rent comps 5 comps
| Address | Beds | Baths | Sqft | Rent | $/sqft | DOM | Units | Dist |
|---|---|---|---|---|---|---|---|---|
| 1875 Osolo Rd Elkhart, IN | 1.0–3.0 | 1.0–2.0 | 948 | $1,000 | $1.05 | 21d | 1 | 0.29mi |
| 2002 Raintree Dr Elkhart, IN | 2.0 | 1.5 | 1034 | $1,479 | $1.43 | 21d | 2 | 0.62mi |
| 2304 Grant St Elkhart, IN | 4.0 | 2.0 | 1450 | $1,800 | $1.24 | 43d | 1 | 1.02mi |
| 1120 Worthmore Ave Elkhart, IN | 2.0 | 1.0 | 987 | $1,700 | $1.72 | 21d | 1 | 1.26mi |
| 1301 Cone St Elkhart, IN | 2.0 | 1.0 | 888 | $1,100 | $1.24 | 43d | 1 | 1.35mi |
Listing history 17 events
-
2026-06-19days on market $153,250 Active 120 DOM
-
2026-06-18days on market $153,250 Active 119 DOM
-
2026-06-17days on market $153,250 Active 118 DOM
-
2026-06-16days on market $153,250 Active 117 DOM
-
2026-06-15days on market $153,250 Active 116 DOM
-
2026-06-14days on market $153,250 Active 114 DOM
-
2026-06-13pricedays on market $153,250 Active 113 DOM
-
2026-06-09pricedays on market $135,000 Active 1 DOM
-
2026-06-08days on market $153,250 Active 109 DOM
-
2026-06-07days on market $153,250 Active 108 DOM
-
2026-06-05days on market $153,250 Active 105 DOM
-
2026-06-03days on market $153,250 Active 104 DOM
-
2026-06-02days on market $153,250 Active 103 DOM
-
2026-06-01days on market $153,250 Active 102 DOM
-
2026-05-31days on market $153,250 Active 101 DOM
-
2026-05-30days on market $153,250 Active 100 DOM
-
2026-02-19$153,250 Active 128-char remark
Show marketing remark (128 chars)
Check out this stunning new Clayton Home, featuring the solid feel of full drywall and the charm of a massive wrap-around porch!
ⓘ Source: listings_history table (triggers on properties + properties_extension) + one-shot
backfill from property_details.listing_events for pre-trigger history.
Nearby sold comps map
Loading sold comps map…
Walkable amenities ~0.75 mi
Loading nearby amenities…
Taxation est. · year 1
- Rental income
- $16,932
- − Mortgage interest
- −$8,107
- − Property taxes
- −$2,171
- − Insurance
- −$724
- − Repairs & maintenance
- −$1,355
- − Management
- −$1,355
- − Depreciation
- −$4,210
- Taxable loss
- −$989
- Est. tax savings @ 24.0%
- +$237
- After-tax cash flow
- $1,611/yr
For passive investors: Depreciation is non-cash, so a rental often shows a tax loss while cash-flowing — sheltering income. Rental losses are passive: they offset passive income freely, and up to $25,000/yr can offset ordinary (W-2) income if you actively participate and your MAGI is under $100k (phasing out to $0 by $150k); unused losses carry forward. On sale, claimed depreciation is recaptured at up to 25%, and gains may owe capital-gains tax (a 1031 exchange can defer both). Figures are a year-1 estimate at your 24.0% rate — not tax advice; consult a CPA.
Condition & rehab AI · 2 photos
This manufactured home requires extensive repairs and updates to its roof, exterior, flooring, interior walls/paint, HVAC system, and landscaping. Significant investment is needed to bring it up to a livable condition.
Repairs flagged
- Major roof — No visible roof in the satellite image.
- Major exterior — No visible exterior in the satellite image.
- Major flooring — No visible flooring in the satellite image.
- Major interior walls/paint — No visible interior walls/paint in the satellite image.
- Major HVAC/mechanicals — No visible HVAC/mechanicals in the satellite image.
- Major landscaping/curb appeal — No visible landscaping/curb appeal in the satellite image.
Value-add opportunities
- Both roof replacement — A new roof would significantly improve the home's appearance and value.
- Both exterior painting — A fresh coat of paint would enhance curb appeal and value.
- Both flooring replacement — New flooring would improve the home's condition and value.
- Both interior painting — Fresh paint would improve the home's condition and value.
- Both HVAC system upgrade — A new HVAC system would improve comfort and energy efficiency, enhancing value.
- Both landscaping and curb appeal — A well-maintained landscape would enhance curb appeal and value.
Renovation cost estimate screening
| Repair item | Severity | Est. cost |
|---|---|---|
| roof · No visible roof in the satellite image. | Major | $15,000–50,000 |
| exterior · No visible exterior in the satellite image. | Major | $15,000–50,000 |
| flooring · No visible flooring in the satellite image. | Major | $15,000–50,000 |
| interior walls/paint · No visible interior walls/paint in the satellite image. | Major | $15,000–50,000 |
| HVAC/mechanicals · No visible HVAC/mechanicals in the satellite image. | Major | $15,000–50,000 |
| landscaping/curb appeal · No visible landscaping/curb appeal in the satellite image. | Major | $15,000–50,000 |
| Total estimated repair cost · 6 items | $90,000–300,000 |
Value-add ROI direction
- Both roof replacement — A new roof would significantly improve the home's appearance and value. ↑
- Both exterior painting — A fresh coat of paint would enhance curb appeal and value. ↑
- Both flooring replacement — New flooring would improve the home's condition and value. ↑
- Both interior painting — Fresh paint would improve the home's condition and value. ↑
- Both HVAC system upgrade — A new HVAC system would improve comfort and energy efficiency, enhancing value. ↑
- Both landscaping and curb appeal — A well-maintained landscape would enhance curb appeal and value. ↑
ⓘ Cost ranges are severity-bucket heuristics (US national rule-of-thumb). Get contractor quotes + a written scope before underwriting a rehab budget.
Schools (NCES district)
- District
- Elkhart Community Schools
- NCES district ID
- 1803270
- Math proficiency
- 18% ▼ -12.00%
- Reading proficiency
- 25% ▼ -9.00%
- Median HH income
- $42,881
- Composite
- 18.45/100
- National rank
- #8928
- State rank
- #271 of 301 in IN
Livability — Elkhart
- Score
- 68/100
- State rank
- #224
- US rank
- #9852
Category grades
Schools grade is shown separately in the Schools card above.
Census & demographics
- Census place
- Elkhart, IN
- County
- Elkhart County · 107,928 people
- City population
- 74,260
- Metro
- Elkhart-Goshen, IN
- Population (ZIP)
- 42,389
- Household income
- $65,833
- Rent vs Own
- Severe rent burden
- 1061.0
Population outlook (Elkhart County) Hauer SSP2
- Today (2025)
- 213,761 people
- By 2030
- 218,103 · +2.0%
- By 2040
- 225,381 · +5.4%
- By 2050
- 229,447 · +7.3%
- By 2075
- 232,856 · +8.9%
- By 2100
- 214,088 · +0.2%
Race, ethnicity, and origin ACS 2023
- Neighborhood character
- Predominantly White (74%)
- Race & ethnicity
- White 74% Hispanic / Latino 14% Two or more races 6% Black 5% Asian 1%
- Hispanic origin (detail)
- Mexican 10%
- Common ancestry
- Lithuanian 2% Romanian 2% Italian 2%
- Foreign-born
- 8% · Canada
- Languages at home
- 89% English-only · Spanish 10%
Political lean MEDSL · Elkhart
- 2024 margin
- Solid R (+32.4) · D 33.1% · R 65.5% · Other 1.4%
- 2008→2024 swing
- -21.2pp toward R · 2008: -11.2pp · 2024: -32.4pp
- All cycles
- 2024: R+32.4 2020: R+28.1 2016: R+32.4 2012: R+26.5 2008: R+11.2
Not yet ingested
- Civics
- —
Market trends
- HPI YoY
- ▼ -246.78%
- Current HPI
- 225.6
- Rent YoY
- ▲ 7.03%
- Metro
- Elkhart-Goshen, IN
- State GDP YoY
- ▲ 2.90%
- F500 in state
- 18
Industry mix (Fortune 500 HQ in IN)
| Industry | F500 HQs | Revenue |
|---|---|---|
| Industrial Machinery | 2 | $37B |
|
||
| Healthcare | 1 | $177B |
|
||
| Pharmaceuticals | 1 | $45B |
|
||
| Metals / Steel | 1 | $18B |
|
||
| Agriculture | 1 | $17B |
|
||
| Packaging | 1 | $12B |
|
||
Price history
1 event — show timeline
- 2026-02-19 Listed $153,250 Zillow
Cash-flow waterfall
monthlySold comps — $/sqft
last 12 mo · ≤1 miLoading sold comps…