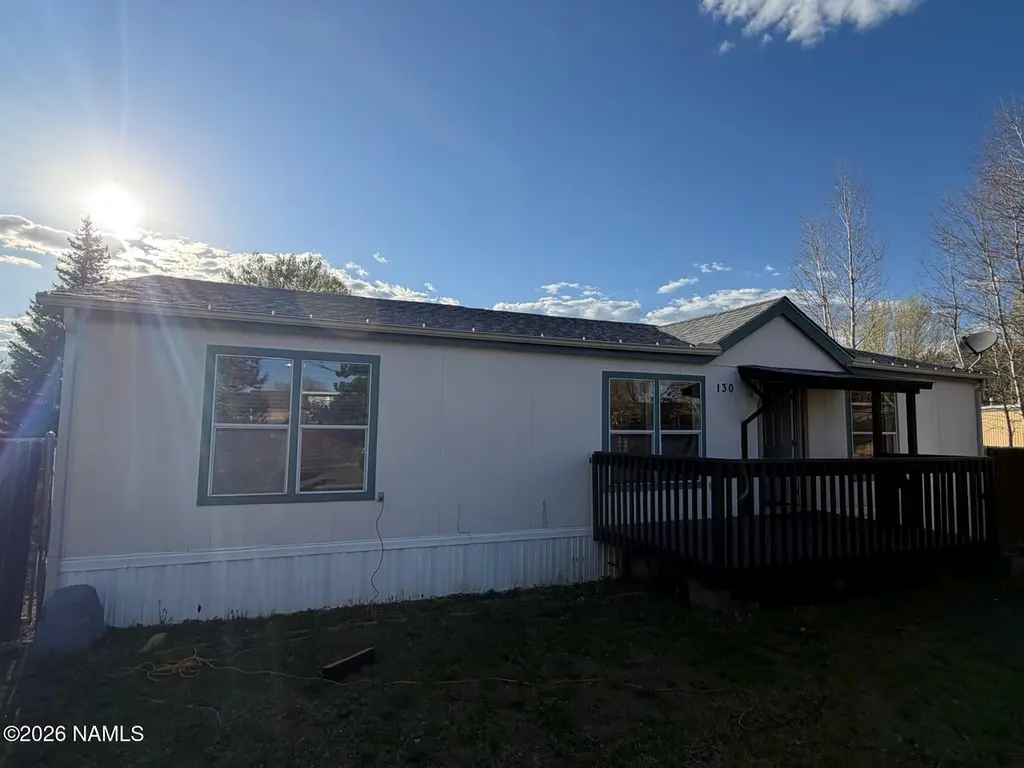
1450 W Kaibab Ln #130 · Flagstaff, AZ
Flood risk 9/10 · Severe
- FEMA flood zone
- X (unshaded)
- Chance of flooding over 30 yrs
- 0.99%
- Est. flood insurance / yr
- $507 – $1,088
Fire risk 8/10 · Major
- Est. fire insurance / yr
- $610 – $1,132
Heat risk 2/10 · Minimal
- Hot days now (above 86°F)
- 7 days/yr
- Hot days in 30 yrs
- 19 days/yr
Wind risk 1/10 · Minimal
- Chance of severe wind over 30 yrs
- —
Air-quality risk 1/10 · Minimal
- Unhealthy air days now
- 0 days/yr
- Unhealthy air days in 30 yrs
- 0 days/yr
Risk factors via First Street. Map © Google.
Why this score? — see what drove the B- grade
The composite is a weighted blend of 9 inputs, each scored 0–100. Each bar is that input's sub-score; the figure is the points it added to the 100-point composite (weight × sub-score).
- Cash flow +30.0/30.0
- 1% rule +10.0/10.0
- DSCR +10.0/10.0
- ARV discount +7.5/15.0
- Condition / age +4.0/5.0
- Livability +3.1/5.0
- Rent growth +2.6/5.0
- Schools +2.1/10.0
- Appreciation +0.0/10.0
$165,000
🖨 Deal sheet 📄 Offer letter ✓ Due diligence
Listing remarks
Beautiful Property with lots of potential sellers are also willing to a seller carry back with a good down payment.
Key facts
- 2.06 acre lot
- Built 2000
- Listed 38 days
Property features AI
Finance
- Other: Building area about 1,325 (reported)
- Financial info: Land lease: Yes
Exterior
- Home design: Double wide manufactured home; Located at 1450 W Kaibab Ln #130, Flagstaff, AZ
- Construction: Year built (owner reported)
- Exterior features: Level lot
Interior
- Flooring: Vinyl
- Bathrooms: 2 total bathrooms
- Heating & cooling: Floor furnace heating
- Interior features: Vinyl flooring; Laundry located in hall
- Laundry & utility: Hall laundry
Neighborhood map
What this means for you Summary
Snapshot
- This is a 3-bed/2.0-bath manufactured listed at $165k. Condition is rated good.
Deal economics
- At list price, monthly cash flow is $834 ($10k/yr) — positive.
- The deal already cash-flows at list — no discount required.
- Meets the 1% rule at list price ($3k rent vs $165k).
- Recommended offer: $160k (3.0% below list) — sets the bar for market timing.
- Cap rate 12.8% vs local median 2.1% in Flagstaff — top-decile yield for the area; either an underpriced asset or a hidden risk that comps aren't pricing in. Stress-test before assuming the spread holds.
Location & tenants
- Location reads 61/100 on livability (#167 in AZ) — a middle-class / working-renter tenant base. Strengths: housing B; Watch: schools C-, employment C-, crime D-.
- Flagstaff Unified District (4192) (urban): math 18% / reading 29% proficiency, ranked #158 of 249 in AZ (top 64%) — low school quality limits family demand, transient renter base, plan for 1-2y turnover.
- Market conditions: Rents flat; 280 active listings in the ZIP; 15 comparable units currently listed for rent nearby; rentals lingering (median 44d on market — plan ~5-8 weeks vacancy on turnover, expect pricing pressure); 100% of comp listings sitting > 30 days — soft ceiling on asking rent; 698 units permitted in Coconino County in 2024 (354 in 5+ unit buildings).
- At $2,584/mo this rent would consume 48% of the median local household income ($65k/yr) (locally 3117% of renters already pay >50% of income on rent) — very limited rent-growth headroom before tenants either downsize or default.
Forward outlook
- Local home prices are declining (-3.0%/yr); year-one equity from $1k of loan paydown is wiped out by about $5k of value loss. Plan a longer hold.
- Coconino County population projected at +20% by 2050 — long-run rental-demand tailwind backs the buy-and-hold thesis.
- At projected returns (-3.0% appreciation + 0.6% rent growth), your $46k cash investment doubles in ~7 years — after that, you're playing with house money.
Negotiation context
- It's been on market 39 days — a 3% lower offer ($160k) is reasonable based on typical stale-listing flexibility.
Risks & watch-outs
- Watch-outs: flood insurance adds $66/mo.
- Climate carrying-cost: severe flood risk; severe wildfire risk — expect insurance premiums to compound above CPI over the hold.
Questions for the listing agent
- It's been on market 39 days. Have you received any prior offers? Is the seller open to a 3% concession, seller financing, or rate buy-down credit?
- What's the actual annual flood-insurance premium (NFIP or private), and is the property in a SFHA with mandatory coverage?
- Is there a deadline driving the sale (1031 exchange, divorce, estate, relocation)? That informs how much negotiation room exists.
- Crime grade is D in this area — have there been break-ins, vandalism, or insurance claims at this property in the last 3 years? What carrier currently insures it and at what premium?
- What's the average days-on-market for RENTAL listings here right now (not sales)? A rising rental-DOM trend means longer vacancies and softer asking-rent achievability than the comps imply.
- What's the recent tenant-quality profile in this submarket — average credit score on applications, eviction rate, late-payment / NSF rate, and stable-employment percentage? A property-management company in the area should have these aggregated.
- How much new for-sale + rental construction is in the pipeline within 1–3 miles? Heavy new supply typically softens prices + rents 12–24 months out; constrained supply supports both.
Investment metrics
- 1% rule
- 1.57% ✓
- Cap rate
- 12.84%
- Cash-on-cash
- 23.40%
- DSCR
- 2.04
- GRM
- 5.3
CMA / ARV
- ARV (median comp)
- $418,881
- List price
- $165,000
- Delta
- -60.61%
- Verdict
- UNDERPRICED
- Comps
- 20 within 1.0 mi
Show comp detail 12 sales within ~0.75 mi
| Address | Dist | Beds/Ba | Sqft | Sold | Price | $/sf | Match |
|---|---|---|---|---|---|---|---|
| 1450 W Kaibab Ln #72 | 0.12mi | 3/2.0 | 1,350 (+2%) | 2mo | $124,000 | $92 | 90 |
| 1675 W Sherrie Dr | 0.19mi | 3/2.0 | 1,296 (-2%) | 1mo | $410,000 | $316 | 87 |
| 2184 W Reading Ct | 0.55mi | 3/2.0 | 1,326 (+0%) | 2mo | $415,000 | $313 | 72 |
| 1450 W Kaibab Ln #70 | 0.01mi | 3/2.0 | 1,152 (-13%) | 9mo | $117,000 | $102 | 70 |
| 2401 W Adirondack Ave | 0.69mi | 3/2.0 | 1,344 (+1%) | 4mo | $460,000 | $342 | 62 |
| 2300 W Rio Grande Ct | 0.61mi | 3/2.0 | 1,380 (+4%) | 5mo | $457,500 | $332 | 60 |
| 1851 W Mattingly Loop | 0.32mi | 3/2.0 | 1,512 (+14%) | 7mo | $445,000 | $294 | 56 |
| 2262 W Atlantic Ct | 0.58mi | 3/2.0 | 1,414 (+7%) | 9mo | $460,000 | $325 | 54 |
| 2412 W Rio Grande Ct | 0.68mi | 3/2.0 | 1,188 (-10%) | 7mo | $399,000 | $336 | 45 |
| 2180 W Alaska Ave | 0.53mi | 3/2.0 | 1,512 (+14%) | 9mo | $450,000 | $298 | 44 |
| 2375 W Zepher Ave | 0.66mi | 2/2.0 (-1) | 1,232 (-7%) | 11mo | $439,000 | $356 | 44 |
| 2348 W Rio Grande Ct | 0.64mi | 3/2.0 | 1,512 (+14%) | 4mo | $451,000 | $298 | 44 |
Match score weights: distance 35% · size 25% · config 20% · recency 20%. Top-matched comps best support the ARV.
Projected returns pro-forma
-3.0% appreciation · 0.55% rent growth · sell at horizon
- IRR
- 11.4%
- Equity multiple
- 1.44×
- Total profit
- $20,260
- Equity at exit
- $24,602
- IRR
- 18.3%
- Equity multiple
- 2.34×
- Total profit
- $62,097
- Equity at exit
- $14,266
Cash invested: $46,200 (down + closing). Projections, not guarantees.
Landlord ↔ Tenant lean methodology
- Overall (STATE)
- 87 Strongly Landlord-Friendly
- State Arizona
- 87 Strongly Landlord-Friendly · R+3
- County
- — inherits STATE
- City
- — inherits STATE
ZIP-level market 86001
- Rents YoY
- 0.6%
- Active inventory
- 280
- Price-to-rent
- 5.3×
Monthly cashflow live
- Estimated rent
- $2,584 high interval (Pro) →
- Mortgage (P&I)
- −$865
- Tax est. 1.5%
- −$206 /mo · $2,475/yr
- Insurance
- −$69
- Flood insurance flood zone
- −$66 /mo · $798/yr
- HOA
- −$0
- Vacancy / Maint / Mgmt
- −$543
- Net cashflow
- $834
Break-even live
UW: 25.0% down · 7.5% · 30yr · 1.5% tax · 5.0% vac · 8.0% maint · 8.0% mgmt
Financing live
Cash to close
- Down payment
- $41,250
- Closing costs
- $4,950
- Reserves months
- —
- Total cash needed
- —
Loan-product check · same deal, 3 products live
Conventional
25% down · 7.5% · 30yr
- Down + closing
- —
- Monthly P&I
- —
- Monthly cashflow
- —
- DSCR
- —
- Eligible?
- —
Personal DTI + credit; lowest rate.
DSCR
20% down · 8.5% · 30yr
- Down + closing
- —
- Monthly P&I
- —
- Monthly cashflow
- —
- DSCR
- —
- Eligible?
- —
No personal income docs; deal must DSCR.
Hard money
10% down · 12.0% · 12mo
- Down + closing
- —
- Monthly P&I
- —
- Monthly cashflow
- —
- DSCR
- —
- Eligible?
- —
Short-term bridge; refi at stabilization.
Rent comps 15 comps
| Address | Beds | Baths | Sqft | Rent | $/sqft | DOM | Units | Dist |
|---|---|---|---|---|---|---|---|---|
| 1580 S Plaza Way Flagstaff, AZ | 1.0–2.0 | 1.0–2.0 | 875 | $2,455 | $2.81 | 43d | 12 | 0.39mi |
| 700 W University Ave Flagstaff, AZ | 2.0 | 1.0–2.0 | 675 | $1,735 | $2.57 | 43d | 1 | 0.48mi |
| 923 W University Ave Flagstaff, AZ | 1.0–2.0 | 1.0–2.0 | 877 | $2,304 | $2.63 | 43d | 36 | 0.56mi |
| 1385 W University Ave Flagstaff, AZ | 2.0 | 2.0 | 906 | $1,725 | $1.90 | 43d | 3 | 0.57mi |
| 1000 W Forest Meadows St Flagstaff, AZ | 2.0 | 2.0 | 947 | $1,925 | $2.03 | 43d | 1 | 0.59mi |
| 2141 S Linmar Ct Flagstaff, AZ | 3.0 | 2.0 | 1727 | $2,500 | $1.45 | 43d | 1 | 0.60mi |
| 800 W Forest Meadows St Flagstaff, AZ | 1.0–3.0 | 1.0–2.0 | 847 | $3,535 | $4.17 | 43d | 32 | 0.73mi |
| 927 W Forest Meadows St Flagstaff, AZ | 1.0–2.0 | 1.0–2.0 | 958 | $2,806 | $2.93 | 43d | 11 | 0.73mi |
| 306 S Humphreys St Flagstaff, AZ | 4.0 | 2.0 | 1500 | $3,595 | $2.40 | 43d | 1 | 1.01mi |
| 2761 W Pico del Monte Cir Flagstaff, AZ | 3.0 | 2.5 | 1600 | $3,125 | $1.95 | 43d | 1 | 1.12mi |
| 600 W University Heights Dr N Flagstaff, AZ | 1.0–2.0 | 1.0–2.0 | 766 | $2,254 | $2.94 | 43d | 4 | 1.21mi |
| 2701 S Woody Mountain Rd Flagstaff, AZ | 1.0–3.0 | 1.0–2.0 | 1078 | $3,110 | $2.88 | 43d | 77 | 1.28mi |
| 2292 S Alvan Clark Blvd Flagstaff, AZ | 2.0–3.0 | 1.0–2.0 | 978 | $1,701 | $1.74 | 43d | 12 | 1.43mi |
| 108 E Paseo del Rio Flagstaff, AZ | 4.0 | 4.0 | 1600 | $3,600 | $2.25 | 43d | 1 | 1.43mi |
| 323 N Leroux St Unit A Flagstaff, AZ | 2.0 | 2.0 | 1500 | $2,000 | $1.33 | 43d | 1 | 1.47mi |
Listing history 18 events
-
2026-06-19days on market $165,000 Active 39 DOM
-
2026-06-18days on market $165,000 Active 38 DOM
-
2026-06-17days on market $165,000 Active 37 DOM
-
2026-06-16days on market $165,000 Active 36 DOM
-
2026-06-15days on market $165,000 Active 35 DOM
-
2026-06-14days on market $165,000 Active 33 DOM
-
2026-06-13days on market $165,000 Active 32 DOM
-
2026-06-10days on market $165,000 Active 30 DOM
-
2026-06-09days on market $165,000 Active 29 DOM
-
2026-06-08days on market $165,000 Active 28 DOM
-
2026-06-07pricedays on market $165,000 Active 27 DOM
-
2026-06-05days on market $185,000 Active 24 DOM
-
2026-06-03days on market $185,000 Active 23 DOM
-
2026-06-02days on market $185,000 Active 22 DOM
-
2026-06-01days on market $185,000 Active 21 DOM
-
2026-05-31days on market $185,000 Active 20 DOM
-
2026-05-30days on market $185,000 Active 19 DOM
-
2026-05-11$185,000 Active 115-char remark
ⓘ Source: listings_history table (triggers on properties + properties_extension) + one-shot
backfill from property_details.listing_events for pre-trigger history.
Climate risk First Street
- Flood 9/10 Extreme FEMA zone X (unshaded) · 99% chance over 30 yrs
- Wildfire 8/10 Severe
- Heat 2/10 Low 7 d/yr ≥86°F today · 19 d/yr by 30 yrs out
- Wind 1/10 Low
- Air quality 1/10 Low 0 unhealthy d/yr today · 0 by 30 yrs out
Nearby sold comps map
Loading sold comps map…
Walkable amenities ~0.75 mi
Loading nearby amenities…
Taxation est. · year 1
- Rental income
- $31,002
- − Mortgage interest
- −$9,243
- − Property taxes
- −$2,475
- − Insurance
- −$1,622
- − Repairs & maintenance
- −$2,480
- − Management
- −$2,480
- − Depreciation
- −$4,800
- Taxable income
- $7,902
- Est. tax owed @ 24.0%
- −$1,896
- After-tax cash flow
- $8,115/yr
For passive investors: Depreciation is non-cash, so a rental often shows a tax loss while cash-flowing — sheltering income. Rental losses are passive: they offset passive income freely, and up to $25,000/yr can offset ordinary (W-2) income if you actively participate and your MAGI is under $100k (phasing out to $0 by $150k); unused losses carry forward. On sale, claimed depreciation is recaptured at up to 25%, and gains may owe capital-gains tax (a 1031 exchange can defer both). Figures are a year-1 estimate at your 24.0% rate — not tax advice; consult a CPA.
Condition & rehab AI · 18 photos
This manufactured home is in good condition with cosmetic updates needed to enhance its curb appeal and interior aesthetics.
Repairs flagged
- Minor ceiling fan in living room — light fixture is loose
- Minor ceiling fan in kitchen — light fixture is loose
Value-add opportunities
- Both paint interior walls — enhances curb appeal and interior aesthetics
- Both replace ceiling fans — improves functionality and aesthetics
- Both install new flooring — enhances curb appeal and interior aesthetics
- Both update kitchen cabinets — enhances functionality and aesthetics
- Both update bathrooms — enhances functionality and aesthetics
Renovation cost estimate screening
| Repair item | Severity | Est. cost |
|---|---|---|
| ceiling fan in living room · light fixture is loose | Minor | $500–3,000 |
| ceiling fan in kitchen · light fixture is loose | Minor | $500–3,000 |
| Total estimated repair cost · 2 items | $1,000–6,000 |
Value-add ROI direction
- Both paint interior walls — enhances curb appeal and interior aesthetics ↑
- Both replace ceiling fans — improves functionality and aesthetics ↑
- Both install new flooring — enhances curb appeal and interior aesthetics ↑
- Both update kitchen cabinets — enhances functionality and aesthetics ↑
- Both update bathrooms — enhances functionality and aesthetics ↑
ⓘ Cost ranges are severity-bucket heuristics (US national rule-of-thumb). Get contractor quotes + a written scope before underwriting a rehab budget.
Schools (NCES district)
- District
- Flagstaff Unified District (4192)
- NCES district ID
- 0402860
- Math proficiency
- 18% ▼ -16.00%
- Reading proficiency
- 29% ▼ -10.00%
- Median HH income
- $53,510
- Composite
- 21.11/100
- National rank
- #8437
- State rank
- #158 of 249 in AZ
Livability — Flagstaff
- Score
- 61/100
- State rank
- #167
- US rank
- #18308
Category grades
Schools grade is shown separately in the Schools card above.
Census & demographics
- Census place
- Flagstaff, AZ
- County
- Coconino County · 91,667 people
- City population
- 91,667
- Metro
- Flagstaff, AZ
- Population (ZIP)
- 37,312
- Household income
- $64,626
- Rent vs Own
- Severe rent burden
- 3117.0
Population outlook (Coconino County) Hauer SSP2
- Today (2025)
- 150,645 people
- By 2030
- 156,857 · +4.1%
- By 2040
- 168,714 · +12.0%
- By 2050
- 181,082 · +20.2%
- By 2075
- 218,399 · +45.0%
- By 2100
- 238,853 · +58.6%
Race, ethnicity, and origin ACS 2023
- Neighborhood character
- Diverse neighborhood (Simpson 0.59)
- Race & ethnicity
- White 62% Hispanic / Latino 15% Native American 12% Two or more races 9% Asian 3% Black 2%
- Hispanic origin (detail)
- Mexican 10%
- Common ancestry
- Italian 2% Slovak 2% Romanian 2%
- Foreign-born
- 6% · Canada, China, Jamaica
- Languages at home
- 84% English-only · Spanish 8% Other Indo-European 1% Chinese 1%
Political lean MEDSL · Coconino
- 2024 margin
- D (+19.9) · D 59.2% · R 39.4% · Other 1.4%
- 2008→2024 swing
- +2.9pp toward D · 2008: 17.0pp · 2024: 19.9pp
- All cycles
- 2024: D+19.9 2020: D+24.1 2016: D+19.4 2012: D+14.9 2008: D+17.0
Not yet ingested
- Civics
- —
Market trends
- HPI YoY
- ▼ -488.37%
- Current HPI
- 393.2551
- Rent YoY
- ▲ 0.55%
- Metro
- Flagstaff, AZ
- State GDP YoY
- ▲ 4.54%
- F500 in state
- 20
Industry mix (Fortune 500 HQ in AZ)
| Industry | F500 HQs | Revenue |
|---|---|---|
| Technology | 2 | $13B |
|
||
| Mining / Metals | 1 | $23B |
|
||
| Environmental Services | 1 | $16B |
|
||
| Metals / Steel | 1 | $14B |
|
||
| Technology Distribution | 1 | $9B |
|
||
| Homebuilding | 1 | $8B |
|
||
Price history
-10.8% since first listed2 events — show timeline
- 2026-06-06 Price Changed $165,000 NAZMLS
- 2026-05-11 Listed $185,000 NAZMLS
Cash-flow waterfall
monthlySold comps — $/sqft
last 12 mo · ≤1 miLoading sold comps…