84 Quinns Ln Ln · Jones, PA
Flood risk 1/10 · Minimal
- FEMA flood zone
- X (unshaded)
- Chance of flooding over 30 yrs
- 0.0%
- Est. flood insurance / yr
- $507 – $1,088
Fire risk 1/10 · Minimal
- Est. fire insurance / yr
- $511 – $949
Heat risk 1/10 · Minimal
- Hot days now (above 89°F)
- 6 days/yr
- Hot days in 30 yrs
- 14 days/yr
Wind risk 2/10 · Minimal
- Chance of severe wind over 30 yrs
- —
Air-quality risk 2/10 · Minimal
- Unhealthy air days now
- 0 days/yr
- Unhealthy air days in 30 yrs
- 1 days/yr
Risk factors via First Street. Map © Google.
Why this score? — see what drove the B+ grade
The composite is a weighted blend of 9 inputs, each scored 0–100. Each bar is that input's sub-score; the figure is the points it added to the 100-point composite (weight × sub-score).
- Cash flow +30.0/30.0
- DSCR +10.0/10.0
- Appreciation +10.0/10.0
- 1% rule +8.6/10.0
- ARV discount +7.5/15.0
- Schools +4.2/10.0
- Rent growth +2.5/5.0
- Livability +2.5/5.0
- Condition / age +2.5/5.0
$60,000
🖨 Deal sheet 📄 Offer letter ✓ Due diligence
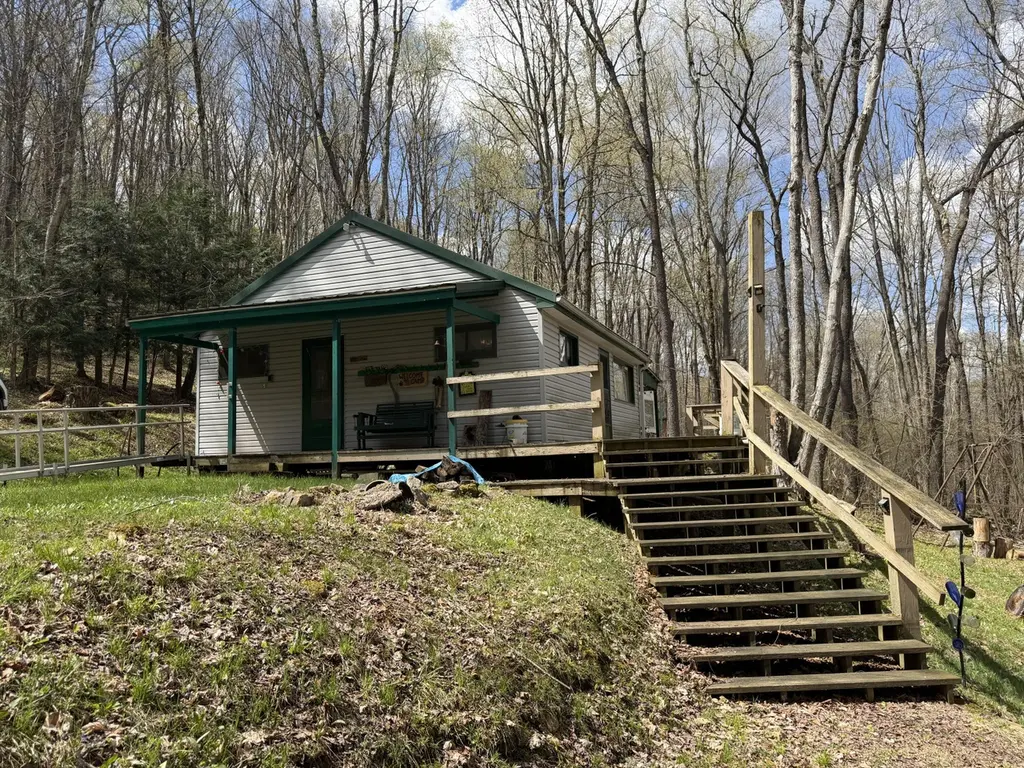
Listing remarks
Two bedroom, 1 bathroom cabin in Elk State Park. Seasonal water views of East Branch Lake. Propane wall heater and wood stove heating sources. Cabin has septic and spring house with 150 gal holding tank for water. Partial wrap around porch, back patio and fire pit area provide many options for enjoying the outdoors. Small storage shed. Minutes to Instanter Boat Launch. Property is on leased state land, only $200 per year. If you've always wanted a camp in Elk State Park near East Branch Lake, this is your opportunity!
Key facts
- Wood stove heating
- Propane wall heater
- Fire pit area
Tags
Neighborhood map
What this means for you Summary
Snapshot
- This is a 2-bed/1.0-bath other listed at $60k.
Deal economics
- At list price, monthly cash flow is $282 ($3k/yr) — positive.
- The deal already cash-flows at list — no discount required.
- Meets the 1% rule at list price ($815 rent vs $60k).
Location & tenants
- Location reads: area grade B — affects rentability + tenant quality, not the cash-flow math above.
- Johnsonburg Area SD (rural): math 40% / reading 60% proficiency, ranked #192 of 539 in PA (top 36%) — acceptable for families but not a draw, mixed tenant base, ~2y average lease.
- Market conditions: 7 active listings in the ZIP; 53 units permitted in Elk County in 2024 (0 in 5+ unit buildings).
Forward outlook
- In year one you build about $6k of equity ($415 loan paydown + $6k appreciation (10.0% local appreciation)).
- Elk County population projected at -27% by 2050 — secular population decline; favor cash flow + early exit over multi-decade hold.
- At projected returns (10.0% appreciation + 3.0% rent growth), your $17k cash investment doubles in ~2 years — after that, you're playing with house money.
- By year 6, paydown + projected appreciation supports a ~$38k cash-out refi (75% LTV) — recoverable capital for the next deal without selling this one.
Negotiation context
- Only 4 days on market — expect competitive offers; lowballing is unlikely to land.
Risks & watch-outs
- Watch-outs: built in 1957 — expect roof / HVAC / electrical / plumbing capex.
Questions for the listing agent
- Built in 1957 — when were the roof, HVAC, electrical panel, plumbing, and water heater last replaced?
- Is there a deadline driving the sale (1031 exchange, divorce, estate, relocation)? That informs how much negotiation room exists.
- What's the average days-on-market for RENTAL listings here right now (not sales)? A rising rental-DOM trend means longer vacancies and softer asking-rent achievability than the comps imply.
- What's the recent tenant-quality profile in this submarket — average credit score on applications, eviction rate, late-payment / NSF rate, and stable-employment percentage? A property-management company in the area should have these aggregated.
- How much new for-sale + rental construction is in the pipeline within 1–3 miles? Heavy new supply typically softens prices + rents 12–24 months out; constrained supply supports both.
Investment metrics
- 1% rule
- 1.36% ✓
- Cap rate
- 11.93%
- Cash-on-cash
- 20.14%
- DSCR
- 1.90
- GRM
- 6.1
CMA / ARV
No comps found within radius.
Projected returns pro-forma
10.0% appreciation · 3.0% rent growth · sell at horizon
- IRR
- 39.3%
- Equity multiple
- 4.01×
- Total profit
- $50,613
- Equity at exit
- $54,053
- IRR
- 33.8%
- Equity multiple
- 9.03×
- Total profit
- $134,887
- Equity at exit
- $116,567
Cash invested: $16,800 (down + closing). Projections, not guarantees.
Landlord ↔ Tenant lean methodology
- Overall (STATE)
- 62 Landlord-Friendly
- State Pennsylvania
- 62 Landlord-Friendly · EVEN
- County
- — inherits STATE
- City
- — inherits STATE
ZIP-level market 15870
- Home prices YoY
- 12.1%
- Active inventory
- 7
- Price-to-rent
- 6.1×
Monthly cashflow live
- Estimated rent
- $815 medium interval (Pro) →
- Mortgage (P&I)
- −$315
- Tax from tax record
- −$22 /mo · $263/yr
- Insurance
- −$25
- HOA
- −$0
- Vacancy / Maint / Mgmt
- −$171
- Net cashflow
- $282
Break-even live
UW: 25.0% down · 7.5% · 30yr · 1.5% tax · 5.0% vac · 8.0% maint · 8.0% mgmt
Financing live
Cash to close
- Down payment
- $15,000
- Closing costs
- $1,800
- Reserves months
- —
- Total cash needed
- —
Loan-product check · same deal, 3 products live
Conventional
25% down · 7.5% · 30yr
- Down + closing
- —
- Monthly P&I
- —
- Monthly cashflow
- —
- DSCR
- —
- Eligible?
- —
Personal DTI + credit; lowest rate.
DSCR
20% down · 8.5% · 30yr
- Down + closing
- —
- Monthly P&I
- —
- Monthly cashflow
- —
- DSCR
- —
- Eligible?
- —
No personal income docs; deal must DSCR.
Hard money
10% down · 12.0% · 12mo
- Down + closing
- —
- Monthly P&I
- —
- Monthly cashflow
- —
- DSCR
- —
- Eligible?
- —
Short-term bridge; refi at stabilization.
Listing history 2 events
-
2026-04-27status Pending
-
2026-04-23$60,000 Active
ⓘ Source: listings_history table (triggers on properties + properties_extension) + one-shot
backfill from property_details.listing_events for pre-trigger history.
Tax reassessment forecast PA · Partial reset (capped growth)
- Current annual tax
- $263 · $22/mo
- Projected year-2 tax
- $606 · $50/mo
- Expected delta
- +$342/yr (+$29/mo · 130.1%)
ⓘ Screening estimate from a state-policy table — verify with the county assessor before closing.
Climate risk First Street
- Flood 1/10 Low FEMA zone X (unshaded) · 0% chance over 30 yrs
- Wildfire 1/10 Low
- Heat 1/10 Low 6 d/yr ≥89°F today · 14 d/yr by 30 yrs out
- Wind 2/10 Low
- Air quality 2/10 Low 0 unhealthy d/yr today · 1 by 30 yrs out
Nearby sold comps map
Loading sold comps map…
Walkable amenities ~0.75 mi
Loading nearby amenities…
Taxation est. · year 1
- Rental income
- $9,775
- − Mortgage interest
- −$3,361
- − Property taxes
- −$263
- − Insurance
- −$300
- − Repairs & maintenance
- −$782
- − Management
- −$782
- − Depreciation
- −$1,745
- Taxable income
- $2,541
- Est. tax owed @ 24.0%
- −$610
- After-tax cash flow
- $2,773/yr
For passive investors: Depreciation is non-cash, so a rental often shows a tax loss while cash-flowing — sheltering income. Rental losses are passive: they offset passive income freely, and up to $25,000/yr can offset ordinary (W-2) income if you actively participate and your MAGI is under $100k (phasing out to $0 by $150k); unused losses carry forward. On sale, claimed depreciation is recaptured at up to 25%, and gains may owe capital-gains tax (a 1031 exchange can defer both). Figures are a year-1 estimate at your 24.0% rate — not tax advice; consult a CPA.
Schools (NCES district)
- District
- Johnsonburg Area SD
- NCES district ID
- 4212570
- Math proficiency
- 40% ▼ -6.00%
- Reading proficiency
- 60% ▼ -10.00%
- Median HH income
- $42,329
- Composite
- 41.97/100
- National rank
- #3343
- State rank
- #192 of 539 in PA
Livability — Jones
No livability data for this city. (Only ~50 U.S. cities are tracked.)
Census & demographics
- Population (ZIP)
- 1,239
Population outlook (Elk County) Hauer SSP2
- Today (2025)
- 28,567 people
- By 2030
- 27,172 · -4.9%
- By 2040
- 24,111 · -15.6%
- By 2050
- 20,967 · -26.6%
- By 2075
- 15,355 · -46.2%
- By 2100
- 10,418 · -63.5%
Race, ethnicity, and origin ACS 2023
- Neighborhood character
- Predominantly White (98%)
- Race & ethnicity
- White 98% Two or more races 2%
- Common ancestry
- Romanian 12% American 4% Lithuanian 2%
- Foreign-born
- 1%
Political lean MEDSL · Elk
- 2024 margin
- Solid R (+47.0) · D 26.1% · R 73.1%
- 2008→2024 swing
- -51.3pp toward R · 2008: 4.3pp · 2024: -47.0pp
- All cycles
- 2024: R+47.0 2020: R+45.1 2016: R+43.8 2012: R+15.7 2008: D+4.3
Not yet ingested
- Civics
- —
Market trends
- HPI YoY
- ▲ 17.11%
- Current HPI
- 158.4897
- Rent YoY
- —
- Metro
- —
- State GDP YoY
- ▲ 1.68%
- F500 in state
- 34
Industry mix (Fortune 500 HQ in PA)
| Industry | F500 HQs | Revenue |
|---|---|---|
| Healthcare | 2 | $309B |
|
||
| Insurance | 2 | $27B |
|
||
| Telecommunications / Media | 1 | $124B |
|
||
| Industrial Distribution | 1 | $22B |
|
||
| Financial Services | 1 | $20B |
|
||
| Chemicals / Materials | 1 | $18B |
|
||
Price history
2 events — show timeline
- 2026-04-27 Pending — ECBR
- 2026-04-23 Listed $60,000 ECBR
Property tax history
+1.3%/yrLatest (2026): $263 · +3.9% YoY. Source: county tax records.
Cash-flow waterfall
monthlySold comps — $/sqft
last 12 mo · ≤1 miLoading sold comps…