 Multi-family
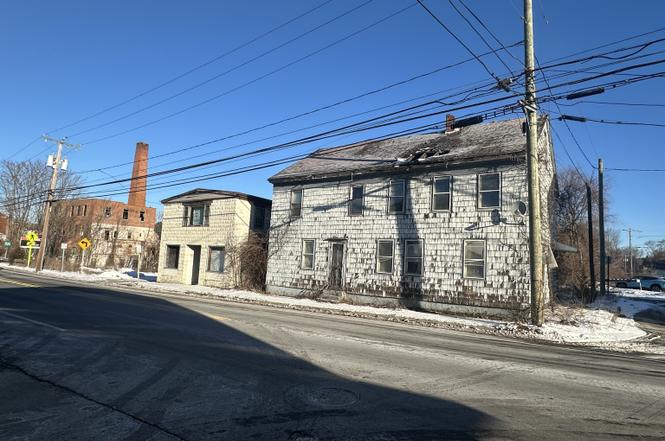
438 Hartford Pike · Dayville, CT
Flood risk 9/10 · Severe
- FEMA flood zone
- X (shaded)
- Chance of flooding over 30 yrs
- 0.99%
- Est. flood insurance / yr
- $473 – $860
Fire risk 3/10 · Minor
- Est. fire insurance / yr
- $829 – $1,539
Heat risk 4/10 · Minor
- Hot days now (above 95°F)
- 7 days/yr
- Hot days in 30 yrs
- 15 days/yr
Wind risk 6/10 · Moderate
- Chance of severe wind over 30 yrs
- 54.0%
Air-quality risk 3/10 · Minor
- Unhealthy air days now
- 2 days/yr
- Unhealthy air days in 30 yrs
- 3 days/yr
Risk factors via First Street. Map © Google.
Why this score? — see what drove the B- grade
The composite is a weighted blend of 9 inputs, each scored 0–100. Each bar is that input's sub-score; the figure is the points it added to the 100-point composite (weight × sub-score).
- Cash flow +30.0/30.0
- 1% rule +10.0/10.0
- DSCR +10.0/10.0
- ARV discount +7.5/15.0
- Schools +2.9/10.0
- Rent growth +2.5/5.0
- Livability +2.5/5.0
- Condition / age +2.5/5.0
- Appreciation +0.0/10.0
$150,000
🖨 Deal sheet 📄 Offer letter ✓ Due diligence
Multi-family units
County records classify this as Multi-Family (2-4 Unit). Listing-text estimate: 1 unit. estimate disagrees with records
Listing remarks
Sale includes property located at 442 Hartford Pike also. Zoned General Commercial. Multi family that need to be completely renovated or torn down. No interior access
Key facts
- 3,484 sq ft lot
- Built 1910
- Listed 55 days
Neighborhood map
What this means for you Summary
Snapshot
- This is a 4-bed/2.0-bath multifamily listed at $150k.
Deal economics
- At list price, monthly cash flow is $3k ($39k/yr) — positive.
- The deal already cash-flows at list — no discount required.
- Meets the 1% rule at list price ($5k rent vs $150k).
- Recommended offer: $146k (3.0% below list) — sets the bar for market timing.
Location & tenants
- Location reads: area grade B — affects rentability + tenant quality, not the cash-flow math above.
- Killingly School District (rural): math 21% / reading 44% proficiency, ranked #119 of 153 in CT (top 78%) — families likely to look elsewhere, expect single-tenant / working-renter base with shorter leases.
- Market conditions: 33 active listings in the ZIP; 1 comparable units currently listed for rent nearby; 149 units permitted in Northeastern Connecticut Planning Region in 2024 (0 in 5+ unit buildings).
Forward outlook
- Local home prices are declining (-3.0%/yr); year-one equity from $1k of loan paydown is wiped out by about $4k of value loss. Plan a longer hold.
- At projected returns (-3.0% appreciation + 3.0% rent growth), your $42k cash investment doubles in ~2 years — after that, you're playing with house money.
Negotiation context
- It's been on market 55 days — a 3% lower offer ($146k) is reasonable based on typical stale-listing flexibility.
- 8 sale attempts since 17y ago with the ask held roughly flat each time — persistent listings suggest the price (not the market) is what's stuck; bring a comps-based counter.
- Current owner paid $30k; list at $150k implies a 400% gain — meaningful room to come down on a strong offer.
Risks & watch-outs
- Watch-outs: flood insurance adds $56/mo; built in 1910 — expect roof / HVAC / electrical / plumbing capex.
- Climate carrying-cost: severe flood risk; major wind risk, 54% chance of damaging wind over 30y — expect insurance premiums to compound above CPI over the hold.
Questions for the listing agent
- It's been on market 55 days. Have you received any prior offers? Is the seller open to a 3% concession, seller financing, or rate buy-down credit?
- Built in 1910 — when were the roof, HVAC, electrical panel, plumbing, and water heater last replaced?
- What's the actual annual flood-insurance premium (NFIP or private), and is the property in a SFHA with mandatory coverage?
- Is there a deadline driving the sale (1031 exchange, divorce, estate, relocation)? That informs how much negotiation room exists.
- What's the average days-on-market for RENTAL listings here right now (not sales)? A rising rental-DOM trend means longer vacancies and softer asking-rent achievability than the comps imply.
- What's the recent tenant-quality profile in this submarket — average credit score on applications, eviction rate, late-payment / NSF rate, and stable-employment percentage? A property-management company in the area should have these aggregated.
- How much new apartment / multifamily construction is in the pipeline within 1–3 miles? Heavy new supply (>2% of stock underway) typically softens rents 12–24 months out; light construction supports rent growth.
Investment metrics
- 1% rule
- 3.53% ✓
- Cap rate
- 32.57%
- Cash-on-cash
- 93.84%
- DSCR
- 5.18
- GRM
- 2.4
CMA / ARV
No comps found within radius.
Projected returns pro-forma
-3.0% appreciation · 3.0% rent growth · sell at horizon
- IRR
- 93.0%
- Equity multiple
- 5.32×
- Total profit
- $181,381
- Equity at exit
- $22,365
- IRR
- 95.8%
- Equity multiple
- 11.07×
- Total profit
- $422,881
- Equity at exit
- $12,969
Cash invested: $42,000 (down + closing). Projections, not guarantees.
Landlord ↔ Tenant lean methodology
- Overall (STATE)
- 27 Tenant-Leaning
- State Connecticut
- 27 Tenant-Leaning · D+7
- County
- — inherits STATE
- City
- — inherits STATE
ZIP-level market 06241
- Home prices YoY
- -14.2%
- Active inventory
- 33
- Price-to-rent
- 4.7×
Monthly cashflow live
- Estimated rent
- $5,296 medium interval (Pro) →
- Mortgage (P&I)
- −$787
- Tax from tax record
- −$50 /mo · $602/yr
- Insurance
- −$62
- Flood insurance flood zone
- −$56 /mo · $666/yr
- HOA
- −$0
- Vacancy / Maint / Mgmt
- −$1,112
- Net cashflow
- $3,229
Break-even live
2-unit breakdown (identical units grouped — click to expand)
| Units | Beds | Baths | Est. rent |
|---|---|---|---|
| 2× units | 3 | 1.5 | $5,296 |
| #1 | 3 | 1.5 | $2,648 |
| #2 | 3 | 1.5 | $2,648 |
| Total (2 units) | $5,296 | ||
UW: 25.0% down · 7.5% · 30yr · 1.5% tax · 5.0% vac · 8.0% maint · 8.0% mgmt
Financing live
Cash to close
- Down payment
- $37,500
- Closing costs
- $4,500
- Reserves months
- —
- Total cash needed
- —
Loan-product check · same deal, 3 products live
Conventional
25% down · 7.5% · 30yr
- Down + closing
- —
- Monthly P&I
- —
- Monthly cashflow
- —
- DSCR
- —
- Eligible?
- —
Personal DTI + credit; lowest rate.
DSCR
20% down · 8.5% · 30yr
- Down + closing
- —
- Monthly P&I
- —
- Monthly cashflow
- —
- DSCR
- —
- Eligible?
- —
No personal income docs; deal must DSCR.
Hard money
10% down · 12.0% · 12mo
- Down + closing
- —
- Monthly P&I
- —
- Monthly cashflow
- —
- DSCR
- —
- Eligible?
- —
Short-term bridge; refi at stabilization.
Rent comps 1 comps
| Address | Beds | Baths | Sqft | Rent | $/sqft | DOM | Units | Dist |
|---|---|---|---|---|---|---|---|---|
| 387 Putnam Pike Killingly, CT | 3.0 | 1.0 | 2392 | $1,800 | $0.75 | 1d | 1 | 1.46mi |
Listing history 17 events
-
2026-03-06status Under Contract
-
2026-01-10$150,000 Active
-
2024-09-29historical
-
2024-09-11$80,000 Active
-
2013-05-06soldstatus $30,000
-
2013-05-03soldstatus $30,000
-
2013-02-23$59,900
-
2013-01-12historical
-
2012-07-12$59,900
-
2011-10-08historical
-
2011-04-09$114,900
-
2011-04-08historical
-
2010-10-08$114,900
-
2010-10-06historical
-
2009-06-30$114,900
-
2009-06-30historical
-
2009-03-01$179,900
ⓘ Source: listings_history table (triggers on properties + properties_extension) + one-shot
backfill from property_details.listing_events for pre-trigger history.
Tax reassessment forecast CT · Partial reset (capped growth)
- Current annual tax
- $602 · $50/mo
- Projected year-2 tax
- $1,906 · $159/mo
- Expected delta
- +$1,304/yr (+$109/mo · 216.6%)
ⓘ Screening estimate from a state-policy table — verify with the county assessor before closing.
Climate risk First Street
- Flood 9/10 Extreme FEMA zone X (shaded) · 99% chance over 30 yrs
- Wildfire 3/10 Moderate
- Heat 4/10 Moderate 7 d/yr ≥95°F today · 15 d/yr by 30 yrs out
- Wind 6/10 Major 54% chance of damaging wind over 30 yrs
- Air quality 3/10 Moderate 2 unhealthy d/yr today · 3 by 30 yrs out
Nearby sold comps map
Loading sold comps map…
Walkable amenities ~0.75 mi
Loading nearby amenities…
Taxation est. · year 1
- Rental income
- $63,552
- − Mortgage interest
- −$8,402
- − Property taxes
- −$602
- − Insurance
- −$1,416
- − Repairs & maintenance
- −$5,084
- − Management
- −$5,084
- − Depreciation
- −$4,364
- Taxable income
- $38,599
- Est. tax owed @ 24.0%
- −$9,264
- After-tax cash flow
- $29,484/yr
For passive investors: Depreciation is non-cash, so a rental often shows a tax loss while cash-flowing — sheltering income. Rental losses are passive: they offset passive income freely, and up to $25,000/yr can offset ordinary (W-2) income if you actively participate and your MAGI is under $100k (phasing out to $0 by $150k); unused losses carry forward. On sale, claimed depreciation is recaptured at up to 25%, and gains may owe capital-gains tax (a 1031 exchange can defer both). Figures are a year-1 estimate at your 24.0% rate — not tax advice; consult a CPA.
Schools (NCES district)
- District
- Killingly School District
- NCES district ID
- 0902070
- Math proficiency
- 21% ▼ -19.00%
- Reading proficiency
- 44% ▼ -14.00%
- Median HH income
- $55,485
- Composite
- 28.71/100
- National rank
- #6684
- State rank
- #119 of 153 in CT
Livability — Dayville
No livability data for this city. (Only ~50 U.S. cities are tracked.)
Census & demographics
- Census place
- Dayville, CT
- Population (ZIP)
- 6,317
Population outlook (Northeastern Connecticut County) Hauer SSP2
- By 2040
- 104,160
Race, ethnicity, and origin ACS 2023
- Neighborhood character
- Predominantly White (88%)
- Race & ethnicity
- White 88% Hispanic / Latino 6% Two or more races 4% Asian 2%
- Hispanic origin (detail)
- Puerto Rican 3%
- Common ancestry
- Lithuanian 20% Romanian 7% Russian 3%
- Foreign-born
- 4% · Canada, South Korea
- Languages at home
- 97% English-only · Spanish 1% Other Asian/Pacific 1%
Political lean MEDSL · Northeastern Connecticut
- 2024 margin
- R (+15.4) · D 41.5% · R 57.0% · Other 1.5%
- All cycles
- 2024: R+15.4
Not yet ingested
- Civics
- —
Market trends
- HPI YoY
- ▼ -35.86%
- Current HPI
- 216.1835
- Rent YoY
- —
- Metro
- —
- State GDP YoY
- ▲ 1.06%
- F500 in state
- 38
Industry mix (Fortune 500 HQ in CT)
| Industry | F500 HQs | Revenue |
|---|---|---|
| Industrial Machinery | 4 | $38B |
|
||
| Insurance | 3 | $71B |
|
||
| Financial Services | 2 | $25B |
|
||
| Transportation / Logistics | 2 | $18B |
|
||
| Healthcare | 1 | $247B |
|
||
| Telecommunications | 1 | $55B |
|
||
Price history
-16.6% since first listed17 events — show timeline
- 2026-03-06 Pending — Smart MLS
- 2026-01-10 Listed $150,000 Smart MLS
- 2024-09-29 Listing Removed — Smart MLS
- 2024-09-11 Listed $80,000 Smart MLS
- 2013-05-06 Sold (Public Records) $30,000 Public Records
- 2013-05-03 Sold (MLS) $30,000 Smart MLS
- 2013-02-23 Listed $59,900 Smart MLS
- 2013-01-12 Listing Removed — Smart MLS
- 2012-07-12 Listed $59,900 Smart MLS
- 2011-10-08 Listing Removed — Smart MLS
- 2011-04-09 Listed $114,900 Smart MLS
- 2011-04-08 Listing Removed — Smart MLS
- 2010-10-08 Listed $114,900 Smart MLS
- 2010-10-06 Listing Removed — Smart MLS
- 2009-06-30 Listing Removed — Smart MLS
- 2009-06-30 Listed $114,900 Smart MLS
- 2009-03-01 Listed $179,900 Smart MLS
Property tax history
-2.6%/yrLatest (2023): $602 · +6.5% YoY. Source: county tax records.
Cash-flow waterfall
monthlySold comps — $/sqft
last 12 mo · ≤1 miLoading sold comps…