 Multi-family
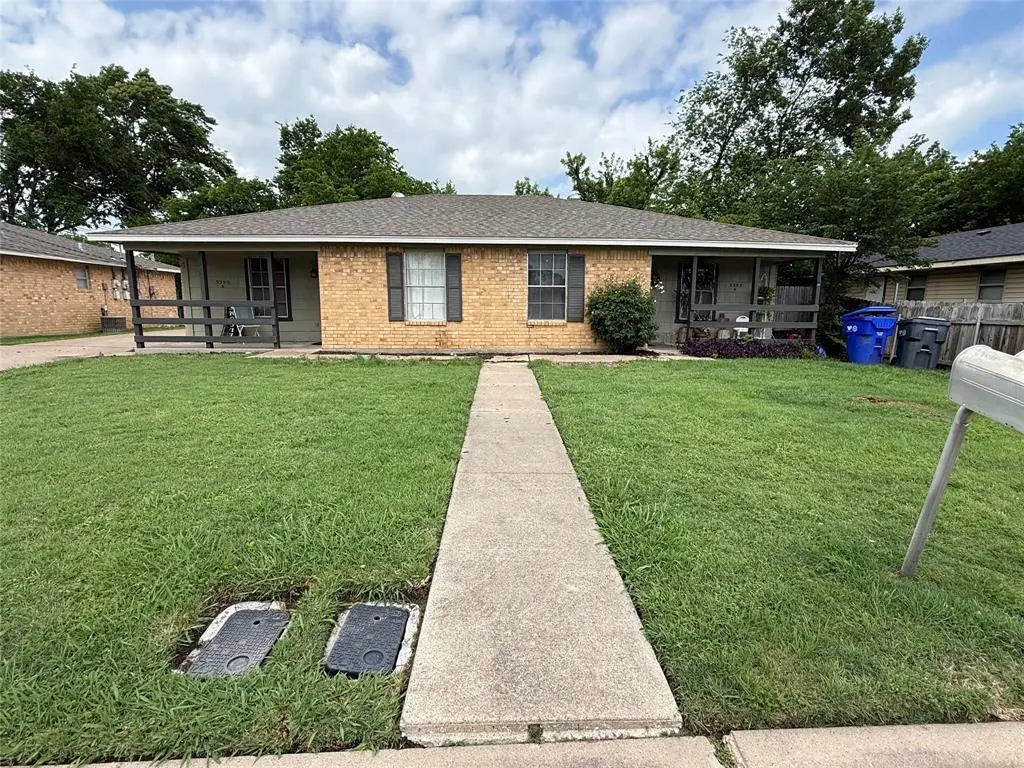
3305 Alta Vista Dr · Waco, TX
Flood risk 1/10 · Minimal
- FEMA flood zone
- X (unshaded)
- Chance of flooding over 30 yrs
- 0.0%
- Est. flood insurance / yr
- $507 – $1,088
Fire risk 2/10 · Minimal
- Est. fire insurance / yr
- $1,222 – $2,270
Heat risk 7/10 · Major
- Hot days now (above 109°F)
- 7 days/yr
- Hot days in 30 yrs
- 24 days/yr
Wind risk 6/10 · Moderate
- Chance of severe wind over 30 yrs
- 60.0%
Air-quality risk 1/10 · Minimal
- Unhealthy air days now
- 0 days/yr
- Unhealthy air days in 30 yrs
- 0 days/yr
Risk factors via First Street. Map © Google.
Why this score? — see what drove the D grade
The composite is a weighted blend of 9 inputs, each scored 0–100. Each bar is that input's sub-score; the figure is the points it added to the 100-point composite (weight × sub-score).
- ARV discount +15.0/15.0
- Cash flow +10.7/30.0
- 1% rule +4.1/10.0
- Livability +3.7/5.0
- DSCR +3.1/10.0
- Rent growth +3.0/5.0
- Condition / age +2.5/5.0
- Schools +1.8/10.0
- Appreciation +0.0/10.0
$190,000
🖨 Deal sheet (PDF) 📄 Offer letter ✓ Due diligence
Multi-family units
County records classify this as Multi-Family (2-4 Unit). Listing-text estimate: 1 unit. estimate disagrees with records
Listing remarks MLS
Great curb appeal and strong investment potential! Ideally located just one mile from the Circle and only three miles from Baylor University, this property is perfectly positioned for consistent rental demand. Features include ample parking, convenient exterior storage, and identical floor plans. A great opportunity for investors looking to generate reliable income with room for future growth.
Key facts
- Exterior storage
- Ample parking
- Reliable income
Tags
Neighborhood map
What this means for you Summary
Snapshot
- This is a 2-bed/1.0-bath multifamily listed at $190k.
Deal economics
- At list price, monthly cash flow is $-91 ($-1k/yr) — negative.
- To cash-flow at today's rent, offer at most $174k (8.5% below list).
- To meet the 1% rule (rent ≥ 1% of price), the offer needs to be $173k (8.9% below list).
- Recommended offer: $173k (8.9% below list) — sets the bar for 1% rule.
- Cap rate 5.7% vs local median 3.9% in Waco — top-decile yield for the area; either an underpriced asset or a hidden risk that comps aren't pricing in. Stress-test before assuming the spread holds.
Location & tenants
- Location reads 74/100 on livability (#166 in TX, #4,378 nationally) — a middle-class / working-renter tenant base. Strengths: cost of living A+, housing A+, health & safety A+; Watch: crime D, commute F, employment D-.
- Waco ISD (urban): math 20% / reading 24% proficiency, ranked #773 of 826 in TX (top 94%) — low school quality limits family demand, transient renter base, plan for 1-2y turnover; 81% free/reduced lunch — lower-income household profile, screen leases tightly.
- Zoned schools: Alta Vista El (math 12% / reading 12%, grade F, #4,207 of 4,322 statewide, top 98%, 545 students, 89% FRL, charter); Cesar Chavez Middle (math 16% / reading 24%, grade F, #1,428 of 1,662 statewide, top 87%, 840 students, 94% FRL); University H S (math 39% / reading 31%, grade F, #954 of 1,632 statewide, top 59%, 1,678 students, 89% FRL).
- Market conditions: Rents rising (+1.9%/yr); 318 active listings in the ZIP; 5 comparable units currently listed for rent nearby; rentals at typical pace (median 23d on market — plan ~3-4 weeks tenant-placement turnaround); lower-income renter base — watch delinquency; 1,014 units permitted in McLennan County in 2024 (200 in 5+ unit buildings).
- At $1,731/mo this rent would consume 50% of the median local household income ($42k/yr) (locally 3883% of renters already pay >50% of income on rent) — very limited rent-growth headroom before tenants either downsize or default.
Forward outlook
- Local home prices are declining (-3.0%/yr); year-one equity from $1k of loan paydown is wiped out by about $6k of value loss. Plan a longer hold.
- McLennan County population projected at +17% by 2050 — long-run rental-demand tailwind backs the buy-and-hold thesis.
Negotiation context
- It's been on market 68 days — a 6% lower offer ($179k) is reasonable based on typical stale-listing flexibility.
Risks & watch-outs
- Climate carrying-cost: major wind risk, 60% chance of damaging wind over 30y; extreme-heat days projected 7→24/yr by 2055 (HVAC capex compounding) — expect insurance premiums to compound above CPI over the hold.
Questions for the listing agent
- What do current leases actually rent for vs. the listed asking? Can we see a recent rent roll and the last 12 months of T-12 income?
- It's been on market 68 days. Have you received any prior offers? Is the seller open to a 9% concession, seller financing, or rate buy-down credit?
- Why hasn't it sold? Are there any deal-killer items the seller is aware of (foundation, flood, title, zoning, code violations)?
- Is there a deadline driving the sale (1031 exchange, divorce, estate, relocation)? That informs how much negotiation room exists.
- Schools are D-rated, which usually means shorter tenancies and higher turnover. Who's the typical renter profile here, and what's been the actual vacancy rate?
- Crime grade is D in this area — have there been break-ins, vandalism, or insurance claims at this property in the last 3 years? What carrier currently insures it and at what premium?
- The area grade is low — what's the realistic commute time and amenity access for the typical tenant pool here? Any planned neighborhood developments (good or bad) we should know about?
- What's the average days-on-market for RENTAL listings here right now (not sales)? A rising rental-DOM trend means longer vacancies and softer asking-rent achievability than the comps imply.
- What's the recent tenant-quality profile in this submarket — average credit score on applications, eviction rate, late-payment / NSF rate, and stable-employment percentage? A property-management company in the area should have these aggregated.
- How much new apartment / multifamily construction is in the pipeline within 1–3 miles? Heavy new supply (>2% of stock underway) typically softens rents 12–24 months out; light construction supports rent growth.
Investment metrics
- 1% rule
- 0.91% ✗
- Cap rate
- 5.72%
- Cash-on-cash
- -2.06%
- DSCR
- 0.91
- GRM
- 9.1
CMA / ARV
- ARV (median comp)
- $231,501
- List price
- $190,000
- Delta
- -17.93%
- Verdict
- UNDERPRICED
- Comps
- 4 within 1.0 mi
Projected returns pro-forma
-3.0% appreciation · 1.86% rent growth · sell at horizon
- IRR
- -21.1%
- Equity multiple
- 0.28×
- Total profit
- $-38,459
- Equity at exit
- $28,330
- IRR
- -17.5%
- Equity multiple
- 0.09×
- Total profit
- $-48,389
- Equity at exit
- $16,428
Cash invested: $53,200 (down + closing). Projections, not guarantees.
Landlord ↔ Tenant lean methodology
- Overall (STATE)
- 87 Strongly Landlord-Friendly
- State Texas
- 87 Strongly Landlord-Friendly · R+5
- County
- — inherits STATE
- City
- — inherits STATE
ZIP-level market 76706
- Home prices YoY
- -29.1%
- Rents YoY
- 1.9%
- Active inventory
- 318
- Price-to-rent
- 9.1×
Monthly cashflow live
- Estimated rent
- $1,731 high interval (Pro) →
- Mortgage (P&I)
- −$996
- Tax from tax record
- −$383 /mo · $4,597/yr
- Insurance
- −$79
- HOA
- −$0
- Vacancy / Maint / Mgmt
- −$363
- Net cashflow
- $-91
Break-even live
Sensitivity live
| Price | -10% $16 | -5% $-38 | +0% $-91 | +5% $-145 | +10% $-199 |
|---|---|---|---|---|---|
| Rent | -10% $-228 | -5% $-160 | +0% $-91 | +5% $-23 | +10% $45 |
| Rate | -1.0pp $4 | -0.5pp $-43 | base $-91 | +0.5pp $-141 | +1.0pp $-191 |
UW: 25.0% down · 7.5% · 30yr · 1.5% tax · 5.0% vac · 8.0% maint · 8.0% mgmt
Financing live
Cash to close
- Down payment
- $47,500
- Closing costs
- $5,700
- Reserves months
- —
- Total cash needed
- —
Loan-product check · same deal, 3 products live
Conventional
25% down · 7.5% · 30yr
- Down + closing
- —
- Monthly P&I
- —
- Monthly cashflow
- —
- DSCR
- —
- Eligible?
- —
Personal DTI + credit; lowest rate.
DSCR
20% down · 8.5% · 30yr
- Down + closing
- —
- Monthly P&I
- —
- Monthly cashflow
- —
- DSCR
- —
- Eligible?
- —
No personal income docs; deal must DSCR.
Hard money
10% down · 12.0% · 12mo
- Down + closing
- —
- Monthly P&I
- —
- Monthly cashflow
- —
- DSCR
- —
- Eligible?
- —
Short-term bridge; refi at stabilization.
Rent comps 5 comps
| Address | Beds | Baths | Sqft | Rent | $/sqft | DOM | Units | Dist |
|---|---|---|---|---|---|---|---|---|
| 3300 Wynmore Dr Waco, TX | 3.0 | 2.0 | 1678 | $1,850 | $1.10 | 45d | 1 | 0.11mi |
| 3300 Wynmore Dr Waco, TX | 3.0 | 2.0 | 1678 | $1,850 | $1.10 | 22d | 1 | 0.11mi |
| 3743 Vista Cove Dr Waco, TX | 3.0 | 2.0 | 1509 | $1,850 | $1.23 | 22d | 1 | 0.48mi |
| 1628 Ewing Ave Waco, TX | 3.0 | 2.0 | 1472 | $2,400 | $1.63 | 15d | 1 | 1.24mi |
| 2201 Creekview Dr Waco, TX | 1.0–3.0 | 1.0–2.0 | 990 | $1,758 | $1.78 | 15d | 20 | 1.44mi |
Listing history 19 events
-
2026-06-21days on market $190,000 Active 68 DOM
-
2026-06-18days on market $190,000 Active 65 DOM
-
2026-06-17days on market $190,000 Active 64 DOM
-
2026-06-16days on market $190,000 Active 63 DOM
-
2026-06-15days on market $190,000 Active 62 DOM
-
2026-06-14days on market $190,000 Active 60 DOM
-
2026-06-13days on market $190,000 Active 59 DOM
-
2026-06-10days on market $190,000 Active 57 DOM
-
2026-06-09days on market $190,000 Active 56 DOM
-
2026-06-08days on market $190,000 Active 55 DOM
-
2026-06-07days on market $190,000 Active 54 DOM
-
2026-06-05days on market $190,000 Active 51 DOM
-
2026-06-03days on market $190,000 Active 50 DOM
-
2026-06-02days on market $190,000 Active 49 DOM
-
2026-06-01days on market $190,000 Active 48 DOM
-
2026-05-31days on market $190,000 Active 47 DOM
-
2026-05-30days on market $190,000 Active 46 DOM
-
2026-05-12price $190,000 396-char remark
Show marketing remark (396 chars)
Great curb appeal and strong investment potential! Ideally located just one mile from the Circle and only three miles from Baylor University, this property is perfectly positioned for consistent rental demand. Features include ample parking, convenient exterior storage, and identical floor plans. A great opportunity for investors looking to generate reliable income with room for future growth.
-
2026-04-14$209,000 Active 396-char remark
Show marketing remark (396 chars)
Great curb appeal and strong investment potential! Ideally located just one mile from the Circle and only three miles from Baylor University, this property is perfectly positioned for consistent rental demand. Features include ample parking, convenient exterior storage, and identical floor plans. A great opportunity for investors looking to generate reliable income with room for future growth.
ⓘ Source: listings_history table (triggers on properties + properties_extension) + one-shot
backfill from property_details.listing_events for pre-trigger history.
Tax reassessment forecast TX · Resets to sale price
- Current annual tax
- $4,597 · $383/mo
- Projected year-2 tax
- $4,597 · $383/mo
- Expected delta
- $0/yr ($0/mo · 0.0%)
ⓘ Screening estimate from a state-policy table — verify with the county assessor before closing.
Climate risk First Street
- Flood 1/10 Low FEMA zone X (unshaded) · 0% chance over 30 yrs
- Wildfire 2/10 Low
- Heat 7/10 Severe 7 d/yr ≥109°F today · 24 d/yr by 30 yrs out
- Wind 6/10 Major 60% chance of damaging wind over 30 yrs
- Air quality 1/10 Low 0 unhealthy d/yr today · 0 by 30 yrs out
Nearby sold comps map
Loading sold comps map…
Walkable amenities ~0.75 mi
Loading nearby amenities…
Taxation est. · year 1
- Rental income
- $20,767
- − Mortgage interest
- −$10,643
- − Property taxes
- −$4,597
- − Insurance
- −$950
- − Repairs & maintenance
- −$1,661
- − Management
- −$1,661
- − Depreciation
- −$5,527
- Taxable loss
- −$4,272
- Est. tax savings @ 24.0%
- +$1,025
- After-tax cash flow
- $-72/yr
For passive investors: Depreciation is non-cash, so a rental often shows a tax loss while cash-flowing — sheltering income. Rental losses are passive: they offset passive income freely, and up to $25,000/yr can offset ordinary (W-2) income if you actively participate and your MAGI is under $100k (phasing out to $0 by $150k); unused losses carry forward. On sale, claimed depreciation is recaptured at up to 25%, and gains may owe capital-gains tax (a 1031 exchange can defer both). Figures are a year-1 estimate at your 24.0% rate — not tax advice; consult a CPA.
Schools (NCES district)
- District
- Waco ISD
- NCES district ID
- 4844280
- Math proficiency
- 20% ▼ -14.00%
- Reading proficiency
- 24% ▼ -6.00%
- Median HH income
- $29,208
- Composite
- 17.57/100
- National rank
- #9043
- State rank
- #773 of 826 in TX
Livability — Waco
- Score
- 74/100
- State rank
- #166
- US rank
- #4378
Category grades
Schools grade is shown separately in the Schools card above.
Census & demographics
- Census place
- Waco, TX
- County
- McLennan County · 213,088 people
- City population
- 125,319
- Metro
- Waco, TX
- Population (ZIP)
- 41,627
- Household income
- $41,656
- Rent vs Own
- Severe rent burden
- 3883.0
Population outlook (McLennan County) Hauer SSP2
- Today (2025)
- 264,191 people
- By 2030
- 273,578 · +3.6%
- By 2040
- 291,506 · +10.3%
- By 2050
- 308,044 · +16.6%
- By 2075
- 349,648 · +32.3%
- By 2100
- 364,779 · +38.1%
Race, ethnicity, and origin ACS 2023
- Neighborhood character
- Diverse neighborhood (Simpson 0.64)
- Race & ethnicity
- White 49% Hispanic / Latino 31% Two or more races 17% Black 15% Asian 3%
- Hispanic origin (detail)
- Mexican 29%
- Common ancestry
- Lithuanian 1% Iranian 1% Romanian 1%
- Foreign-born
- 9% · Canada, Vietnam, China
- Languages at home
- 78% English-only · Spanish 19% Other Indo-European 1%
Political lean MEDSL · McLennan
- 2024 margin
- Solid R (+30.9) · D 34.0% · R 64.9% · Other 1.0%
- 2008→2024 swing
- -7.0pp toward R · 2008: -23.9pp · 2024: -30.9pp
- All cycles
- 2024: R+30.9 2020: R+23.4 2016: R+27.1 2012: R+29.8 2008: R+23.9
Not yet ingested
- Civics
- —
Market trends
- HPI YoY
- ▼ -94.31%
- Current HPI
- 230.2557
- Rent YoY
- ▲ 1.86%
- Metro
- Waco, TX
- State GDP YoY
- ▲ 3.95%
- F500 in state
- 110
Industry mix (Fortune 500 HQ in TX)
| Industry | F500 HQs | Revenue |
|---|---|---|
| Energy | 16 | $1,198B |
|
||
| Technology | 5 | $198B |
|
||
| Engineering / Construction | 4 | $72B |
|
||
| Energy Services | 3 | $60B |
|
||
| Utilities | 3 | $41B |
|
||
| Healthcare | 2 | $330B |
|
||
Price history
-9.1% since first listed2 events — show timeline
- 2026-05-12 Price Changed $190,000 NTREIS
- 2026-04-14 Listed $209,000 NTREIS
Property tax history
+8.2%/yrLatest (2025): $4,597 · +11.8% YoY. Source: county tax records.
Cash-flow waterfall
monthlySold comps — $/sqft
last 12 mo · ≤1 miLoading sold comps…