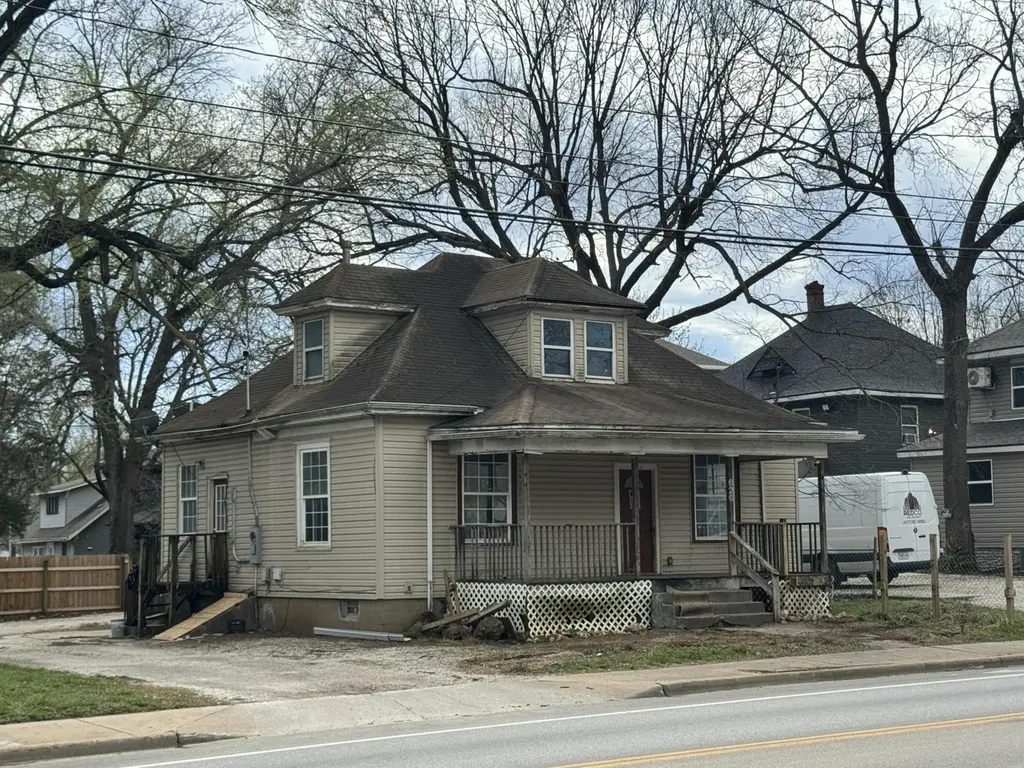
626 W Division St · Springfield, MO
Flood risk 1/10 · Minimal
- FEMA flood zone
- X (unshaded)
- Chance of flooding over 30 yrs
- 0.0%
- Est. flood insurance / yr
- $473 – $860
Fire risk 1/10 · Minimal
- Est. fire insurance / yr
- $1,054 – $1,958
Heat risk 5/10 · Moderate
- Hot days now (above 104°F)
- 7 days/yr
- Hot days in 30 yrs
- 17 days/yr
Wind risk 2/10 · Minimal
- Chance of severe wind over 30 yrs
- —
Air-quality risk 2/10 · Minimal
- Unhealthy air days now
- 1 days/yr
- Unhealthy air days in 30 yrs
- 2 days/yr
Risk factors via First Street. Map © Google.
Why this score? — see what drove the B+ grade
The composite is a weighted blend of 9 inputs, each scored 0–100. Each bar is that input's sub-score; the figure is the points it added to the 100-point composite (weight × sub-score).
- Cash flow +30.0/30.0
- ARV discount +15.0/15.0
- DSCR +10.0/10.0
- 1% rule +8.1/10.0
- Livability +3.8/5.0
- Rent growth +3.6/5.0
- Schools +3.2/10.0
- Condition / age +2.5/5.0
- Appreciation +0.0/10.0
$81,000
🖨 Deal sheet 📄 Offer letter ✓ Due diligence
Listing remarks MLS
3 bedroom, 1 bathroom home located a couple blocks from Cox North Hospital and Commercial Street Historic District with easy access to North Kansas Expressway. The home includes a covered front porch, one bedroom on the main level, two bedrooms upstairs, and an unfinished basement. Property is being sold as-is.
Key facts
- Covered front porch
- Unfinished basement
- 3,920 sq ft lot
Tags
Neighborhood map
What this means for you Summary
Snapshot
- This is a 1-bed/1.0-bath single-family listed at $81k.
Deal economics
- At list price, monthly cash flow is $319 ($4k/yr) — positive.
- The deal already cash-flows at list — no discount required.
- Meets the 1% rule at list price ($1k rent vs $81k).
- Recommended offer: $76k (6.0% below list) — sets the bar for market timing.
- Cap rate 11.0% vs local median 4.6% in Springfield — top-decile yield for the area; either an underpriced asset or a hidden risk that comps aren't pricing in. Stress-test before assuming the spread holds.
Location & tenants
- Location reads 75/100 on livability (#57 in MO, #4,121 nationally) — a middle-class / working-renter tenant base. Strengths: commute A+, cost of living A+, housing A+; Watch: crime F, employment F.
- Springfield R-XII (urban): math 32% / reading 46% proficiency, ranked #174 of 324 in MO (top 54%) — families likely to look elsewhere, expect single-tenant / working-renter base with shorter leases.
- Market conditions: Rents rising fast (+4.2%/yr); 394 active listings in the ZIP; 20 comparable units currently listed for rent nearby; rentals at typical pace (median 23d on market — plan ~3-4 weeks tenant-placement turnaround); 1,302 units permitted in Greene County in 2024 (250 in 5+ unit buildings).
Forward outlook
- Local home prices are declining (-3.0%/yr); year-one equity from $560 of loan paydown is wiped out by about $2k of value loss. Plan a longer hold.
- Greene County population projected at +25% by 2050 — long-run rental-demand tailwind backs the buy-and-hold thesis.
- At projected returns (-3.0% appreciation + 4.2% rent growth), your $23k cash investment doubles in ~7 years — after that, you're playing with house money.
Negotiation context
- It's been on market 83 days — a 6% lower offer ($76k) is reasonable based on typical stale-listing flexibility.
- 2 sale attempts since 10y ago; this cycle's ask has dropped $8k (9%) from the opening price — seller is motivated, your offer sets the floor, not the list.
Risks & watch-outs
- Watch-outs: built in 1910 — expect roof / HVAC / electrical / plumbing capex.
- Climate carrying-cost: extreme-heat days projected 7→17/yr by 2055 (HVAC capex compounding) — expect insurance premiums to compound above CPI over the hold.
Questions for the listing agent
- It's been on market 83 days. Have you received any prior offers? Is the seller open to a 6% concession, seller financing, or rate buy-down credit?
- Built in 1910 — when were the roof, HVAC, electrical panel, plumbing, and water heater last replaced?
- Why hasn't it sold? Are there any deal-killer items the seller is aware of (foundation, flood, title, zoning, code violations)?
- Is there a deadline driving the sale (1031 exchange, divorce, estate, relocation)? That informs how much negotiation room exists.
- Crime grade is F in this area — have there been break-ins, vandalism, or insurance claims at this property in the last 3 years? What carrier currently insures it and at what premium?
- What's the average days-on-market for RENTAL listings here right now (not sales)? A rising rental-DOM trend means longer vacancies and softer asking-rent achievability than the comps imply.
- What's the recent tenant-quality profile in this submarket — average credit score on applications, eviction rate, late-payment / NSF rate, and stable-employment percentage? A property-management company in the area should have these aggregated.
- How much new for-sale + rental construction is in the pipeline within 1–3 miles? Heavy new supply typically softens prices + rents 12–24 months out; constrained supply supports both.
Investment metrics
- 1% rule
- 1.31% ✓
- Cap rate
- 11.01%
- Cash-on-cash
- 16.85%
- DSCR
- 1.75
- GRM
- 6.4
CMA / ARV
- ARV (median comp)
- $132,473
- List price
- $81,000
- Delta
- -38.86%
- Verdict
- UNDERPRICED
- Comps
- 20 within 1.0 mi
Show comp detail 7 sales within ~0.75 mi
| Address | Dist | Beds/Ba | Sqft | Sold | Price | $/sf | Match |
|---|---|---|---|---|---|---|---|
| 1890 N Douglas Ave | 0.43mi | 2/2.0 (+1) | 1,250 (-6%) | 4mo | $174,900 | $140 | 57 |
| 1344 N Grant Ave | 0.17mi | 2/1.0 (+1) | 1,454 (+9%) | 19mo | $120,000 | $83 | 56 |
| 1863 N Grant Ave | 0.38mi | 2/1.0 (+1) | 1,140 (-14%) | 2mo | $149,900 | $131 | 52 |
| 424 E Locust St | 0.54mi | 2/2.0 (+1) | 1,256 (-6%) | 6mo | $159,900 | $127 | 51 |
| 937 N Missouri Ave | 0.55mi | 2/2.0 (+1) | 1,207 (-10%) | 0mo | $180,000 | $149 | 49 |
| 1322 N Benton Ave | 0.62mi | 2/2.0 (+1) | 1,386 (+4%) | 13mo | $209,900 | $151 | 44 |
| 1607 N Washington Ave | 0.67mi | 2/1.0 (+1) | 1,195 (-10%) | 6mo | $164,500 | $138 | 42 |
Match score weights: distance 35% · size 25% · config 20% · recency 20%. Top-matched comps best support the ARV.
Projected returns pro-forma
-3.0% appreciation · 4.24% rent growth · sell at horizon
- IRR
- 9.4%
- Equity multiple
- 1.37×
- Total profit
- $8,494
- Equity at exit
- $12,077
- IRR
- 19.5%
- Equity multiple
- 2.73×
- Total profit
- $39,132
- Equity at exit
- $7,003
Cash invested: $22,680 (down + closing). Projections, not guarantees.
Landlord ↔ Tenant lean methodology
- Overall (STATE)
- 81 Strongly Landlord-Friendly
- State Missouri
- 81 Strongly Landlord-Friendly · R+10
- County
- — inherits STATE
- City
- — inherits STATE
ZIP-level market 65803
- Home prices YoY
- -29.8%
- Rents YoY
- 4.2%
- Active inventory
- 394
- Price-to-rent
- 6.4×
Monthly cashflow live
- Estimated rent
- $1,062 high interval (Pro) →
- Mortgage (P&I)
- −$425
- Tax from tax record
- −$62 /mo · $744/yr
- Insurance
- −$34
- HOA
- −$0
- Vacancy / Maint / Mgmt
- −$223
- Net cashflow
- $319
Break-even live
UW: 25.0% down · 7.5% · 30yr · 1.5% tax · 5.0% vac · 8.0% maint · 8.0% mgmt
Financing live
Cash to close
- Down payment
- $20,250
- Closing costs
- $2,430
- Reserves months
- —
- Total cash needed
- —
Loan-product check · same deal, 3 products live
Conventional
25% down · 7.5% · 30yr
- Down + closing
- —
- Monthly P&I
- —
- Monthly cashflow
- —
- DSCR
- —
- Eligible?
- —
Personal DTI + credit; lowest rate.
DSCR
20% down · 8.5% · 30yr
- Down + closing
- —
- Monthly P&I
- —
- Monthly cashflow
- —
- DSCR
- —
- Eligible?
- —
No personal income docs; deal must DSCR.
Hard money
10% down · 12.0% · 12mo
- Down + closing
- —
- Monthly P&I
- —
- Monthly cashflow
- —
- DSCR
- —
- Eligible?
- —
Short-term bridge; refi at stabilization.
Rent comps 20 comps
| Address | Beds | Baths | Sqft | Rent | $/sqft | DOM | Units | Dist |
|---|---|---|---|---|---|---|---|---|
| 616 W Webster St Springfield, MO | 2.0 | 1.5 | 1178 | $1,050 | $0.89 | 13d | 1 | 0.36mi |
| 203 W Commercial St Unit 2F Springfield, MO | 2.0 | 1.0 | 1000 | $1,150 | $1.15 | 21d | 1 | 0.41mi |
| 317 E Chase St Springfield, MO | 2.0 | 2.0 | 915 | $1,100 | $1.20 | 43d | 1 | 0.59mi |
| 1406 W Calhoun St Unit B Springfield, MO | 2.0 | 1.0 | 885 | $865 | $0.98 | 23d | 1 | 0.67mi |
| 2120 N Johnston Ave Springfield, MO | 2.0 | 1.0 | 880 | $925 | $1.05 | 43d | 1 | 0.79mi |
| 716 E Locust St Unit A Springfield, MO | 2.0 | 1.0 | 915 | $850 | $0.93 | 23d | 1 | 0.83mi |
| 2230 N Campbell Ave Springfield, MO | 2.0 | 1.0 | 1084 | $1,095 | $1.01 | 43d | 1 | 0.87mi |
| 805 E Garfield St Springfield, MO | 2.0 | 1.0 | 950 | $950 | $1.00 | 13d | 1 | 1.01mi |
| 1306 N Frisco Ave Apt A Springfield, MO | 2.0 | 1.5–2.0 | 970 | $995 | $1.03 | 13d | 19 | 1.12mi |
| 2126 N Lexington Ave Springfield, MO | 2.0 | 1.0 | 990 | $895 | $0.90 | 13d | 1 | 1.14mi |
| 235 N Market Ave Springfield, MO | 1.0–4.0 | 1.0–2.0 | 1350 | $1,150 | $0.85 | 13d | 4 | 1.14mi |
| 235 N Market Ave Springfield, MO | 1.0–4.0 | 1.0–2.0 | 1350 | $1,150 | $0.85 | 23d | 5 | 1.14mi |
| 138 Park Central Sq Springfield, MO | 1.0–2.0 | 1.0–2.0 | 1083 | $969 | $0.89 | 13d | 8 | 1.18mi |
| 518 W College St Unit UBL 106 Springfield, MO | 2.0 | 2.0 | 1200 | $1,375 | $1.15 | 43d | 1 | 1.20mi |
| 211 S Market Ave Springfield, MO | 2.0–4.0 | 1.0–2.0 | 1442 | $1,425 | $0.99 | 23d | 5 | 1.23mi |
| 211 S Market Ave Springfield, MO | 2.0–4.0 | 1.0–2.0 | 1442 | $1,425 | $0.99 | 21d | 5 | 1.23mi |
| 535 W Walnut St Springfield, MO | 2.0 | 2.0 | 1096 | $1,495 | $1.36 | 43d | 1 | 1.27mi |
| 623 W Walnut St Springfield, MO | 2.0 | 2.0 | 1180 | $1,300 | $1.10 | 43d | 1 | 1.27mi |
| 2234 N Travis Ave Springfield, MO | 1.0 | 1.0 | 890 | $750 | $0.84 | 43d | 1 | 1.38mi |
| 1200 W Walnut St Springfield, MO | 2.0 | 2.0 | 1000 | $995 | $0.99 | 13d | 3 | 1.42mi |
Listing history 19 events
-
2026-06-18days on market $81,000 Active 83 DOM
-
2026-06-17days on market $81,000 Active 82 DOM
-
2026-06-16days on market $81,000 Active 81 DOM
-
2026-06-15days on market $81,000 Active 80 DOM
-
2026-06-14days on market $81,000 Active 78 DOM
-
2026-06-10days on market $81,000 Active 75 DOM
-
2026-06-09days on market $81,000 Active 74 DOM
-
2026-06-08days on market $81,000 Active 73 DOM
-
2026-06-07days on market $81,000 Active 72 DOM
-
2026-06-03days on market $81,000 Active 68 DOM
-
2026-06-02days on market $81,000 Active 67 DOM
-
2026-06-01days on market $81,000 Active 66 DOM
-
2026-05-31days on market $81,000 Active 65 DOM
-
2026-05-30days on market $81,000 Active 64 DOM
-
2026-04-23price $81,000 312-char remark
Show marketing remark (312 chars)
3 bedroom, 1 bathroom home located a couple blocks from Cox North Hospital and Commercial Street Historic District with easy access to North Kansas Expressway. The home includes a covered front porch, one bedroom on the main level, two bedrooms upstairs, and an unfinished basement. Property is being sold as-is.
-
2026-03-27$89,000 Active 312-char remark
Show marketing remark (312 chars)
3 bedroom, 1 bathroom home located a couple blocks from Cox North Hospital and Commercial Street Historic District with easy access to North Kansas Expressway. The home includes a covered front porch, one bedroom on the main level, two bedrooms upstairs, and an unfinished basement. Property is being sold as-is.
-
2016-06-19$81,712
-
2005-11-30soldstatus
-
2004-05-27soldstatus
ⓘ Source: listings_history table (triggers on properties + properties_extension) + one-shot
backfill from property_details.listing_events for pre-trigger history.
Tax reassessment forecast MO · Resets to sale price
- Current annual tax
- $744 · $62/mo
- Projected year-2 tax
- $786 · $65/mo
- Expected delta
- +$41/yr (+$3/mo · 5.6%)
ⓘ Screening estimate from a state-policy table — verify with the county assessor before closing.
Climate risk First Street
- Flood 1/10 Low FEMA zone X (unshaded) · 0% chance over 30 yrs
- Wildfire 1/10 Low
- Heat 5/10 Major 7 d/yr ≥104°F today · 17 d/yr by 30 yrs out
- Wind 2/10 Low
- Air quality 2/10 Low 1 unhealthy d/yr today · 2 by 30 yrs out
Nearby sold comps map
Loading sold comps map…
Walkable amenities ~0.75 mi
Loading nearby amenities…
Taxation est. · year 1
- Rental income
- $12,745
- − Mortgage interest
- −$4,537
- − Property taxes
- −$744
- − Insurance
- −$405
- − Repairs & maintenance
- −$1,020
- − Management
- −$1,020
- − Depreciation
- −$2,356
- Taxable income
- $2,663
- Est. tax owed @ 24.0%
- −$639
- After-tax cash flow
- $3,183/yr
For passive investors: Depreciation is non-cash, so a rental often shows a tax loss while cash-flowing — sheltering income. Rental losses are passive: they offset passive income freely, and up to $25,000/yr can offset ordinary (W-2) income if you actively participate and your MAGI is under $100k (phasing out to $0 by $150k); unused losses carry forward. On sale, claimed depreciation is recaptured at up to 25%, and gains may owe capital-gains tax (a 1031 exchange can defer both). Figures are a year-1 estimate at your 24.0% rate — not tax advice; consult a CPA.
Schools (NCES district)
- District
- Springfield R-XII
- NCES district ID
- 2928860
- Math proficiency
- 32% ▼ -2.00%
- Reading proficiency
- 46% ▼ -3.00%
- Median HH income
- $37,886
- Composite
- 32.45/100
- National rank
- #5717
- State rank
- #174 of 324 in MO
Livability — Springfield
- Score
- 75/100
- State rank
- #57
- US rank
- #4121
Category grades
Schools grade is shown separately in the Schools card above.
Census & demographics
- Census place
- Springfield, MO
- County
- Greene County · 244,327 people
- City population
- 223,044
- Metro
- Springfield, MO
- Population (ZIP)
- 42,882
- Household income
- $50,572
- Rent vs Own
- Severe rent burden
- 1305.0
Population outlook (Greene County) Hauer SSP2
- Today (2025)
- 319,054 people
- By 2030
- 335,135 · +5.0%
- By 2040
- 366,186 · +14.8%
- By 2050
- 397,431 · +24.6%
- By 2075
- 477,035 · +49.5%
- By 2100
- 520,828 · +63.2%
Race, ethnicity, and origin ACS 2023
- Neighborhood character
- Predominantly White (82%)
- Race & ethnicity
- White 82% Two or more races 9% Hispanic / Latino 6% Black 4%
- Hispanic origin (detail)
- Mexican 2% Puerto Rican 2%
- Common ancestry
- Lithuanian 2% Italian 2% Iranian 2%
- Foreign-born
- 3% · Canada
- Languages at home
- 95% English-only · Spanish 3%
Political lean MEDSL · Greene
- 2024 margin
- Strong R (+20.8) · D 38.9% · R 59.7% · Other 1.4%
- 2008→2024 swing
- -5.0pp toward R · 2008: -15.8pp · 2024: -20.8pp
- All cycles
- 2024: R+20.8 2020: R+20.1 2016: R+27.4 2012: R+24.4 2008: R+15.8
Not yet ingested
- Civics
- —
Market trends
- HPI YoY
- ▼ -87.08%
- Current HPI
- 205.0439
- Rent YoY
- ▲ 4.24%
- Metro
- Springfield, MO
- State GDP YoY
- ▲ 1.84%
- F500 in state
- 20
Industry mix (Fortune 500 HQ in MO)
| Industry | F500 HQs | Revenue |
|---|---|---|
| Healthcare | 1 | $163B |
|
||
| Insurance | 1 | $21B |
|
||
| Industrial Technology | 1 | $17B |
|
||
| Retail | 1 | $16B |
|
||
| Industrial Distribution | 1 | $10B |
|
||
| Utilities | 1 | $9B |
|
||
Price history
-0.9% since first listed5 events — show timeline
- 2026-04-23 Price Changed $81,000 SOMO
- 2026-03-27 Listed $89,000 SOMO
- 2016-06-19 Listed $81,712 SOMO
- 2005-11-30 Sold (Public Records) — Public Records
- 2004-05-27 Sold (Public Records) — Public Records
Property tax history
+4.8%/yrLatest (2025): $744 · +16.7% YoY. Source: county tax records.
Cash-flow waterfall
monthlySold comps — $/sqft
last 12 mo · ≤1 miLoading sold comps…