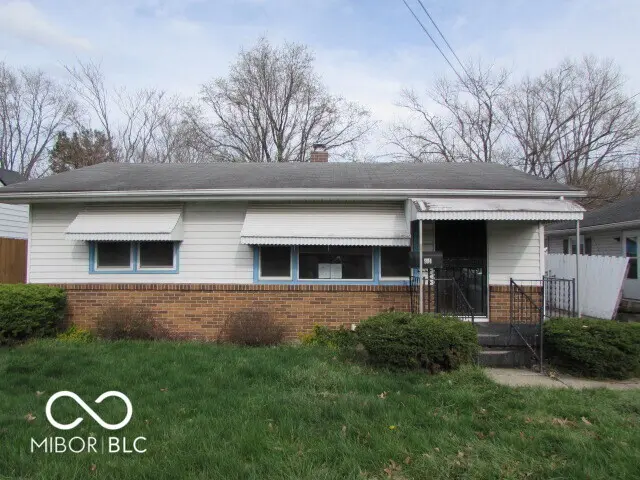
904 Ellenhurst Dr · Anderson, IN
Flood risk 1/10 · Minimal
- FEMA flood zone
- X (unshaded)
- Chance of flooding over 30 yrs
- 0.0%
- Est. flood insurance / yr
- $507 – $1,088
Fire risk 1/10 · Minimal
- Est. fire insurance / yr
- $717 – $1,331
Heat risk 3/10 · Minor
- Hot days now (above 100°F)
- 7 days/yr
- Hot days in 30 yrs
- 18 days/yr
Wind risk 2/10 · Minimal
- Chance of severe wind over 30 yrs
- 1.0%
Air-quality risk 2/10 · Minimal
- Unhealthy air days now
- 1 days/yr
- Unhealthy air days in 30 yrs
- 2 days/yr
Risk factors via First Street. Map © Google.
Why this score? — see what drove the B- grade
The composite is a weighted blend of 9 inputs, each scored 0–100. Each bar is that input's sub-score; the figure is the points it added to the 100-point composite (weight × sub-score).
- Cash flow +25.2/30.0
- ARV discount +15.0/15.0
- DSCR +8.2/10.0
- 1% rule +6.7/10.0
- Rent growth +3.0/5.0
- Livability +3.0/5.0
- Condition / age +2.5/5.0
- Schools +1.6/10.0
- Appreciation +0.0/10.0
$90,000
🖨 Deal sheet 📄 Offer letter ✓ Due diligence
Listing remarks
3BR/2BA ranch home with great potential-perfect for investors or buyers looking for a fixer-upper opportunity. Property is being sold AS-IS. Step in from the covered front porch into the Living Room, with adjacent Kitchen and Laundry Room. Backdoor provides access to the patio and backyard, leading to a detached 2-car garage. Bring your vision and make this home your own!
Key facts
- 7,500 sq ft lot
- 2 garage spots
- Built 1957
Property features AI
Exterior
- Parking: Detached 2-car garage
- Utilities: Public water; Municipal sewer
- Home design: Single-family residence; One level
- Construction: Aluminum siding; Crawl space foundation
- Exterior features: Covered patio/porch; Partial fencing; Fenced yard
Interior
- Kitchen: Range hood
- Bedrooms: 3 bedrooms (all on the main level)
- Bathrooms: 2 full bathrooms (both on the main level)
- Heating & cooling: Forced air heating (natural gas); Central air conditioning
- Interior features: Woodwork stained or painted; Range hood; Gas water heater
- Laundry & utility: Main-level laundry room (16 x 6)
Neighborhood map
What this means for you Summary
Snapshot
- This is a 2-bed/2.0-bath single-family listed at $90k.
Deal economics
- At list price, monthly cash flow is $201 ($2k/yr) — positive.
- The deal already cash-flows at list — no discount required.
- Meets the 1% rule at list price ($1k rent vs $90k).
- Cap rate 9.0% vs local median 6.5% in Anderson — top-decile yield for the area; either an underpriced asset or a hidden risk that comps aren't pricing in. Stress-test before assuming the spread holds.
Location & tenants
- Location reads 60/100 on livability (#521 in IN) — a middle-class / working-renter tenant base. Strengths: cost of living A+, housing A+; Watch: schools F, crime D-, amenities F.
- Anderson Community School Corporation (urban): math 15% / reading 23% proficiency, ranked #280 of 301 in IN (top 93%) — low school quality limits family demand, transient renter base, plan for 1-2y turnover; 70% free/reduced lunch — lower-income household profile, screen leases tightly.
- Market conditions: Rents rising (+1.8%/yr); 159 active listings in the ZIP; 7 comparable units currently listed for rent nearby; rentals at typical pace (median 24d on market — plan ~3-4 weeks tenant-placement turnaround); 43% of comp listings sitting > 30 days — soft ceiling on asking rent; 184 units permitted in Madison County in 2024 (0 in 5+ unit buildings).
Forward outlook
- Local home prices are declining (-3.0%/yr); year-one equity from $622 of loan paydown is wiped out by about $3k of value loss. Plan a longer hold.
- Madison County population projected at -14% by 2050 — secular population decline; favor cash flow + early exit over multi-decade hold.
Negotiation context
- Only 13 days on market — expect competitive offers; lowballing is unlikely to land.
Risks & watch-outs
- Watch-outs: built in 1957 — expect roof / HVAC / electrical / plumbing capex.
Questions for the listing agent
- Built in 1957 — when were the roof, HVAC, electrical panel, plumbing, and water heater last replaced?
- Is there a deadline driving the sale (1031 exchange, divorce, estate, relocation)? That informs how much negotiation room exists.
- Schools are F-rated, which usually means shorter tenancies and higher turnover. Who's the typical renter profile here, and what's been the actual vacancy rate?
- Crime grade is D in this area — have there been break-ins, vandalism, or insurance claims at this property in the last 3 years? What carrier currently insures it and at what premium?
- What's the average days-on-market for RENTAL listings here right now (not sales)? A rising rental-DOM trend means longer vacancies and softer asking-rent achievability than the comps imply.
- What's the recent tenant-quality profile in this submarket — average credit score on applications, eviction rate, late-payment / NSF rate, and stable-employment percentage? A property-management company in the area should have these aggregated.
- How much new for-sale + rental construction is in the pipeline within 1–3 miles? Heavy new supply typically softens prices + rents 12–24 months out; constrained supply supports both.
Investment metrics
- 1% rule
- 1.17% ✓
- Cap rate
- 8.97%
- Cash-on-cash
- 9.55%
- DSCR
- 1.42
- GRM
- 7.1
CMA / ARV
- ARV (on-the-fly)
- $162,482
- Comps found
- 12
Show comp detail 12 sales within ~0.75 mi
| Address | Dist | Beds/Ba | Sqft | Sold | Price | $/sf | Match |
|---|---|---|---|---|---|---|---|
| 521 Woodlawn Dr | 0.23mi | 3/1.0 (+1) | 1,178 (-1%) | 6mo | $153,000 | $130 | 74 |
| 612 Woodlawn Dr | 0.16mi | 3/2.0 (+1) | 1,117 (-6%) | 12mo | $114,900 | $103 | 68 |
| 1521 Daleville Ave | 0.52mi | 3/1.5 (+1) | 1,183 (-0%) | 4mo | $170,000 | $144 | 65 |
| 1520 Chesterfield Dr | 0.43mi | 3/1.5 (+1) | 1,159 (-2%) | 5mo | $167,000 | $144 | 64 |
| 916 Alhambra Dr | 0.73mi | 3/1.0 (+1) | 1,199 (+1%) | 3mo | $155,000 | $129 | 52 |
| 213 S Coventry Dr | 0.51mi | 3/1.5 (+1) | 1,125 (-5%) | 11mo | $176,000 | $156 | 51 |
| 2353 E 10th St | 0.46mi | 2/1.0 | 1,280 (+8%) | 12mo | $155,000 | $121 | 51 |
| 3518 River Bluff Rd | 0.70mi | 3/1.5 (+1) | 1,260 (+6%) | 0mo | $200,000 | $159 | 50 |
| 2216 E 6th St | 0.58mi | 2/1.0 | 1,337 (+13%) | 7mo | $115,000 | $86 | 42 |
| 3504 White River Ct | 0.68mi | 3/1.0 (+1) | 1,118 (-6%) | 10mo | $190,000 | $170 | 41 |
| 318 Chester St | 0.59mi | 3/1.0 (+1) | 1,076 (-9%) | 9mo | $147,000 | $137 | 41 |
| 233 S Elma St | 0.75mi | 2/1.0 | 1,052 (-11%) | 11mo | $130,000 | $124 | 33 |
Match score weights: distance 35% · size 25% · config 20% · recency 20%. Top-matched comps best support the ARV.
Projected returns pro-forma
-3.0% appreciation · 1.82% rent growth · sell at horizon
- IRR
- -3.2%
- Equity multiple
- 0.88×
- Total profit
- $-3,024
- Equity at exit
- $13,419
- IRR
- 5.1%
- Equity multiple
- 1.36×
- Total profit
- $8,956
- Equity at exit
- $7,782
Cash invested: $25,200 (down + closing). Projections, not guarantees.
Landlord ↔ Tenant lean methodology
- Overall (STATE)
- 90 Strongly Landlord-Friendly
- State Indiana
- 90 Strongly Landlord-Friendly · R+11
- County
- — inherits STATE
- City
- — inherits STATE
ZIP-level market 46012
- Home prices YoY
- -18.6%
- Rents YoY
- 1.8%
- Active inventory
- 159
- Price-to-rent
- 7.1×
Monthly cashflow live
- Estimated rent
- $1,051 high interval (Pro) →
- Mortgage (P&I)
- −$472
- Tax from tax record
- −$120 /mo · $1,440/yr
- Insurance
- −$38
- HOA
- −$0
- Vacancy / Maint / Mgmt
- −$221
- Net cashflow
- $201
Break-even live
UW: 25.0% down · 7.5% · 30yr · 1.5% tax · 5.0% vac · 8.0% maint · 8.0% mgmt
Financing live
Cash to close
- Down payment
- $22,500
- Closing costs
- $2,700
- Reserves months
- —
- Total cash needed
- —
Loan-product check · same deal, 3 products live
Conventional
25% down · 7.5% · 30yr
- Down + closing
- —
- Monthly P&I
- —
- Monthly cashflow
- —
- DSCR
- —
- Eligible?
- —
Personal DTI + credit; lowest rate.
DSCR
20% down · 8.5% · 30yr
- Down + closing
- —
- Monthly P&I
- —
- Monthly cashflow
- —
- DSCR
- —
- Eligible?
- —
No personal income docs; deal must DSCR.
Hard money
10% down · 12.0% · 12mo
- Down + closing
- —
- Monthly P&I
- —
- Monthly cashflow
- —
- DSCR
- —
- Eligible?
- —
Short-term bridge; refi at stabilization.
Rent comps 7 comps
| Address | Beds | Baths | Sqft | Rent | $/sqft | DOM | Units | Dist |
|---|---|---|---|---|---|---|---|---|
| 2505 E 10th St Anderson, IN | 1.0–2.0 | 1.0 | 850 | $949 | $1.12 | 43d | 2 | 0.36mi |
| 530 Alhambra Dr Anderson, IN | 1.0–2.0 | 1.0 | 879 | $1,100 | $1.25 | 43d | 1 | 0.74mi |
| 1045 Alhambra Dr Unit 6 Anderson, IN | 2.0 | 1.5 | 900 | $975 | $1.08 | 23d | 1 | 0.78mi |
| 1829 E 8th St Anderson, IN | 1.0–3.0 | 1.0 | 810 | $1,025 | $1.27 | 23d | 9 | 0.80mi |
| 2625 Lindberg Rd Anderson, IN | 1.0–2.0 | 1.0 | 756 | $1,385 | $1.83 | 43d | 1 | 0.92mi |
| 1023 E 8th St Unit 3 Anderson, IN | 2.0 | 1.5 | 1200 | $1,175 | $0.98 | 7d | 1 | 1.33mi |
| 919 E 6th St Apt 2 Anderson, IN | 1.0 | 1.0 | 700 | $625 | $0.89 | 23d | 1 | 1.42mi |
Listing history 2 events
-
2026-04-30status Pending
-
2026-04-17$90,000 Active
ⓘ Source: listings_history table (triggers on properties + properties_extension) + one-shot
backfill from property_details.listing_events for pre-trigger history.
Tax reassessment forecast IN · Partial reset (capped growth)
- Current annual tax
- $1,440 · $120/mo
- Projected year-2 tax
- $1,440 · $120/mo
- Expected delta
- $0/yr ($0/mo · 0.0%)
ⓘ Screening estimate from a state-policy table — verify with the county assessor before closing.
Climate risk First Street
- Flood 1/10 Low FEMA zone X (unshaded) · 0% chance over 30 yrs
- Wildfire 1/10 Low
- Heat 3/10 Moderate 7 d/yr ≥100°F today · 18 d/yr by 30 yrs out
- Wind 2/10 Low 100% chance of damaging wind over 30 yrs
- Air quality 2/10 Low 1 unhealthy d/yr today · 2 by 30 yrs out
Nearby sold comps map
Loading sold comps map…
Walkable amenities ~0.75 mi
Loading nearby amenities…
Taxation est. · year 1
- Rental income
- $12,608
- − Mortgage interest
- −$5,041
- − Property taxes
- −$1,440
- − Insurance
- −$450
- − Repairs & maintenance
- −$1,009
- − Management
- −$1,009
- − Depreciation
- −$2,618
- Taxable income
- $1,041
- Est. tax owed @ 24.0%
- −$250
- After-tax cash flow
- $2,157/yr
For passive investors: Depreciation is non-cash, so a rental often shows a tax loss while cash-flowing — sheltering income. Rental losses are passive: they offset passive income freely, and up to $25,000/yr can offset ordinary (W-2) income if you actively participate and your MAGI is under $100k (phasing out to $0 by $150k); unused losses carry forward. On sale, claimed depreciation is recaptured at up to 25%, and gains may owe capital-gains tax (a 1031 exchange can defer both). Figures are a year-1 estimate at your 24.0% rate — not tax advice; consult a CPA.
Schools (NCES district)
- District
- Anderson Community School Corporation
- NCES district ID
- 1800150
- Math proficiency
- 15% ▼ -14.00%
- Reading proficiency
- 23% ▼ -7.00%
- Median HH income
- $38,208
- Composite
- 15.93/100
- National rank
- #9250
- State rank
- #280 of 301 in IN
Livability — Anderson
- Score
- 60/100
- State rank
- #521
- US rank
- #18709
Category grades
Schools grade is shown separately in the Schools card above.
Census & demographics
- Census place
- Anderson, IN
- County
- Madison County · 69,445 people
- City population
- 57,762
- Metro
- Indianapolis-Carmel-Anderson, IN
- Population (ZIP)
- 20,855
- Household income
- $58,041
- Rent vs Own
- Severe rent burden
- 987.0
Population outlook (Madison County) Hauer SSP2
- Today (2025)
- 125,800 people
- By 2030
- 122,640 · -2.5%
- By 2040
- 115,420 · -8.3%
- By 2050
- 108,148 · -14.0%
- By 2075
- 91,838 · -27.0%
- By 2100
- 75,670 · -39.8%
Race, ethnicity, and origin ACS 2023
- Neighborhood character
- Predominantly White (85%)
- Race & ethnicity
- White 85% Hispanic / Latino 5% Two or more races 4% Black 4%
- Hispanic origin (detail)
- Mexican 4%
- Common ancestry
- Slovak 3% Serbian 2% Italian 1%
- Foreign-born
- 2% · Canada, Vietnam
- Languages at home
- 96% English-only · Spanish 3%
Political lean MEDSL · Madison
- 2024 margin
- Strong R (+26.9) · D 35.6% · R 62.5% · Other 1.9%
- 2008→2024 swing
- -33.5pp toward R · 2008: 6.5pp · 2024: -26.9pp
- All cycles
- 2024: R+26.9 2020: R+22.6 2016: R+25.7 2012: R+4.5 2008: D+6.5
Not yet ingested
- Civics
- —
Market trends
- HPI YoY
- ▼ -61.16%
- Current HPI
- 266.9819
- Rent YoY
- ▲ 1.82%
- Metro
- Indianapolis-Carmel-Anderson, IN
- State GDP YoY
- ▲ 2.90%
- F500 in state
- 18
Industry mix (Fortune 500 HQ in IN)
| Industry | F500 HQs | Revenue |
|---|---|---|
| Industrial Machinery | 2 | $37B |
|
||
| Healthcare | 1 | $177B |
|
||
| Pharmaceuticals | 1 | $45B |
|
||
| Metals / Steel | 1 | $18B |
|
||
| Agriculture | 1 | $17B |
|
||
| Packaging | 1 | $12B |
|
||
Price history
2 events — show timeline
- 2026-04-30 Pending — MIBOR as Distributed by MLS Grid
- 2026-04-17 Listed $90,000 MIBOR as Distributed by MLS Grid
Property tax history
+103.0%/yrLatest (2024): $1,440 · +28701.2% YoY. Source: county tax records.
Cash-flow waterfall
monthlySold comps — $/sqft
last 12 mo · ≤1 miLoading sold comps…