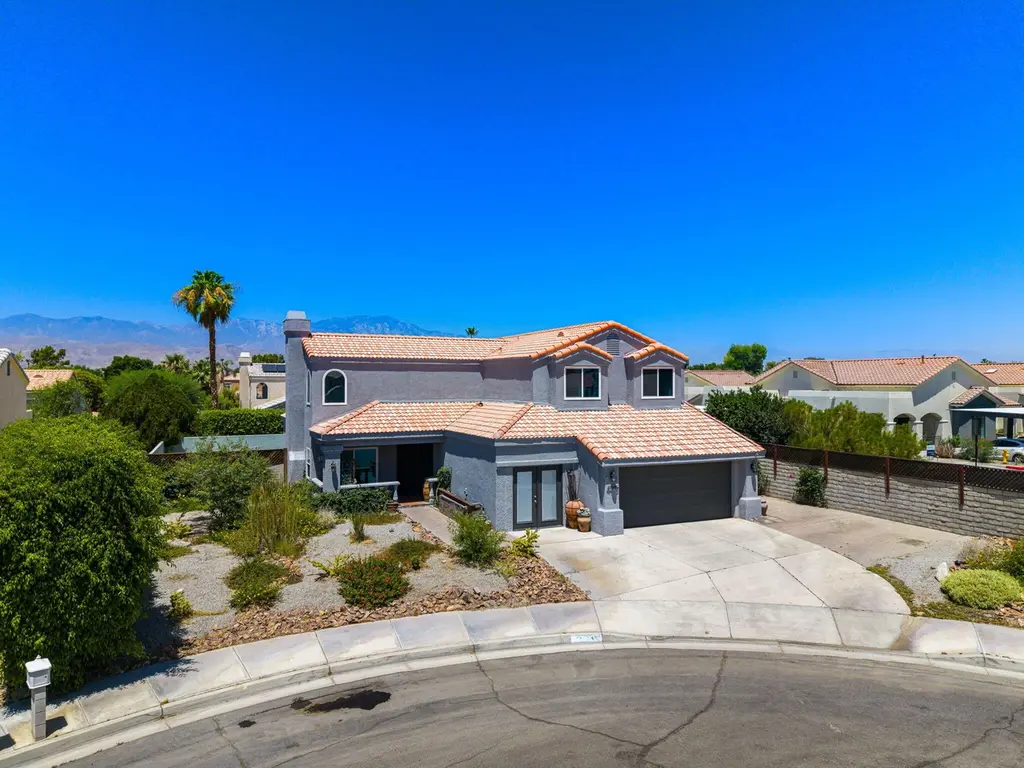
41945 Maryn Ct · Palm Desert, CA
Flood risk 1/10 · Minimal
- FEMA flood zone
- X (unshaded)
- Chance of flooding over 30 yrs
- 0.0%
- Est. flood insurance / yr
- $507 – $1,088
Fire risk 2/10 · Minimal
- Est. fire insurance / yr
- $659 – $1,223
Heat risk 9/10 · Severe
- Hot days now (above 114°F)
- 7 days/yr
- Hot days in 30 yrs
- 19 days/yr
Wind risk 1/10 · Minimal
- Chance of severe wind over 30 yrs
- —
Air-quality risk 4/10 · Minor
- Unhealthy air days now
- 4 days/yr
- Unhealthy air days in 30 yrs
- 5 days/yr
Risk factors via First Street. Map © Google.
Why this score? — see what drove the F grade
The composite is a weighted blend of 9 inputs, each scored 0–100. Each bar is that input's sub-score; the figure is the points it added to the 100-point composite (weight × sub-score).
- Cash flow +10.7/30.0
- ARV discount +7.5/15.0
- Schools +3.8/10.0
- DSCR +3.1/10.0
- Livability +2.6/5.0
- Condition / age +2.5/5.0
- 1% rule +2.4/10.0
- Rent growth +2.4/5.0
- Appreciation +0.0/10.0
$669,000
🖨 Deal sheet 📄 Offer letter ✓ Due diligence
Listing remarks MLS
Beautiful, Spacious Home in Desirable Primrose Neighborhood - No HOA! Ideally located in central Palm Desert, this expansive 5-bedroom, 3-bath home offers 3,000 sq ft of comfortable, upgraded living. The open floor plan includes a living room with gas/wood-burning fireplace, a formal dining room, and a stunning family room/library featuring a full floor-to-ceiling library - perfect for book lovers. The spacious kitchen boasts granite counters, a breakfast bar, cooktop, oven, and ample cabinetry. The 5th bedroom features a private French door entry, ideal as a guest suite or casita with its own mini-split unit. The 4th bedroom has access to a full bath. The luxurious master suite includes a beautifully remodeled bath with walk-in shower, soaking tub, dual vanities, 2 walk in closets, and a balcony with breathtaking mountain views. Enjoy outdoor living with multiple seating areas, a remodeled Pebble Tec pool/spa and BBQ area. Cozy front porch seating area. 2-car garage. Full-sized laundry room with cabinets. Low maintenance Desert Landscape. Upgrades Include: Newer dual-pane windows. Remodeled bathrooms. Laminate/wood/ and tile flooring throughout. Newer light fixtures and ceiling fans. Newer dishwasher & microwave. Brand new water heater. Dual HVAC systems + mini split in casita. Newer pool filter. This beautiful home is a rare combination of size, location, and character! A must see home!.
Key facts
- Open floor plan
- Remodeled bath
- Walk in shower
Tags
Neighborhood map
What this means for you Summary
Snapshot
- This is a 4-bed/3.0-bath single-family listed at $669k.
Deal economics
- At list price, monthly cash flow is $-317 ($-4k/yr) — negative.
- To cash-flow at today's rent, offer at most $613k (8.4% below list).
- To meet the 1% rule (rent ≥ 1% of price), the offer needs to be $496k (25.8% below list).
- Recommended offer: $496k (25.8% below list) — sets the bar for 1% rule.
- Cap rate 5.7% vs local median 3.5% in Palm Desert — top-decile yield for the area; either an underpriced asset or a hidden risk that comps aren't pricing in. Stress-test before assuming the spread holds.
Location & tenants
- Location reads 51/100 on livability (#1,050 in CA) — a working-class tenant base; expect higher turnover. Strengths: schools A-, employment B+, housing B; Watch: crime D, amenities F, commute F.
- Desert Sands Unified (suburban): math 31% / reading 56% proficiency, ranked #199 of 517 in CA (top 38%) — families likely to look elsewhere, expect single-tenant / working-renter base with shorter leases.
- Market conditions: Rents soft (-0.3%/yr); 626 active listings in the ZIP; 35 comparable units currently listed for rent nearby; rentals lingering (median 44d on market — plan ~5-8 weeks vacancy on turnover, expect pricing pressure); 71% of comp listings sitting > 30 days — soft ceiling on asking rent; solid renter incomes; 9,195 units permitted in Riverside County in 2024 (1,512 in 5+ unit buildings).
- At $4,961/mo this rent would consume 67% of the median local household income ($88k/yr) (locally 1181% of renters already pay >50% of income on rent) — very limited rent-growth headroom before tenants either downsize or default.
Forward outlook
- Local home prices are declining (-3.0%/yr); year-one equity from $5k of loan paydown is wiped out by about $20k of value loss. Plan a longer hold.
- Riverside County population projected at +22% by 2050 — long-run rental-demand tailwind backs the buy-and-hold thesis.
Negotiation context
- It's been on market 17 days — a 2% lower offer ($659k) is reasonable based on typical stale-listing flexibility.
- 8 sale attempts since 23y ago with the ask held roughly flat each time — persistent listings suggest the price (not the market) is what's stuck; bring a comps-based counter.
- Current owner paid $280k; list at $669k implies a 139% gain — meaningful room to come down on a strong offer.
Risks & watch-outs
- Climate carrying-cost: extreme-heat days projected 7→19/yr by 2055 (HVAC capex compounding) — expect insurance premiums to compound above CPI over the hold.
Questions for the listing agent
- What do current leases actually rent for vs. the listed asking? Can we see a recent rent roll and the last 12 months of T-12 income?
- Is there a deadline driving the sale (1031 exchange, divorce, estate, relocation)? That informs how much negotiation room exists.
- Schools are A-rated — typically a magnet for longer-tenancy family renters. What's the average tenant stay here, and is there a school-zone premium baked into asking?
- Crime grade is D in this area — have there been break-ins, vandalism, or insurance claims at this property in the last 3 years? What carrier currently insures it and at what premium?
- The area grade is low — what's the realistic commute time and amenity access for the typical tenant pool here? Any planned neighborhood developments (good or bad) we should know about?
- What's the average days-on-market for RENTAL listings here right now (not sales)? A rising rental-DOM trend means longer vacancies and softer asking-rent achievability than the comps imply.
- What's the recent tenant-quality profile in this submarket — average credit score on applications, eviction rate, late-payment / NSF rate, and stable-employment percentage? A property-management company in the area should have these aggregated.
- How much new for-sale + rental construction is in the pipeline within 1–3 miles? Heavy new supply typically softens prices + rents 12–24 months out; constrained supply supports both.
Investment metrics
- 1% rule
- 0.74% ✗
- Cap rate
- 5.72%
- Cash-on-cash
- -2.03%
- DSCR
- 0.91
- GRM
- 11.2
CMA / ARV
- ARV (median comp)
- $1,395,646
- List price
- $669,000
- Delta
- -52.07%
- Verdict
- UNDERPRICED
- Comps
- 20 within 1.0 mi
Show comp detail 12 sales within ~0.75 mi
| Address | Dist | Beds/Ba | Sqft | Sold | Price | $/sf | Match |
|---|---|---|---|---|---|---|---|
| 3 Adria Cir | 0.36mi | 4/2.5 | 2,694 (-2%) | 3mo | $1,100,000 | $408 | 75 |
| 41955 Hemingway Ct | 0.06mi | 4/3.0 | 3,100 (+12%) | 2mo | $480,000 | $155 | 75 |
| 65 Laken Ln | 0.38mi | 4/2.5 | 2,820 (+2%) | 3mo | $973,000 | $345 | 75 |
| 75775 Armour Way | 0.23mi | 3/2.5 (-1) | 2,570 (-7%) | 2mo | $813,500 | $317 | 69 |
| 73 Amalfi Dr | 0.46mi | 3/2.5 (-1) | 2,912 (+5%) | 2mo | $950,000 | $326 | 61 |
| 75819 Via Stia | 0.27mi | 4/4.5 | 3,108 (+12%) | 2mo | $3,395,000 | $1,092 | 59 |
| 679 Mesa Grande Dr | 0.65mi | 3/3.5 (-1) | 2,742 (-1%) | 9mo | $1,650,000 | $602 | 54 |
| 76054 Via Saturnia | 0.58mi | 3/3.5 (-1) | 2,590 (-6%) | 5mo | $2,200,000 | $849 | 52 |
| 830 Snow Creek Cyn | 0.50mi | 3/3.5 (-1) | 2,430 (-12%) | 4mo | $1,515,000 | $623 | 47 |
| 350 Bright Rock Dr | 0.75mi | 4/4.5 | 2,976 (+8%) | 4mo | $1,795,000 | $603 | 43 |
| 639 Mesa Grande Dr | 0.67mi | 3/3.5 (-1) | 2,430 (-12%) | 1mo | $1,675,000 | $689 | 40 |
| 606 Mesa Grande Dr | 0.73mi | 3/3.5 (-1) | 2,430 (-12%) | 4mo | $1,324,340 | $545 | 35 |
Match score weights: distance 35% · size 25% · config 20% · recency 20%. Top-matched comps best support the ARV.
Projected returns pro-forma
-3.0% appreciation · 0.0% rent growth · sell at horizon
- IRR
- -22.8%
- Equity multiple
- 0.23×
- Total profit
- $-143,326
- Equity at exit
- $99,750
- IRR
- -26.4%
- Equity multiple
- -0.11×
- Total profit
- $-207,691
- Equity at exit
- $57,843
Cash invested: $187,320 (down + closing). Projections, not guarantees.
Landlord ↔ Tenant lean methodology
- Overall (STATE)
- 18 Strongly Tenant-Friendly
- State California
- 18 Strongly Tenant-Friendly · D+13
- County
- — inherits STATE
- City
- — inherits STATE
ZIP-level market 92211
- Rents YoY
- -0.3%
- Active inventory
- 626
- Price-to-rent
- 11.2×
Monthly cashflow live
- Estimated rent
- $4,961 high interval (Pro) →
- Mortgage (P&I)
- −$3,508
- Tax from tax record
- −$450 /mo · $5,399/yr
- Insurance
- −$279
- HOA
- −$0
- Vacancy / Maint / Mgmt
- −$1,042
- Net cashflow
- $-317
Break-even live
UW: 25.0% down · 7.5% · 30yr · 1.5% tax · 5.0% vac · 8.0% maint · 8.0% mgmt
Financing live
Cash to close
- Down payment
- $167,250
- Closing costs
- $20,070
- Reserves months
- —
- Total cash needed
- —
Loan-product check · same deal, 3 products live
Conventional
25% down · 7.5% · 30yr
- Down + closing
- —
- Monthly P&I
- —
- Monthly cashflow
- —
- DSCR
- —
- Eligible?
- —
Personal DTI + credit; lowest rate.
DSCR
20% down · 8.5% · 30yr
- Down + closing
- —
- Monthly P&I
- —
- Monthly cashflow
- —
- DSCR
- —
- Eligible?
- —
No personal income docs; deal must DSCR.
Hard money
10% down · 12.0% · 12mo
- Down + closing
- —
- Monthly P&I
- —
- Monthly cashflow
- —
- DSCR
- —
- Eligible?
- —
Short-term bridge; refi at stabilization.
Rent comps 35 comps
| Address | Beds | Baths | Sqft | Rent | $/sqft | DOM | Units | Dist |
|---|---|---|---|---|---|---|---|---|
| 75595 Dempsey Dr Palm Desert, CA | 4.0 | 3.0 | 2562 | $3,900 | $1.52 | 16d | 1 | 0.09mi |
| 75615 Dempsey Dr Palm Desert, CA | 3.0 | 2.0 | 2247 | $12,000 | $5.34 | 43d | 1 | 0.10mi |
| 75741 Via Stia Indian Wells, CA | 4.0 | 4.5 | 3766 | $25,000 | $6.64 | 24d | 1 | 0.21mi |
| 75741 Via Stia Indian Wells, CA | 4.0 | 4.5 | 3766 | $30,000 | $7.97 | 43d | 1 | 0.21mi |
| 41215 Carlotta Dr Palm Desert, CA | 4.0 | 4.5 | 2900 | $6,500 | $2.24 | 43d | 1 | 0.34mi |
| 75940 Nelson Ln Palm Desert, CA | 3.0 | 4.0 | 2726 | $5,000 | $1.83 | 24d | 1 | 0.36mi |
| 75960 Nelson Ln Palm Desert, CA | 3.0 | 3.5 | 2724 | $5,000 | $1.84 | 43d | 1 | 0.37mi |
| 4 Milano Cir Palm Desert, CA | 4.0 | 2.5 | 3334 | $12,000 | $3.60 | 43d | 1 | 0.46mi |
| 86 Beekman Pl Palm Desert, CA | 4.0 | 2.0 | 2002 | $4,450 | $2.22 | 18d | 1 | 0.52mi |
| 22 Belmonte Dr Palm Desert, CA | 3.0 | 2.5 | 2292 | $6,275 | $2.74 | 24d | 1 | 0.57mi |
| 379 Tomahawk Dr Palm Desert, CA | 3.0 | 3.5 | 2430 | $10,000 | $4.12 | 43d | 1 | 0.73mi |
| 430 White Horse Trl Palm Desert, CA | 3.0 | 3.5 | 2712 | $4,500 | $1.66 | 43d | 1 | 0.80mi |
| 410 Gold Canyon Dr Palm Desert, CA | 3.0 | 3.5 | 2742 | $4,000 | $1.46 | 43d | 1 | 0.81mi |
| 148 White Horse Trl Palm Desert, CA | 3.0 | 3.5 | 2742 | $4,000 | $1.46 | 43d | 1 | 0.93mi |
| 701 Indian Ridge Dr Palm Desert, CA | 3.0 | 3.5 | 2430 | $3,500 | $1.44 | 43d | 1 | 0.95mi |
| 704 Mission Creek Dr Palm Desert, CA | 3.0 | 3.5 | 3513 | $5,000 | $1.42 | 11d | 1 | 1.08mi |
| 75355 Santa Fe Trl Palm Desert, CA | 4.0 | 2.5 | 2215 | $3,500 | $1.58 | 43d | 1 | 1.09mi |
| 75417 Spyglass Dr Indian Wells, CA | 3.0 | 3.5 | 2871 | $5,000 | $1.74 | 43d | 1 | 1.15mi |
| 752 Mission Creek Dr Palm Desert, CA | 3.0 | 3.5 | 2742 | $4,250 | $1.55 | 24d | 1 | 1.15mi |
| 43347 Via Orvieto Indian Wells, CA | 4.0 | 3.5 | 4097 | $20,000 | $4.88 | 43d | 1 | 1.19mi |
| 293 Desert Holly Dr Palm Desert, CA | 3.0 | 3.5 | 2508 | $3,200 | $1.28 | 24d | 1 | 1.24mi |
| 44842 Guadalupe Dr Indian Wells, CA | 3.0 | 4.0 | 3011 | $8,000 | $2.66 | 43d | 1 | 1.25mi |
| 407 Desert Holly Dr Palm Desert, CA | 3.0 | 3.5 | 2252 | $3,350 | $1.49 | 5d | 1 | 1.29mi |
| 44824 Del Dios Cir Indian Wells, CA | 3.0 | 3.0 | 2813 | $15,000 | $5.33 | 43d | 1 | 1.29mi |
| 872 Mission Creek Dr Palm Desert, CA | 3.0 | 3.5 | 2742 | $4,000 | $1.46 | 43d | 1 | 1.32mi |
| 44839 Oro Grande Cir Indian Wells, CA | 3.0 | 3.0 | 2813 | $8,500 | $3.02 | 43d | 1 | 1.34mi |
| 75577 Desert Horizons Dr Indian Wells, CA | 3.0 | 3.0 | 2413 | $7,500 | $3.11 | 43d | 1 | 1.35mi |
| 74226 Via Venezia Palm Desert, CA | 5.0 | 6.5 | 3425 | $7,000 | $2.04 | 43d | 1 | 1.37mi |
| 70 Rocio Ct Palm Desert, CA | 3.0 | 2.5 | 2500 | $4,450 | $1.78 | 11d | 1 | 1.37mi |
| 75593 Desert Horizons Dr Indian Wells, CA | 3.0 | 3.0 | 2745 | $9,500 | $3.46 | 43d | 1 | 1.39mi |
| 38960 Kilimanjaro Dr Palm Desert, CA | 3.0 | 3.0 | 1944 | $3,500 | $1.80 | 43d | 1 | 1.41mi |
| 496 Desert Holly Dr Palm Desert, CA | 3.0 | 3.5 | 2182 | $3,300 | $1.51 | 43d | 1 | 1.41mi |
| 763 Box Canyon Trl Palm Desert, CA | 3.0 | 3.5 | 2182 | $3,500 | $1.60 | 43d | 1 | 1.48mi |
| 38940 Tandika Trl N Palm Desert, CA | 3.0 | 3.0 | 3650 | $5,500 | $1.51 | 43d | 1 | 1.49mi |
| 781 Box Canyon Trl Palm Desert, CA | 3.0 | 3.5 | 2368 | $4,000 | $1.69 | 43d | 1 | 1.50mi |
Listing history 40 events
-
2026-06-18days on market $669,000 Active 17 DOM
-
2026-06-17days on market $669,000 Active 16 DOM
-
2026-06-16days on market $669,000 Active 15 DOM
-
2026-06-15days on market $669,000 Active 14 DOM
-
2026-06-13days on market $669,000 Active 12 DOM
-
2026-06-09days on market $669,000 Active 8 DOM
-
2026-06-08days on market $669,000 Active 7 DOM
-
2026-06-07days on market $669,000 Active 6 DOM
-
2026-06-04days on market $669,000 Active 3 DOM
-
2026-06-03days on market $669,000 Active 2 DOM
-
2026-06-02days on market $669,000 Active 1 DOM
-
2026-05-31days on market $669,000 Active 89 DOM
-
2026-04-09price $679,000 1422-char remark
Show marketing remark (1422 chars)
Beautiful, Spacious Home in Desirable Primrose Neighborhood - No HOA! Ideally located in central Palm Desert, this expansive 5-bedroom, 3-bath home offers 3,000 sq ft of comfortable, upgraded living. The open floor plan includes a living room with gas/wood-burning fireplace, a formal dining room, and a stunning family room/library featuring a full floor-to-ceiling library - perfect for book lovers. The spacious kitchen boasts granite counters, a breakfast bar, cooktop, oven, and ample cabinetry. The 5th bedroom features a private French door entry, ideal as a guest suite or casita with its own mini-split unit. The 4th bedroom has access to a full bath. The luxurious master suite includes a beautifully remodeled bath with walk-in shower, soaking tub, dual vanities, 2 walk in closets, and a balcony with breathtaking mountain views. Enjoy outdoor living with multiple seating areas, a remodeled Pebble Tec pool/spa and BBQ area. Cozy front porch seating area. 2-car garage. Full-sized laundry room with cabinets. Low maintenance Desert Landscape. Upgrades Include: Newer dual-pane windows. Remodeled bathrooms. Laminate/wood/ and tile flooring throughout. Newer light fixtures and ceiling fans. Newer dishwasher & microwave. Brand new water heater. Dual HVAC systems + mini split in casita. Newer pool filter. This beautiful home is a rare combination of size, location, and character! A must see home!.
-
2026-03-03$699,000 Active 1422-char remark
Show marketing remark (1422 chars)
Beautiful, Spacious Home in Desirable Primrose Neighborhood - No HOA! Ideally located in central Palm Desert, this expansive 5-bedroom, 3-bath home offers 3,000 sq ft of comfortable, upgraded living. The open floor plan includes a living room with gas/wood-burning fireplace, a formal dining room, and a stunning family room/library featuring a full floor-to-ceiling library - perfect for book lovers. The spacious kitchen boasts granite counters, a breakfast bar, cooktop, oven, and ample cabinetry. The 5th bedroom features a private French door entry, ideal as a guest suite or casita with its own mini-split unit. The 4th bedroom has access to a full bath. The luxurious master suite includes a beautifully remodeled bath with walk-in shower, soaking tub, dual vanities, 2 walk in closets, and a balcony with breathtaking mountain views. Enjoy outdoor living with multiple seating areas, a remodeled Pebble Tec pool/spa and BBQ area. Cozy front porch seating area. 2-car garage. Full-sized laundry room with cabinets. Low maintenance Desert Landscape. Upgrades Include: Newer dual-pane windows. Remodeled bathrooms. Laminate/wood/ and tile flooring throughout. Newer light fixtures and ceiling fans. Newer dishwasher & microwave. Brand new water heater. Dual HVAC systems + mini split in casita. Newer pool filter. This beautiful home is a rare combination of size, location, and character! A must see home!.
-
2026-03-01historical
-
2026-02-22price $699,000
-
2026-01-24price $717,700
-
2025-11-06price $729,000
-
2025-10-06historical
-
2025-10-06$737,700 Active
-
2025-07-22price $749,900
-
2025-07-18price $785,000
-
2025-06-20$800,000 Active
-
2011-06-24soldstatus $280,000 Closed
-
2011-05-26historical
-
2011-03-31price $314,900
-
2011-03-01price $329,500
-
2011-01-26$349,500 Active
-
2008-03-28soldstatus $425,000
-
2008-03-18historical
-
2008-02-08price $449,000
-
2008-02-01price $469,000
-
2008-01-19$495,000
-
2007-09-06historical
-
2006-12-01
-
2006-11-29historical
-
2006-03-28$554,000
-
2004-01-07historical
-
2003-08-18$379,000
-
1992-03-23soldstatus $253,000
ⓘ Source: listings_history table (triggers on properties + properties_extension) + one-shot
backfill from property_details.listing_events for pre-trigger history.
Tax reassessment forecast CA · Resets to sale price
- Current annual tax
- $5,399 · $450/mo
- Projected year-2 tax
- $5,399 · $450/mo
- Expected delta
- $0/yr ($0/mo · -0.0%)
ⓘ Screening estimate from a state-policy table — verify with the county assessor before closing.
Climate risk First Street
- Flood 1/10 Low FEMA zone X (unshaded) · 0% chance over 30 yrs
- Wildfire 2/10 Low
- Heat 9/10 Extreme 7 d/yr ≥114°F today · 19 d/yr by 30 yrs out
- Wind 1/10 Low
- Air quality 4/10 Moderate 4 unhealthy d/yr today · 5 by 30 yrs out
Nearby sold comps map
Loading sold comps map…
Walkable amenities ~0.75 mi
Loading nearby amenities…
Taxation est. · year 1
- Rental income
- $59,538
- − Mortgage interest
- −$37,474
- − Property taxes
- −$5,399
- − Insurance
- −$3,345
- − Repairs & maintenance
- −$4,763
- − Management
- −$4,763
- − Depreciation
- −$19,462
- Taxable loss
- −$15,669
- Est. tax savings @ 24.0%
- +$3,760
- After-tax cash flow
- $-49/yr
For passive investors: Depreciation is non-cash, so a rental often shows a tax loss while cash-flowing — sheltering income. Rental losses are passive: they offset passive income freely, and up to $25,000/yr can offset ordinary (W-2) income if you actively participate and your MAGI is under $100k (phasing out to $0 by $150k); unused losses carry forward. On sale, claimed depreciation is recaptured at up to 25%, and gains may owe capital-gains tax (a 1031 exchange can defer both). Figures are a year-1 estimate at your 24.0% rate — not tax advice; consult a CPA.
Schools (NCES district)
- District
- Desert Sands Unified
- NCES district ID
- 0611110
- Math proficiency
- 31% ▼ -4.00%
- Reading proficiency
- 56% ▲ 7.00%
- Median HH income
- $54,957
- Composite
- 37.77/100
- National rank
- #4346
- State rank
- #199 of 517 in CA
Livability — Palm Desert
- Score
- 51/100
- State rank
- #1050
- US rank
- #25164
Category grades
Schools grade is shown separately in the Schools card above.
Census & demographics
- Census place
- Palm Desert, CA
- County
- Riverside County · 2,287,001 people
- City population
- 58,615
- Metro
- Riverside-San Bernardino-Ontario, CA
- Population (ZIP)
- 28,092
- Household income
- $88,477
- Rent vs Own
- Severe rent burden
- 1181.0
Population outlook (Riverside County) Hauer SSP2
- Today (2025)
- 2,664,475 people
- By 2030
- 2,802,692 · +5.2%
- By 2040
- 3,050,904 · +14.5%
- By 2050
- 3,256,783 · +22.2%
- By 2075
- 3,655,058 · +37.2%
- By 2100
- 3,766,594 · +41.4%
Race, ethnicity, and origin ACS 2023
- Neighborhood character
- Predominantly White (75%)
- Race & ethnicity
- White 75% Hispanic / Latino 16% Two or more races 11% Asian 4% Black 3% Native American 1%
- Hispanic origin (detail)
- Mexican 12%
- Common ancestry
- Scotch-Irish 3% Slovak 3% Romanian 3%
- Foreign-born
- 16% · Canada, China
- Languages at home
- 85% English-only · Spanish 9% Other Indo-European 2% Tagalog/Filipino 1%
Political lean MEDSL · Riverside
- 2024 margin
- Toss-up / Even · D 48.0% · R 49.3% · Other 2.6%
- 2008→2024 swing
- -3.6pp toward R · 2008: 2.3pp · 2024: -1.3pp
- All cycles
- 2024: R+1.3 2020: D+8.0 2016: D+4.3 2012: R+0.4 2008: D+2.3
Not yet ingested
- Civics
- —
Market trends
- HPI YoY
- ▼ -166.92%
- Current HPI
- 233.4619
- Rent YoY
- ▼ -0.30%
- Metro
- Riverside-San Bernardino-Ontario, CA
- State GDP YoY
- ▲ 3.21%
- F500 in state
- 116
Industry mix (Fortune 500 HQ in CA)
| Industry | F500 HQs | Revenue |
|---|---|---|
| Technology | 27 | $1,492B |
|
||
| Financial Services | 3 | $174B |
|
||
| Retail | 3 | $44B |
|
||
| Insurance | 3 | $26B |
|
||
| Media / Entertainment | 2 | $115B |
|
||
| Pharmaceuticals / Biotech | 2 | $62B |
|
||
Price history
+168.4% since first listed28 events — show timeline
- 2026-04-09 Price Changed $679,000 GPSMLS
- 2026-03-03 Listed $699,000 GPSMLS
- 2026-03-01 Listing Removed — GPSMLS
- 2026-02-22 Price Changed $699,000 GPSMLS
- 2026-01-24 Price Changed $717,700 GPSMLS
- 2025-11-06 Price Changed $729,000 GPSMLS
- 2025-10-06 Listing Removed — GPSMLS
- 2025-10-06 Listed $737,700 GPSMLS
- 2025-07-22 Price Changed $749,900 GPSMLS
- 2025-07-18 Price Changed $785,000 GPSMLS
- 2025-06-20 Listed $800,000 GPSMLS
- 2011-06-24 Sold (MLS) $280,000 GPSMLS
- 2011-05-26 Listing Removed — GPSMLS
- 2011-03-31 Price Changed $314,900 GPSMLS
- 2011-03-01 Price Changed $329,500 GPSMLS
- 2011-01-26 Listed $349,500 GPSMLS
- 2008-03-28 Sold (Public Records) $425,000 Public Records
- 2008-03-18 Listing Removed — GPSMLS
- 2008-02-08 Price Changed $449,000 GPSMLS
- 2008-02-01 Price Changed $469,000 GPSMLS
- 2008-01-19 Listed $495,000 GPSMLS
- 2007-09-06 Delisted — PALM
- 2006-12-01 Listed — PALM
- 2006-11-29 Listing Removed — GPSMLS
- 2006-03-28 Listed $554,000 GPSMLS
- 2004-01-07 Listing Removed — GPSMLS
- 2003-08-18 Listed $379,000 GPSMLS
- 1992-03-23 Sold (Public Records) $253,000 Public Records
Property tax history
+0.6%/yrLatest (2025): $5,399 · +2.8% YoY. Source: county tax records.
Cash-flow waterfall
monthlySold comps — $/sqft
last 12 mo · ≤1 miLoading sold comps…