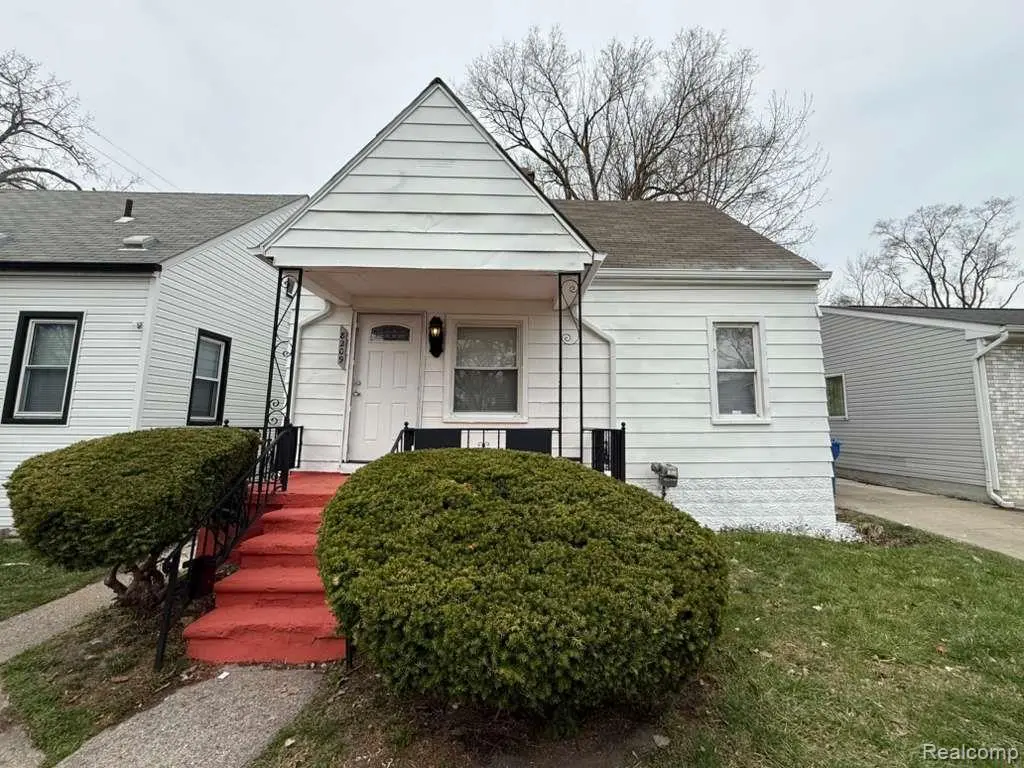
8209 Orchard Ave · Warren, MI
Flood risk 4/10 · Minor
- FEMA flood zone
- X (unshaded)
- Chance of flooding over 30 yrs
- 0.22%
- Est. flood insurance / yr
- $507 – $1,088
Fire risk 1/10 · Minimal
- Est. fire insurance / yr
- $784 – $1,456
Heat risk 3/10 · Minor
- Hot days now (above 97°F)
- 7 days/yr
- Hot days in 30 yrs
- 14 days/yr
Wind risk 1/10 · Minimal
- Chance of severe wind over 30 yrs
- —
Air-quality risk 3/10 · Minor
- Unhealthy air days now
- 3 days/yr
- Unhealthy air days in 30 yrs
- 4 days/yr
Risk factors via First Street. Map © Google.
Why this score? — see what drove the B grade
The composite is a weighted blend of 9 inputs, each scored 0–100. Each bar is that input's sub-score; the figure is the points it added to the 100-point composite (weight × sub-score).
- Cash flow +30.0/30.0
- ARV discount +13.3/15.0
- 1% rule +10.0/10.0
- DSCR +10.0/10.0
- Livability +3.7/5.0
- Rent growth +3.2/5.0
- Condition / age +2.5/5.0
- Schools +1.0/10.0
- Appreciation +0.0/10.0
$94,900
🖨 Deal sheet 📄 Offer letter ✓ Due diligence
Listing remarks MLS
Welcome to this cozy and well-maintained 4-bedroom bungalow located in the desirable South Warren neighborhood! This charming home offers a warm and inviting layout, perfect for both first-time homebuyers and savvy investors. Featuring spacious bedrooms, a comfortable living area, and plenty of natural light throughout, the property provides a great balance of functionality and comfort. The home has been well cared for, making it move-in ready with plenty of potential to add your own personal touches. Whether you're looking for an affordable place to call home or a solid investment opportunity, this property checks all the boxes - with rental potential of around $1,300 per month. Don't miss your chance to own a versatile property in a prime location - whether you're looking to settle in or generate steady rental income, this opportunity won't last long!
Key facts
- 3,485 sq ft lot
- Built 1920
- Listed 31 days
Neighborhood map
What this means for you Summary
Snapshot
- This is a 4-bed/1.0-bath single-family listed at $95k.
Deal economics
- At list price, monthly cash flow is $596 ($7k/yr) — positive.
- The deal already cash-flows at list — no discount required.
- Meets the 1% rule at list price ($2k rent vs $95k).
- Recommended offer: $92k (3.0% below list) — sets the bar for market timing.
- Cap rate 13.8% vs local median 5.3% in Warren — top-decile yield for the area; either an underpriced asset or a hidden risk that comps aren't pricing in. Stress-test before assuming the spread holds.
Location & tenants
- Location reads 74/100 on livability (#171 in MI, #4,491 nationally) — a middle-class / working-renter tenant base. Strengths: commute A+, cost of living A+, housing A+; Watch: schools D, amenities D, employment D.
- Van Dyke Public Schools (urban): math 7% / reading 19% proficiency, ranked #512 of 540 in MI (top 95%) — low school quality limits family demand, transient renter base, plan for 1-2y turnover; 80% free/reduced lunch — lower-income household profile, screen leases tightly.
- Market conditions: Rents rising (+2.9%/yr); 160 active listings in the ZIP; 1,321 units permitted in Macomb County in 2024 (86 in 5+ unit buildings).
- This rent runs 37% of the median local income ($52k/yr) — at the standard rent-burdened threshold; future hikes will face affordability resistance.
Forward outlook
- Local home prices are declining (-3.0%/yr); year-one equity from $656 of loan paydown is wiped out by about $3k of value loss. Plan a longer hold.
- Macomb County population projected at +9% by 2050 — modest demand growth; plan on rents tracking national, not racing it.
- At projected returns (-3.0% appreciation + 2.9% rent growth), your $27k cash investment doubles in ~5 years — after that, you're playing with house money.
Negotiation context
- It's been on market 31 days — a 3% lower offer ($92k) is reasonable based on typical stale-listing flexibility.
- 3 sale attempts with the ask held roughly flat each time — persistent listings suggest the price (not the market) is what's stuck; bring a comps-based counter.
- Current owner paid $34k; list at $95k implies a 179% gain — meaningful room to come down on a strong offer.
Risks & watch-outs
- Watch-outs: built in 1920 — expect roof / HVAC / electrical / plumbing capex.
Questions for the listing agent
- It's been on market 31 days. Have you received any prior offers? Is the seller open to a 3% concession, seller financing, or rate buy-down credit?
- Built in 1920 — when were the roof, HVAC, electrical panel, plumbing, and water heater last replaced?
- Is there a deadline driving the sale (1031 exchange, divorce, estate, relocation)? That informs how much negotiation room exists.
- Schools are D-rated, which usually means shorter tenancies and higher turnover. Who's the typical renter profile here, and what's been the actual vacancy rate?
- Crime grade is D in this area — have there been break-ins, vandalism, or insurance claims at this property in the last 3 years? What carrier currently insures it and at what premium?
- What's the average days-on-market for RENTAL listings here right now (not sales)? A rising rental-DOM trend means longer vacancies and softer asking-rent achievability than the comps imply.
- What's the recent tenant-quality profile in this submarket — average credit score on applications, eviction rate, late-payment / NSF rate, and stable-employment percentage? A property-management company in the area should have these aggregated.
- How much new for-sale + rental construction is in the pipeline within 1–3 miles? Heavy new supply typically softens prices + rents 12–24 months out; constrained supply supports both.
Investment metrics
- 1% rule
- 1.70% ✓
- Cap rate
- 13.84%
- Cash-on-cash
- 26.94%
- DSCR
- 2.20
- GRM
- 4.9
CMA / ARV
- ARV (median comp)
- $108,929
- List price
- $94,900
- Delta
- -12.88%
- Verdict
- UNDERPRICED
- Comps
- 20 within 1.0 mi
Show comp detail 12 sales within ~0.75 mi
| Address | Dist | Beds/Ba | Sqft | Sold | Price | $/sf | Match |
|---|---|---|---|---|---|---|---|
| 8701 Toepfer Rd | 0.32mi | 3/1.0 (-1) | 720 (0%) | 3mo | $80,000 | $111 | 78 |
| 8284 Dodge Ave | 0.49mi | 3/1.0 (-1) | 740 (+3%) | 2mo | $100,000 | $135 | 66 |
| 8302 Studebaker Ave | 0.15mi | 3/1.0 (-1) | 786 (+9%) | 12mo | $70,950 | $90 | 63 |
| 7034 Yacht Ave | 0.53mi | 3/1.0 (-1) | 732 (+2%) | 10mo | $119,000 | $163 | 59 |
| 20225 Terrel St | 0.67mi | 3/1.0 (-1) | 757 (+5%) | 4mo | $43,000 | $57 | 52 |
| 11052 Studebaker Ave | 0.44mi | 3/1.0 (-1) | 694 (-4%) | 21mo | $134,000 | $193 | 51 |
| 21367 Mac Arthur Blvd | 0.24mi | 3/1.0 (-1) | 814 (+13%) | 14mo | $133,000 | $163 | 50 |
| 11417 Sherman Ave | 0.72mi | 3/1.0 (-1) | 714 (-1%) | 12mo | $93,000 | $130 | 50 |
| 8405 Jackson Ave | 0.35mi | 3/2.0 (-1) | 816 (+13%) | 6mo | $65,304 | $80 | 47 |
| 20220 Bramford St | 0.67mi | 3/1.0 (-1) | 789 (+10%) | 9mo | $130,000 | $165 | 40 |
| 20248 Terrell St | 0.64mi | 3/1.0 (-1) | 789 (+10%) | 15mo | $55,000 | $70 | 36 |
| 8693 Paige Ave | 0.69mi | 3/1.0 (-1) | 813 (+13%) | 20mo | $145,000 | $178 | 24 |
Match score weights: distance 35% · size 25% · config 20% · recency 20%. Top-matched comps best support the ARV.
Projected returns pro-forma
-3.0% appreciation · 2.94% rent growth · sell at horizon
- IRR
- 20.8%
- Equity multiple
- 1.85×
- Total profit
- $22,552
- Equity at exit
- $14,150
- IRR
- 28.9%
- Equity multiple
- 3.57×
- Total profit
- $68,305
- Equity at exit
- $8,205
Cash invested: $26,572 (down + closing). Projections, not guarantees.
Landlord ↔ Tenant lean methodology
- Overall (STATE)
- 62 Landlord-Friendly
- State Michigan
- 62 Landlord-Friendly · EVEN
- County
- — inherits STATE
- City
- — inherits STATE
ZIP-level market 48089
- Rents YoY
- 2.9%
- Active inventory
- 160
- Price-to-rent
- 4.9×
Monthly cashflow live
- Estimated rent
- $1,609 medium interval (Pro) →
- Mortgage (P&I)
- −$498
- Tax from tax record
- −$138 /mo · $1,650/yr
- Insurance
- −$40
- HOA
- −$0
- Vacancy / Maint / Mgmt
- −$338
- Net cashflow
- $596
Break-even live
UW: 25.0% down · 7.5% · 30yr · 1.5% tax · 5.0% vac · 8.0% maint · 8.0% mgmt
Financing live
Cash to close
- Down payment
- $23,725
- Closing costs
- $2,847
- Reserves months
- —
- Total cash needed
- —
Loan-product check · same deal, 3 products live
Conventional
25% down · 7.5% · 30yr
- Down + closing
- —
- Monthly P&I
- —
- Monthly cashflow
- —
- DSCR
- —
- Eligible?
- —
Personal DTI + credit; lowest rate.
DSCR
20% down · 8.5% · 30yr
- Down + closing
- —
- Monthly P&I
- —
- Monthly cashflow
- —
- DSCR
- —
- Eligible?
- —
No personal income docs; deal must DSCR.
Hard money
10% down · 12.0% · 12mo
- Down + closing
- —
- Monthly P&I
- —
- Monthly cashflow
- —
- DSCR
- —
- Eligible?
- —
Short-term bridge; refi at stabilization.
Listing history 7 events
-
2026-05-06status Pending 865-char remark
Show marketing remark (885 chars)
Welcome to this cozy and well-maintained 4-bedroom bungalow located in the desirable South Warren neighborhood! This charming home offers a warm and inviting layout, perfect for both first-time homebuyers and savvy investors. Featuring spacious bedrooms, a comfortable living area, and plenty of natural light throughout, the property provides a great balance of functionality and comfort. The home has been well cared for, making it move-in ready with plenty of potential to add your own personal touches. Whether you're looking for an affordable place to call home or a solid investment opportunity, this property checks all the boxes—with rental potential of around $1,300 per month. Don’t miss your chance to own a versatile property in a prime location—whether you're looking to settle in or generate steady rental income, this opportunity won’t last long!
-
2026-05-06status Pending 885-char remark
Show marketing remark (885 chars)
Welcome to this cozy and well-maintained 4-bedroom bungalow located in the desirable South Warren neighborhood! This charming home offers a warm and inviting layout, perfect for both first-time homebuyers and savvy investors. Featuring spacious bedrooms, a comfortable living area, and plenty of natural light throughout, the property provides a great balance of functionality and comfort. The home has been well cared for, making it move-in ready with plenty of potential to add your own personal touches. Whether you're looking for an affordable place to call home or a solid investment opportunity, this property checks all the boxes—with rental potential of around $1,300 per month. Don’t miss your chance to own a versatile property in a prime location—whether you're looking to settle in or generate steady rental income, this opportunity won’t last long!
-
2026-04-05$94,900 Active 885-char remark
Show marketing remark (865 chars)
Welcome to this cozy and well-maintained 4-bedroom bungalow located in the desirable South Warren neighborhood! This charming home offers a warm and inviting layout, perfect for both first-time homebuyers and savvy investors. Featuring spacious bedrooms, a comfortable living area, and plenty of natural light throughout, the property provides a great balance of functionality and comfort. The home has been well cared for, making it move-in ready with plenty of potential to add your own personal touches. Whether you're looking for an affordable place to call home or a solid investment opportunity, this property checks all the boxes - with rental potential of around $1,300 per month. Don't miss your chance to own a versatile property in a prime location - whether you're looking to settle in or generate steady rental income, this opportunity won't last long!
-
2026-04-05$94,900 Active 865-char remark
Show marketing remark (865 chars)
Welcome to this cozy and well-maintained 4-bedroom bungalow located in the desirable South Warren neighborhood! This charming home offers a warm and inviting layout, perfect for both first-time homebuyers and savvy investors. Featuring spacious bedrooms, a comfortable living area, and plenty of natural light throughout, the property provides a great balance of functionality and comfort. The home has been well cared for, making it move-in ready with plenty of potential to add your own personal touches. Whether you're looking for an affordable place to call home or a solid investment opportunity, this property checks all the boxes - with rental potential of around $1,300 per month. Don't miss your chance to own a versatile property in a prime location - whether you're looking to settle in or generate steady rental income, this opportunity won't last long!
-
2025-09-28historical $1,100
-
2025-09-15$1,100
-
2022-03-16soldstatus $34,000
ⓘ Source: listings_history table (triggers on properties + properties_extension) + one-shot
backfill from property_details.listing_events for pre-trigger history.
Tax reassessment forecast MI · Partial reset (capped growth)
- Current annual tax
- $1,650 · $138/mo
- Projected year-2 tax
- $1,650 · $138/mo
- Expected delta
- $0/yr ($0/mo · 0.0%)
ⓘ Screening estimate from a state-policy table — verify with the county assessor before closing.
Climate risk First Street
- Flood 4/10 Moderate FEMA zone X (unshaded) · 22% chance over 30 yrs
- Wildfire 1/10 Low
- Heat 3/10 Moderate 7 d/yr ≥97°F today · 14 d/yr by 30 yrs out
- Wind 1/10 Low
- Air quality 3/10 Moderate 3 unhealthy d/yr today · 4 by 30 yrs out
Nearby sold comps map
Loading sold comps map…
Walkable amenities ~0.75 mi
Loading nearby amenities…
Taxation est. · year 1
- Rental income
- $19,309
- − Mortgage interest
- −$5,316
- − Property taxes
- −$1,650
- − Insurance
- −$474
- − Repairs & maintenance
- −$1,545
- − Management
- −$1,545
- − Depreciation
- −$2,761
- Taxable income
- $6,019
- Est. tax owed @ 24.0%
- −$1,445
- After-tax cash flow
- $5,713/yr
For passive investors: Depreciation is non-cash, so a rental often shows a tax loss while cash-flowing — sheltering income. Rental losses are passive: they offset passive income freely, and up to $25,000/yr can offset ordinary (W-2) income if you actively participate and your MAGI is under $100k (phasing out to $0 by $150k); unused losses carry forward. On sale, claimed depreciation is recaptured at up to 25%, and gains may owe capital-gains tax (a 1031 exchange can defer both). Figures are a year-1 estimate at your 24.0% rate — not tax advice; consult a CPA.
Schools (NCES district)
- District
- Van Dyke Public Schools
- NCES district ID
- 2634680
- Math proficiency
- 7% ▼ -11.00%
- Reading proficiency
- 19% ▼ -5.00%
- Median HH income
- $33,231
- Composite
- 10.46/100
- National rank
- #9784
- State rank
- #512 of 540 in MI
Livability — Warren
- Score
- 74/100
- State rank
- #171
- US rank
- #4491
Category grades
Schools grade is shown separately in the Schools card above.
Census & demographics
- Census place
- Warren, MI
- County
- Macomb County · 638,552 people
- City population
- 114,937
- Metro
- Detroit-Warren-Dearborn, MI
- Population (ZIP)
- 31,853
- Household income
- $52,366
- Rent vs Own
- Severe rent burden
- 1754.0
Population outlook (Macomb County) Hauer SSP2
- Today (2025)
- 925,296 people
- By 2030
- 948,226 · +2.5%
- By 2040
- 983,961 · +6.3%
- By 2050
- 1,010,200 · +9.2%
- By 2075
- 1,076,222 · +16.3%
- By 2100
- 1,077,065 · +16.4%
Race, ethnicity, and origin ACS 2023
- Neighborhood character
- Diverse neighborhood (Simpson 0.61)
- Race & ethnicity
- White 53% Black 31% Asian 7% Two or more races 6% Hispanic / Latino 3%
- Common ancestry
- Romanian 11% Lithuanian 3% Slovak 2%
- Foreign-born
- 5% · Canada
- Languages at home
- 92% English-only · Other Asian/Pacific 3% Other Indo-European 2% Arabic 1%
Political lean MEDSL · Macomb
- 2024 margin
- R (+13.7) · D 42.2% · R 55.9% · Other 1.9%
- 2008→2024 swing
- -22.3pp toward R · 2008: 8.6pp · 2024: -13.7pp
- All cycles
- 2024: R+13.7 2020: R+8.1 2016: R+11.6 2012: D+4.0 2008: D+8.6
Not yet ingested
- Civics
- —
Market trends
- HPI YoY
- ▼ -211.46%
- Current HPI
- 154.8325
- Rent YoY
- ▲ 2.94%
- Metro
- Detroit-Warren-Dearborn, MI
- State GDP YoY
- ▲ 1.37%
- F500 in state
- 28
Industry mix (Fortune 500 HQ in MI)
| Industry | F500 HQs | Revenue |
|---|---|---|
| Automotive Parts | 3 | $48B |
|
||
| Automotive | 2 | $372B |
|
||
| Chemicals | 1 | $45B |
|
||
| Automotive Retail | 1 | $29B |
|
||
| Healthcare / Medical Devices | 1 | $23B |
|
||
| Automotive Technology | 1 | $20B |
|
||
Price history
+179.1% since first listed7 events — show timeline
- 2026-05-06 Pending — MiRealSource-MiMLS
- 2026-05-06 Pending — REALCOMP
- 2026-04-05 Listed $94,900 REALCOMP
- 2026-04-05 Listed $94,900 MiRealSource-MiMLS
- 2025-09-28 Rental Removed $1,100 REALSOURCE
- 2025-09-15 Listed for Rent $1,100 REALSOURCE
- 2022-03-16 Sold (Public Records) $34,000 Public Records
Property tax history
+8.5%/yrLatest (2025): $1,650 · +2.6% YoY. Source: county tax records.
Cash-flow waterfall
monthlySold comps — $/sqft
last 12 mo · ≤1 miLoading sold comps…