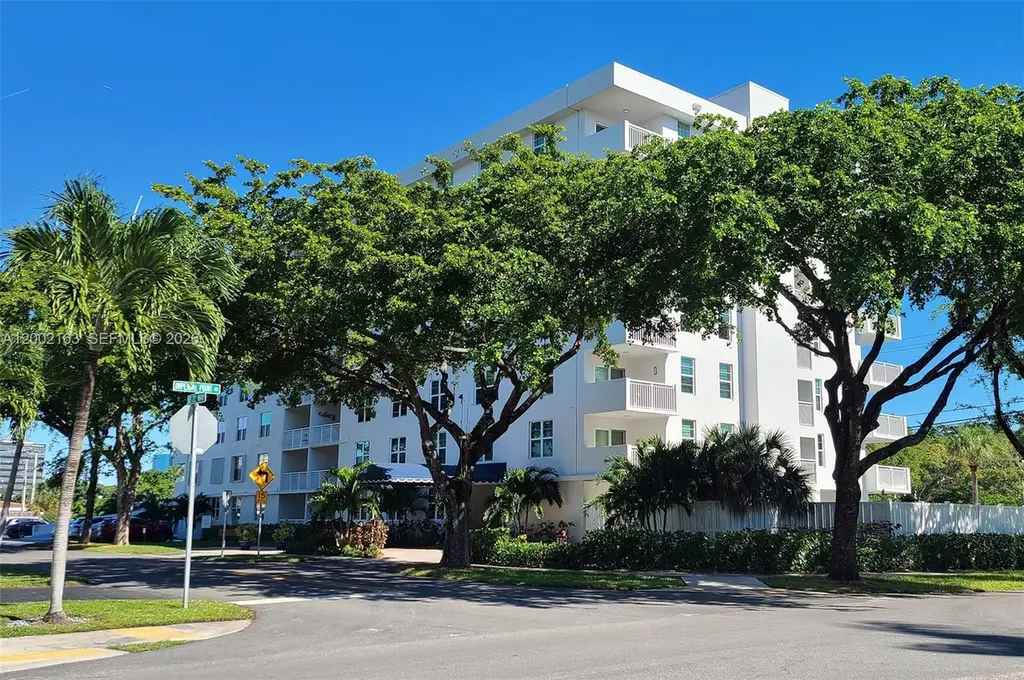
6000 NE 22nd Way Unit 7D · Fort Lauderdale, FL
Flood risk No data
- FEMA flood zone
- —
- Chance of flooding over 30 yrs
- —
- Est. flood insurance / yr
- —
Fire risk No data
- Est. fire insurance / yr
- —
Heat risk No data
- Hot days now (above threshold)
- —
- Hot days in 30 yrs
- —
Wind risk No data
- Chance of severe wind over 30 yrs
- —
Air-quality risk No data
- Unhealthy air days now
- —
- Unhealthy air days in 30 yrs
- —
Risk factors via First Street. Map © Google.
Why this score? — see what drove the B grade
The composite is a weighted blend of 9 inputs, each scored 0–100. Each bar is that input's sub-score; the figure is the points it added to the 100-point composite (weight × sub-score).
- Cash flow +30.0/30.0
- 1% rule +10.0/10.0
- DSCR +10.0/10.0
- ARV discount +7.5/15.0
- Schools +4.1/10.0
- Livability +4.1/5.0
- Rent growth +3.4/5.0
- Condition / age +2.5/5.0
- Appreciation +0.0/10.0
$177,000
🖨 Deal sheet (PDF) 📄 Offer letter ✓ Due diligence
Listing remarks MLS
TOTALLY UPGRADED NEW CARPET NEW VANITY TOP DISHWASHER SHOWER DOOR KITCHEN DINNING AREA HALL NEW SINK DISPOSAL.
Key facts
- New elevators
- Meeting room
- Pool
Tags
Property features AI
Finance
- Other: 54 units in community; Pets: conditional; restrictions or possible restrictions
- Financial info: Association fee amount: $603 monthly
- HOA & community: Monthly association fee; Association amenities: laundry, storage, vehicle wash area, elevators; Association fee covers: management, common areas, electricity, insurance, laundry, legal/accounting, grounds maintenance, structure maintenance, parking, pool(s), reserves, roof, sewer, trash, water
Exterior
- Parking: One covered space; 1-car garage
- Security: Closed-circuit cameras; Intercom; Lobby secured; Phone entry; Smoke detectors
- Utilities: Electric power; Public water; Public sewer
- Home design: Condo/attached property; 7-story building; Entry on 7th floor
- Construction: Block construction; Effective year built
- Exterior features: Balcony (open); Security/high-impact doors
Interior
- Kitchen: Dishwasher; Electric range; Microwave; Garbage disposal; Refrigerator
- Bedrooms: Bedroom on main level
- Flooring: Carpet
- Bathrooms: 1 full bathroom
- Heating & cooling: Electric heating; Electric cooling
- Interior features: Impact glass windows; First floor entry; Elevator
- Laundry & utility: Common area laundry; Electric water heater
Neighborhood map
What this means for you Summary
Snapshot
- This is a 1-bed/1.0-bath condo listed at $177k.
Deal economics
- At list price, monthly cash flow is $784 ($9k/yr) — positive.
- The deal already cash-flows at list — no discount required.
- Meets the 1% rule at list price ($3k rent vs $177k).
- Recommended offer: $172k (3.0% below list) — sets the bar for market timing.
- Cap rate 11.6% vs local median 2.2% in Fort Lauderdale — top-decile yield for the area; either an underpriced asset or a hidden risk that comps aren't pricing in. Stress-test before assuming the spread holds.
Location & tenants
- Location reads 82/100 on livability (#78 in FL, #1,293 nationally) — a professional / high-income tenant draw. Strengths: crime A+, amenities A+, health & safety A+; Watch: cost of living D-.
- Broward (suburban): math 42% / reading 53% proficiency, ranked #46 of 73 in FL (top 63%) — families likely to look elsewhere, expect single-tenant / working-renter base with shorter leases.
- Market conditions: Rents rising (+3.6%/yr); 746 active listings in the ZIP; 32 comparable units currently listed for rent nearby; rentals at typical pace (median 22d on market — plan ~3-4 weeks tenant-placement turnaround); solid renter incomes; 2,111 units permitted in Broward County in 2024 (1,265 in 5+ unit buildings).
- This rent runs 40% of the median local income ($94k/yr) — at the standard rent-burdened threshold; future hikes will face affordability resistance.
Forward outlook
- Local home prices are declining (-3.0%/yr); year-one equity from $1k of loan paydown is wiped out by about $5k of value loss. Plan a longer hold.
- Broward County population projected at +34% by 2050 — long-run rental-demand tailwind backs the buy-and-hold thesis.
- At projected returns (-3.0% appreciation + 3.6% rent growth), your $50k cash investment doubles in ~7 years — after that, you're playing with house money.
Negotiation context
- It's been on market 60 days — a 3% lower offer ($172k) is reasonable based on typical stale-listing flexibility.
- 2 sale attempts since 24y ago; this cycle's ask has dropped $22k (11%) from the opening price — seller is motivated, your offer sets the floor, not the list.
- Current owner paid $105k; list at $177k implies a 69% gain — meaningful room to come down on a strong offer.
Questions for the listing agent
- It's been on market 60 days. Have you received any prior offers? Is the seller open to a 3% concession, seller financing, or rate buy-down credit?
- Built in 1976 — when were the roof, HVAC, electrical panel, plumbing, and water heater last replaced?
- What does the HOA fee cover, when was the last increase, and are there any pending special assessments or reserve-fund shortfalls?
- Any open or pending special assessments — roof, HVAC, plumbing, elevator, façade? What's the per-unit balance and payoff schedule, and is the seller paying it off at close or rolling it to the buyer?
- Is there a deadline driving the sale (1031 exchange, divorce, estate, relocation)? That informs how much negotiation room exists.
- Schools are B-rated — typically a magnet for longer-tenancy family renters. What's the average tenant stay here, and is there a school-zone premium baked into asking?
- What's the average days-on-market for RENTAL listings here right now (not sales)? A rising rental-DOM trend means longer vacancies and softer asking-rent achievability than the comps imply.
- What's the recent tenant-quality profile in this submarket — average credit score on applications, eviction rate, late-payment / NSF rate, and stable-employment percentage? A property-management company in the area should have these aggregated.
- How much new apartment / multifamily construction is in the pipeline within 1–3 miles? Heavy new supply (>2% of stock underway) typically softens rents 12–24 months out; light construction supports rent growth.
Investment metrics
- 1% rule
- 1.75% ✓
- Cap rate
- 11.61%
- Cash-on-cash
- 18.97%
- DSCR
- 1.84
- GRM
- 4.8
CMA / ARV
No comps found within radius.
Projected returns pro-forma
-3.0% appreciation · 3.63% rent growth · sell at horizon
- IRR
- 11.8%
- Equity multiple
- 1.47×
- Total profit
- $23,515
- Equity at exit
- $26,391
- IRR
- 21.5%
- Equity multiple
- 2.90×
- Total profit
- $94,229
- Equity at exit
- $15,304
Cash invested: $49,560 (down + closing). Projections, not guarantees.
Landlord ↔ Tenant lean methodology
- Overall (STATE)
- 87 Strongly Landlord-Friendly
- State Florida
- 87 Strongly Landlord-Friendly · R+3
- County
- — inherits STATE
- City
- — inherits STATE
ZIP-level market 33308
- Rents YoY
- 3.6%
- Active inventory
- 746
- Price-to-rent
- 4.8×
Monthly cashflow live
- Estimated rent
- $3,095 high interval (Pro) →
- Mortgage (P&I)
- −$928
- Tax from tax record
- −$57 /mo · $683/yr
- Insurance
- −$74
- HOA
- −$603
- Vacancy / Maint / Mgmt
- −$650
- Net cashflow
- $784
Break-even live
Sensitivity live
| Price | -10% $884 | -5% $834 | +0% $784 | +5% $733 | +10% $683 |
|---|---|---|---|---|---|
| Rent | -10% $539 | -5% $661 | +0% $784 | +5% $906 | +10% $1,028 |
| Rate | -1.0pp $873 | -0.5pp $829 | base $784 | +0.5pp $738 | +1.0pp $691 |
UW: 25.0% down · 7.5% · 30yr · 1.5% tax · 5.0% vac · 8.0% maint · 8.0% mgmt
Financing live
Cash to close
- Down payment
- $44,250
- Closing costs
- $5,310
- Reserves months
- —
- Total cash needed
- —
Loan-product check · same deal, 3 products live
Conventional
25% down · 7.5% · 30yr
- Down + closing
- —
- Monthly P&I
- —
- Monthly cashflow
- —
- DSCR
- —
- Eligible?
- —
Personal DTI + credit; lowest rate.
DSCR
20% down · 8.5% · 30yr
- Down + closing
- —
- Monthly P&I
- —
- Monthly cashflow
- —
- DSCR
- —
- Eligible?
- —
No personal income docs; deal must DSCR.
Hard money
10% down · 12.0% · 12mo
- Down + closing
- —
- Monthly P&I
- —
- Monthly cashflow
- —
- DSCR
- —
- Eligible?
- —
Short-term bridge; refi at stabilization.
Rent comps 32 comps
| Address | Beds | Baths | Sqft | Rent | $/sqft | DOM | Units | Dist |
|---|---|---|---|---|---|---|---|---|
| 2400 NE 65th St Fort Lauderdale, FL | 1.0–3.0 | 1.0–2.0 | 1103 | $2,282 | $2.07 | 0d | 15 | 0.37mi |
| 1631 S Federal Hwy Pompano Beach, FL | 1.0–3.0 | 1.0–2.0 | 1092 | $2,268 | $2.08 | 0d | 16 | 0.50mi |
| 3333 Port Royale Dr S Fort Lauderdale, FL | 3.0 | 1.0–2.0 | 857 | $2,776 | $3.24 | 0d | 43 | 0.82mi |
| 5100 N Ocean Blvd #502 Lauderdale by the Sea, FL | 1.0 | 1.5 | 1080 | $3,400 | $3.15 | 25d | 1 | 0.96mi |
| 5000 N Ocean Blvd #506 Lauderdale by the Sea, FL | 1.0 | 1.5 | 1080 | $3,900 | $3.61 | 25d | 1 | 0.99mi |
| 4512 Sea Grape Dr Unit 1 Lauderdale-By-The-Sea, FL | 1.0 | 1.0 | 853 | $3,500 | $4.10 | 25d | 1 | 0.99mi |
| 4900 N Ocean Blvd #1601 Lauderdale by the Sea, FL | 1.0 | 1.5 | 1000 | $4,000 | $4.00 | 25d | 1 | 0.99mi |
| 4900 N Ocean Blvd #1209 Lauderdale by the Sea, FL | 1.0 | 2.0 | 960 | $4,100 | $4.27 | 16d | 1 | 0.99mi |
| 6000 N Ocean Blvd Unit 1D Lauderdale by the Sea, FL | 2.0 | 2.0 | 904 | $3,200 | $3.54 | 23d | 1 | 0.99mi |
| 6000 N Ocean Blvd Lauderdale by the Sea, FL | 2.0 | 2.0 | 904 | $3,350 | $3.71 | 0d | 2 | 1.02mi |
| 2000 S Ocean Blvd Pompano Beach, FL | 1.0–2.0 | 1.5–2.0 | 1070 | $3,400 | $3.18 | 21d | 3 | 1.03mi |
| 2000 S Ocean Blvd Pompano Beach, FL | 1.0–2.0 | 1.5–2.0 | 1070 | $3,200 | $2.99 | 17d | 4 | 1.03mi |
| 2000 S Ocean Blvd Pompano Beach, FL | 1.0–2.0 | 1.5–2.0 | 1000 | $3,200 | $3.20 | 3d | 3 | 1.03mi |
| 4800 Bayview Dr #303 Fort Lauderdale, FL | 2.0 | 2.0 | 1032 | $3,500 | $3.39 | 25d | 1 | 1.03mi |
| 1900 S Ocean Blvd Pompano Beach, FL | 2.0 | 2.0 | 1165 | $3,750 | $3.22 | 21d | 3 | 1.03mi |
| 1900 S Ocean Blvd Pompano Beach, FL | 2.0 | 2.0 | 1165 | $3,800 | $3.26 | 8d | 2 | 1.03mi |
| 160 SE 12th St Pompano Beach, FL | 2.0 | 2.0 | 950 | $5,390 | $5.67 | 25d | 1 | 1.05mi |
| 4564 El Mar Dr #4 Lauderdale by the Sea, FL | 1.0 | 1.0 | 566 | $3,500 | $6.18 | 18d | 1 | 1.10mi |
| 1541 S Ocean Blvd Pompano Beach, FL | 1.0 | 1.5 | 850 | $3,575 | $4.21 | 25d | 2 | 1.10mi |
| 1750 S Ocean Blvd Unit 509E Pompano Beach, FL | 2.0 | 2.0 | 945 | $4,200 | $4.44 | 25d | 1 | 1.12mi |
| 1501 S Ocean Blvd #307 Pompano Beach, FL | 2.0 | 2.0 | 1000 | $3,750 | $3.75 | 25d | 1 | 1.14mi |
| 1620 S Ocean Blvd Unit 5M Pompano Beach, FL | 1.0 | 2.0 | 1116 | $5,000 | $4.48 | 25d | 1 | 1.17mi |
| 1461 S Ocean Blvd Pompano Beach, FL | 2.0 | 2.0 | 920 | $3,525 | $3.83 | 6d | 2 | 1.23mi |
| 801 S Federal Hwy #21 Pompano Beach, FL | 2.0 | 2.0 | 1070 | $3,100 | $2.90 | 4d | 1 | 1.24mi |
| 1500 S Ocean Blvd #508 Pompano Beach, FL | 2.0 | 2.0 | 1070 | $3,200 | $2.99 | 3d | 1 | 1.24mi |
| 1500 S Ocean Blvd Pompano Beach, FL | 2.0 | 1.5–2.0 | 985 | $4,000 | $4.06 | 16d | 2 | 1.27mi |
| 1421 S Ocean Blvd #503 Pompano Beach, FL | 2.0 | 2.0 | 1100 | $3,750 | $3.41 | 25d | 1 | 1.34mi |
| 1156 SW 4th Ave Pompano Beach, FL | 2.0 | 1.0 | 945 | $3,300 | $3.49 | 6d | 1 | 1.38mi |
| 777 S Federal Hwy Pompano Beach, FL | 2.0 | 2.0 | 1166 | $2,825 | $2.42 | 4d | 3 | 1.41mi |
| 777 S Federal Hwy Pompano Beach, FL | 1.0–2.0 | 1.0–2.0 | 947 | $1,690 | $1.78 | 16d | 6 | 1.41mi |
| 777 S Federal Hwy Pompano Beach, FL | 1.0–2.0 | 1.0–2.0 | 947 | $1,700 | $1.79 | 25d | 6 | 1.41mi |
| 4144 El Mar Dr Unit 1 Lauderdale-By-The-Sea, FL | 2.0 | 2.0 | 1116 | $3,250 | $2.91 | 25d | 1 | 1.49mi |
HOA detail condo
- Monthly dues
- $603 · $7,236/yr
- Assessments
- None detected in remarks — confirm with the listing agent.
Listing history 24 events
-
2026-06-21days on market $177,000 Active 60 DOM
-
2026-06-18days on market $177,000 Active 57 DOM
-
2026-06-17days on market $177,000 Active 56 DOM
-
2026-06-16days on market $177,000 Active 55 DOM
-
2026-06-15days on market $177,000 Active 54 DOM
-
2026-06-13days on market $177,000 Active 52 DOM
-
2026-06-09days on market $177,000 Active 48 DOM
-
2026-06-08days on market $177,000 Active 47 DOM
-
2026-06-07days on market $177,000 Active 46 DOM
-
2026-06-04days on market $177,000 Active 43 DOM
-
2026-06-03days on market $177,000 Active 42 DOM
-
2026-06-02days on market $177,000 Active 41 DOM
-
2026-06-02price $177,000 Active 40 DOM
-
2026-06-01days on market $187,000 Active 40 DOM
-
2026-05-31days on market $187,000 Active 39 DOM
-
2026-05-04price $187,000
-
2026-04-22$199,000 Active
-
2004-04-27soldstatus $105,000
-
2003-02-05soldstatus $78,000
-
2003-01-10soldstatus $78,000 110-char remark
Show marketing remark (110 chars)
TOTALLY UPGRADED NEW CARPET NEW VANITY TOP DISHWASHER SHOWER DOOR KITCHEN DINNING AREA HALL NEW SINK DISPOSAL.
-
2002-11-20historical 110-char remark
Show marketing remark (110 chars)
TOTALLY UPGRADED NEW CARPET NEW VANITY TOP DISHWASHER SHOWER DOOR KITCHEN DINNING AREA HALL NEW SINK DISPOSAL.
-
2002-10-12$84,900 110-char remark
Show marketing remark (110 chars)
TOTALLY UPGRADED NEW CARPET NEW VANITY TOP DISHWASHER SHOWER DOOR KITCHEN DINNING AREA HALL NEW SINK DISPOSAL.
-
1999-06-16soldstatus $44,500
-
1977-09-01soldstatus $31,000
ⓘ Source: listings_history table (triggers on properties + properties_extension) + one-shot
backfill from property_details.listing_events for pre-trigger history.
Tax reassessment forecast FL · Resets to sale price
- Current annual tax
- $683 · $57/mo
- Projected year-2 tax
- $1,469 · $122/mo
- Expected delta
- +$786/yr (+$66/mo · 115.2%)
ⓘ Screening estimate from a state-policy table — verify with the county assessor before closing.
Nearby sold comps map
Loading sold comps map…
Walkable amenities ~0.75 mi
Loading nearby amenities…
Taxation est. · year 1
- Rental income
- $37,145
- − Mortgage interest
- −$9,915
- − Property taxes
- −$683
- − Insurance
- −$885
- − Repairs & maintenance
- −$2,972
- − Management
- −$2,972
- − HOA
- −$7,236
- − Depreciation
- −$5,149
- Taxable income
- $7,335
- Est. tax owed @ 24.0%
- −$1,760
- After-tax cash flow
- $7,642/yr
For passive investors: Depreciation is non-cash, so a rental often shows a tax loss while cash-flowing — sheltering income. Rental losses are passive: they offset passive income freely, and up to $25,000/yr can offset ordinary (W-2) income if you actively participate and your MAGI is under $100k (phasing out to $0 by $150k); unused losses carry forward. On sale, claimed depreciation is recaptured at up to 25%, and gains may owe capital-gains tax (a 1031 exchange can defer both). Figures are a year-1 estimate at your 24.0% rate — not tax advice; consult a CPA.
Schools (NCES district)
- District
- Broward
- NCES district ID
- 1200180
- Math proficiency
- 42% ▼ -18.00%
- Reading proficiency
- 53% ▼ -5.00%
- Median HH income
- $52,139
- Composite
- 40.88/100
- National rank
- #3621
- State rank
- #46 of 73 in FL
Livability — Fort Lauderdale
- Score
- 82/100
- State rank
- #78
- US rank
- #1293
Category grades
Schools grade is shown separately in the Schools card above.
Census & demographics
- Census place
- Fort Lauderdale, FL
- County
- Broward County · 1,963,430 people
- City population
- 235,769
- Metro
- Miami-Fort Lauderdale-Pompano Beach, FL
- Population (ZIP)
- 27,935
- Household income
- $93,879
- Rent vs Own
- Severe rent burden
- 912.0
Population outlook (Broward County) Hauer SSP2
- Today (2025)
- 2,207,033 people
- By 2030
- 2,360,704 · +7.0%
- By 2040
- 2,661,208 · +20.6%
- By 2050
- 2,946,698 · +33.5%
- By 2075
- 3,602,273 · +63.2%
- By 2100
- 3,970,984 · +79.9%
Race, ethnicity, and origin ACS 2023
- Neighborhood character
- Predominantly White (75%)
- Race & ethnicity
- White 75% Hispanic / Latino 16% Two or more races 14% Asian 3% Black 2%
- Hispanic origin (detail)
- Puerto Rican 2% Cuban 3%
- Common ancestry
- Romanian 4% Lithuanian 3% Scotch-Irish 3%
- Foreign-born
- 24% · Canada, Jamaica, Dominican Republic
- Languages at home
- 75% English-only · Spanish 14% Other Indo-European 5% Russian/Polish/Slavic 2%
Political lean MEDSL · Broward
- 2024 margin
- D (+17.0) · D 58.0% · R 41.0%
- 2008→2024 swing
- -17.8pp toward R · 2008: 34.7pp · 2024: 17.0pp
- All cycles
- 2024: D+17.0 2020: D+29.8 2016: D+35.0 2012: D+34.9 2008: D+34.7
Not yet ingested
- Civics
- —
Market trends
- HPI YoY
- ▼ -417.95%
- Current HPI
- 325.3902
- Rent YoY
- ▲ 3.63%
- Metro
- Miami-Fort Lauderdale-Pompano Beach, FL
- State GDP YoY
- ▲ 3.28%
- F500 in state
- 36
Industry mix (Fortune 500 HQ in FL)
| Industry | F500 HQs | Revenue |
|---|---|---|
| Industrial Technology | 2 | $29B |
|
||
| Insurance | 2 | $17B |
|
||
| Retail | 1 | $60B |
|
||
| Technology Distribution | 1 | $58B |
|
||
| Homebuilding | 1 | $35B |
|
||
| Technology Manufacturing | 1 | $35B |
|
||
Price history
+503.2% since first listed9 events — show timeline
- 2026-05-04 Price Changed $187,000 MARMLS
- 2026-04-22 Listed $199,000 MARMLS
- 2004-04-27 Sold (Public Records) $105,000 Public Records
- 2003-02-05 Sold (Public Records) $78,000 Public Records
- 2003-01-10 Sold (MLS) $78,000 Beaches MLS
- 2002-11-20 Listing Removed — Beaches MLS
- 2002-10-12 Listed $84,900 Beaches MLS
- 1999-06-16 Sold (Public Records) $44,500 Public Records
- 1977-09-01 Sold (Public Records) $31,000 Public Records
Property tax history
+4.4%/yrLatest (2025): $683 · +16.1% YoY. Source: county tax records.
Cash-flow waterfall
monthlySold comps — $/sqft
last 12 mo · ≤1 miLoading sold comps…