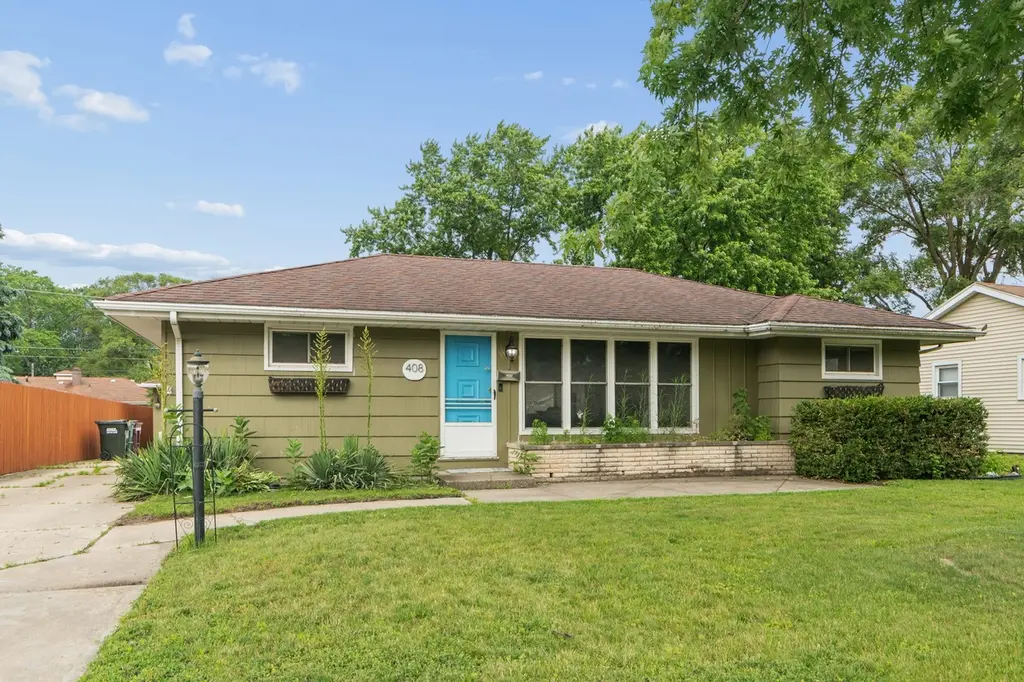
408 Water St · Thornton, IL
Flood risk 1/10 · Minimal
- FEMA flood zone
- X (unshaded)
- Chance of flooding over 30 yrs
- 0.0%
- Est. flood insurance / yr
- $473 – $860
Fire risk 3/10 · Minor
- Est. fire insurance / yr
- $804 – $1,492
Heat risk 3/10 · Minor
- Hot days now (above 102°F)
- 7 days/yr
- Hot days in 30 yrs
- 15 days/yr
Wind risk 2/10 · Minimal
- Chance of severe wind over 30 yrs
- 0.0%
Air-quality risk 4/10 · Minor
- Unhealthy air days now
- 4 days/yr
- Unhealthy air days in 30 yrs
- 5 days/yr
Risk factors via First Street. Map © Google.
Why this score? — see what drove the B- grade
The composite is a weighted blend of 9 inputs, each scored 0–100. Each bar is that input's sub-score; the figure is the points it added to the 100-point composite (weight × sub-score).
- Cash flow +30.0/30.0
- 1% rule +10.0/10.0
- DSCR +10.0/10.0
- ARV discount +5.6/15.0
- Livability +3.8/5.0
- Rent growth +2.5/5.0
- Condition / age +2.5/5.0
- Schools +0.7/10.0
- Appreciation +0.0/10.0
$195,000
🖨 Deal sheet 📄 Offer letter ✓ Due diligence
Listing remarks MLS
SPACIOUS FRAME 1 STORY HOME FEATURING 3 BEDROOMS, 2 BATHS, FAMILY ROOM WITH STONE FIREPLACE, DINING ROOM, 2 CAR DETACHED GARAGE AND A MUD ROOM.
Key facts
- Large family room
- Brick fireplace
- Open floorplan
Tags
Property features AI
Finance
- Other: Possession at closing or immediate
- HOA & community: No master association fees required
Exterior
- Parking: Detached garage (garage owned) with garage door opener; Two total parking spaces (including 2 garage spaces)
- Utilities: Public water; Public sewer
- Home design: Detached single-family home; One story; Fee simple ownership; Built before 1978
- Construction: Brick and frame construction; Asphalt roof; Estimated age 71–80 years
- Exterior features: Lot approximately 61 x 123; Less than 1/4 acre lot; School bus service and commuter train access
Interior
- Kitchen: Range; Microwave; Dishwasher; Refrigerator; Kitchen on main level (13 x 9)
- Bedrooms: Master bedroom on main level (12 x 12); Bedroom 2 on main level (12 x 11); Bedroom 3 on main level (11 x 10)
- Flooring: Carpet in living areas and bedrooms; Other flooring in work room
- Bathrooms: Two full bathrooms
- Heating & cooling: Natural gas forced-air heating; Central air conditioning
- Interior features: First-floor bedroom; Built-in features; Crawl space basement; L-shaped dining area; Eight total rooms; One fireplace in the family room
- Laundry & utility: Main-level laundry (7 x 6); Gas dryer hookup
Neighborhood map
What this means for you Summary
Snapshot
- This is a 4-bed/2.0-bath single-family listed at $195k.
Deal economics
- At list price, monthly cash flow is $1k ($13k/yr) — positive.
- The deal already cash-flows at list — no discount required.
- Meets the 1% rule at list price ($3k rent vs $195k).
Location & tenants
- Location reads 76/100 on livability (#183 in IL, #3,517 nationally) — a middle-class / working-renter tenant base. Strengths: commute A+, cost of living A+, housing A+; Watch: health & safety D+, schools F, amenities F.
- Thornton Twp Hsd 205 (suburban): math 7% / reading 8% proficiency, ranked #594 of 620 in IL (top 96%) — low school quality limits family demand, transient renter base, plan for 1-2y turnover.
- Market conditions: 11 active listings in the ZIP; 2 comparable units currently listed for rent nearby; 6,272 units permitted in Cook County in 2024 (4,658 in 5+ unit buildings).
Forward outlook
- Local home prices are declining (-3.0%/yr); year-one equity from $1k of loan paydown is wiped out by about $6k of value loss. Plan a longer hold.
- At projected returns (-3.0% appreciation + 3.0% rent growth), your $55k cash investment doubles in ~6 years — after that, you're playing with house money.
Negotiation context
- Only 1 days on market — expect competitive offers; lowballing is unlikely to land.
- 2 sale attempts since 12y ago with the ask held roughly flat each time — persistent listings suggest the price (not the market) is what's stuck; bring a comps-based counter.
- Current owner paid $54k; list at $195k implies a 261% gain — meaningful room to come down on a strong offer.
Risks & watch-outs
- Watch-outs: built in 1954 — expect roof / HVAC / electrical / plumbing capex.
Questions for the listing agent
- Built in 1954 — when were the roof, HVAC, electrical panel, plumbing, and water heater last replaced?
- Is there a deadline driving the sale (1031 exchange, divorce, estate, relocation)? That informs how much negotiation room exists.
- Schools are F-rated, which usually means shorter tenancies and higher turnover. Who's the typical renter profile here, and what's been the actual vacancy rate?
- What's the average days-on-market for RENTAL listings here right now (not sales)? A rising rental-DOM trend means longer vacancies and softer asking-rent achievability than the comps imply.
- What's the recent tenant-quality profile in this submarket — average credit score on applications, eviction rate, late-payment / NSF rate, and stable-employment percentage? A property-management company in the area should have these aggregated.
- How much new for-sale + rental construction is in the pipeline within 1–3 miles? Heavy new supply typically softens prices + rents 12–24 months out; constrained supply supports both.
Investment metrics
- 1% rule
- 1.51% ✓
- Cap rate
- 12.71%
- Cash-on-cash
- 22.93%
- DSCR
- 2.02
- GRM
- 5.5
CMA / ARV
- ARV (on-the-fly)
- $187,044
- Comps found
- 12
Show comp detail 12 sales within ~0.75 mi
| Address | Dist | Beds/Ba | Sqft | Sold | Price | $/sf | Match |
|---|---|---|---|---|---|---|---|
| 920 Sunnyside Ave | 0.38mi | 4/1.0 | 1,393 (-2%) | 4mo | $173,000 | $124 | 73 |
| 43 Blackhawk Dr | 0.24mi | 3/2.0 (-1) | 1,400 (-1%) | 14mo | $207,000 | $148 | 70 |
| 59 Indianwood Dr | 0.38mi | 4/2.0 | 1,506 (+6%) | 5mo | $190,000 | $126 | 67 |
| 315 Blackstone St | 0.09mi | 3/2.0 (-1) | 1,259 (-11%) | 11mo | $125,000 | $99 | 63 |
| 64 Indianwood Dr | 0.42mi | 4/2.0 | 1,513 (+7%) | 9mo | $170,500 | $113 | 62 |
| 113 N Hunter St | 0.29mi | 3/2.0 (-1) | 1,204 (-15%) | 0mo | $180,000 | $150 | 56 |
| 17164 Louis Ave | 0.72mi | 5/2.5 (+1) | 1,438 (+2%) | 2mo | $190,000 | $132 | 56 |
| 116 Cora Ct | 0.30mi | 3/1.5 (-1) | 1,323 (-7%) | 16mo | $141,000 | $107 | 54 |
| 921 Highland Ave | 0.40mi | 3/1.5 (-1) | 1,499 (+6%) | 13mo | $205,000 | $137 | 54 |
| 86 Indianwood Dr | 0.34mi | 3/2.0 (-1) | 1,300 (-8%) | 15mo | $210,000 | $162 | 53 |
| 107 N Kinzie St | 0.28mi | 3/1.5 (-1) | 1,269 (-10%) | 17mo | $182,000 | $143 | 48 |
| 304 S Hunter St | 0.51mi | 3/1.0 (-1) | 1,248 (-12%) | 13mo | $127,900 | $102 | 36 |
Match score weights: distance 35% · size 25% · config 20% · recency 20%. Top-matched comps best support the ARV.
Projected returns pro-forma
-3.0% appreciation · 3.0% rent growth · sell at horizon
- IRR
- 15.9%
- Equity multiple
- 1.64×
- Total profit
- $34,850
- Equity at exit
- $29,075
- IRR
- 24.5%
- Equity multiple
- 3.12×
- Total profit
- $115,931
- Equity at exit
- $16,860
Cash invested: $54,600 (down + closing). Projections, not guarantees.
Landlord ↔ Tenant lean methodology
- Overall (STATE)
- 43 Moderately Tenant-Leaning
- State Illinois
- 43 Moderately Tenant-Leaning · D+7
- County
- — inherits STATE
- City
- — inherits STATE
ZIP-level market 60476
- Home prices YoY
- -20.4%
- Active inventory
- 11
- Price-to-rent
- 5.5×
Monthly cashflow live
- Estimated rent
- $2,950 medium interval (Pro) →
- Mortgage (P&I)
- −$1,023
- Tax from tax record
- −$183 /mo · $2,202/yr
- Insurance
- −$81
- HOA
- −$0
- Vacancy / Maint / Mgmt
- −$620
- Net cashflow
- $1,043
Break-even live
UW: 25.0% down · 7.5% · 30yr · 1.5% tax · 5.0% vac · 8.0% maint · 8.0% mgmt
Financing live
Cash to close
- Down payment
- $48,750
- Closing costs
- $5,850
- Reserves months
- —
- Total cash needed
- —
Loan-product check · same deal, 3 products live
Conventional
25% down · 7.5% · 30yr
- Down + closing
- —
- Monthly P&I
- —
- Monthly cashflow
- —
- DSCR
- —
- Eligible?
- —
Personal DTI + credit; lowest rate.
DSCR
20% down · 8.5% · 30yr
- Down + closing
- —
- Monthly P&I
- —
- Monthly cashflow
- —
- DSCR
- —
- Eligible?
- —
No personal income docs; deal must DSCR.
Hard money
10% down · 12.0% · 12mo
- Down + closing
- —
- Monthly P&I
- —
- Monthly cashflow
- —
- DSCR
- —
- Eligible?
- —
Short-term bridge; refi at stabilization.
Rent comps 2 comps
| Address | Beds | Baths | Sqft | Rent | $/sqft | DOM | Units | Dist |
|---|---|---|---|---|---|---|---|---|
| 705 W Fitzhenry Ct Glenwood, IL | 3.0 | 2.0 | 1700 | $2,950 | $1.74 | 24d | 1 | 1.49mi |
| 705 W Fitzhenry Ct Glenwood, IL | 3.0 | 2.0 | 1600 | $2,950 | $1.84 | 20d | 1 | 1.49mi |
Listing history 2 events
-
2026-06-18remarks 699-char remark
-
2026-06-18$195,000 Active 1 DOM
ⓘ Source: listings_history table (triggers on properties + properties_extension) + one-shot
backfill from property_details.listing_events for pre-trigger history.
Tax reassessment forecast IL · Partial reset (capped growth)
- Current annual tax
- $2,202 · $183/mo
- Projected year-2 tax
- $3,314 · $276/mo
- Expected delta
- +$1,112/yr (+$93/mo · 50.5%)
ⓘ Screening estimate from a state-policy table — verify with the county assessor before closing.
Climate risk First Street
- Flood 1/10 Low FEMA zone X (unshaded) · 0% chance over 30 yrs
- Wildfire 3/10 Moderate
- Heat 3/10 Moderate 7 d/yr ≥102°F today · 15 d/yr by 30 yrs out
- Wind 2/10 Low 0% chance of damaging wind over 30 yrs
- Air quality 4/10 Moderate 4 unhealthy d/yr today · 5 by 30 yrs out
Nearby sold comps map
Loading sold comps map…
Walkable amenities ~0.75 mi
Loading nearby amenities…
Taxation est. · year 1
- Rental income
- $35,400
- − Mortgage interest
- −$10,923
- − Property taxes
- −$2,202
- − Insurance
- −$975
- − Repairs & maintenance
- −$2,832
- − Management
- −$2,832
- − Depreciation
- −$5,673
- Taxable income
- $9,964
- Est. tax owed @ 24.0%
- −$2,391
- After-tax cash flow
- $10,127/yr
For passive investors: Depreciation is non-cash, so a rental often shows a tax loss while cash-flowing — sheltering income. Rental losses are passive: they offset passive income freely, and up to $25,000/yr can offset ordinary (W-2) income if you actively participate and your MAGI is under $100k (phasing out to $0 by $150k); unused losses carry forward. On sale, claimed depreciation is recaptured at up to 25%, and gains may owe capital-gains tax (a 1031 exchange can defer both). Figures are a year-1 estimate at your 24.0% rate — not tax advice; consult a CPA.
Schools (NCES district)
- District
- Thornton Twp Hsd 205
- NCES district ID
- 1738970
- Math proficiency
- 7% ▬ 0.00%
- Reading proficiency
- 8% ▼ -2.00%
- Median HH income
- $43,392
- Composite
- 6.92/100
- National rank
- #9976
- State rank
- #594 of 620 in IL
Livability — Thornton
- Score
- 76/100
- State rank
- #183
- US rank
- #3517
Category grades
Schools grade is shown separately in the Schools card above.
Census & demographics
- Census place
- Thornton, IL
- Population (ZIP)
- 1,876
Population outlook (Cook County) Hauer SSP2
- Today (2025)
- 5,347,519 people
- By 2030
- 5,357,703 · +0.2%
- By 2040
- 5,324,924 · -0.4%
- By 2050
- 5,230,762 · -2.2%
- By 2075
- 4,785,735 · -10.5%
- By 2100
- 4,188,836 · -21.7%
Race, ethnicity, and origin ACS 2023
- Neighborhood character
- Diverse neighborhood (Simpson 0.65)
- Race & ethnicity
- White 43% Black 35% Hispanic / Latino 20% Two or more races 3%
- Hispanic origin (detail)
- Mexican 19%
- Common ancestry
- Romanian 8% Iranian 3% Portuguese 1%
- Foreign-born
- 4% · Canada, Jamaica
- Languages at home
- 82% English-only · Spanish 16% Other Indo-European 1%
Political lean MEDSL · Cook
- 2024 margin
- Solid D (+42.0) · D 70.4% · R 28.4% · Other 1.2%
- 2008→2024 swing
- -11.4pp toward R · 2008: 53.4pp · 2024: 42.0pp
- All cycles
- 2024: D+42.0 2020: D+50.3 2016: D+53.0 2012: D+49.4 2008: D+53.4
Not yet ingested
- Civics
- —
Market trends
- HPI YoY
- ▼ -49.92%
- Current HPI
- 194.3119
- Rent YoY
- —
- Metro
- —
- State GDP YoY
- ▲ 1.59%
- F500 in state
- 60
Industry mix (Fortune 500 HQ in IL)
| Industry | F500 HQs | Revenue |
|---|---|---|
| Insurance | 4 | $201B |
|
||
| Consumer Goods | 4 | $87B |
|
||
| Industrial Machinery | 3 | $64B |
|
||
| Healthcare | 2 | $55B |
|
||
| Retail / Pharmacy | 1 | $148B |
|
||
| Agriculture / Food | 1 | $86B |
|
||
Price history
+261.1% since first listed4 events — show timeline
- 2026-06-18 Listed $195,000 MRED as Distributed by MLS Grid
- 2014-07-21 Sold (MLS) $54,000 MRED as Distributed by MLS Grid
- 2014-05-29 Pending — MRED as Distributed by MLS Grid
- 2014-05-16 Listed $54,000 MRED as Distributed by MLS Grid
Property tax history
+3.2%/yrLatest (2023): $2,202 · -34.6% YoY. Source: county tax records.
Cash-flow waterfall
monthlySold comps — $/sqft
last 12 mo · ≤1 miLoading sold comps…