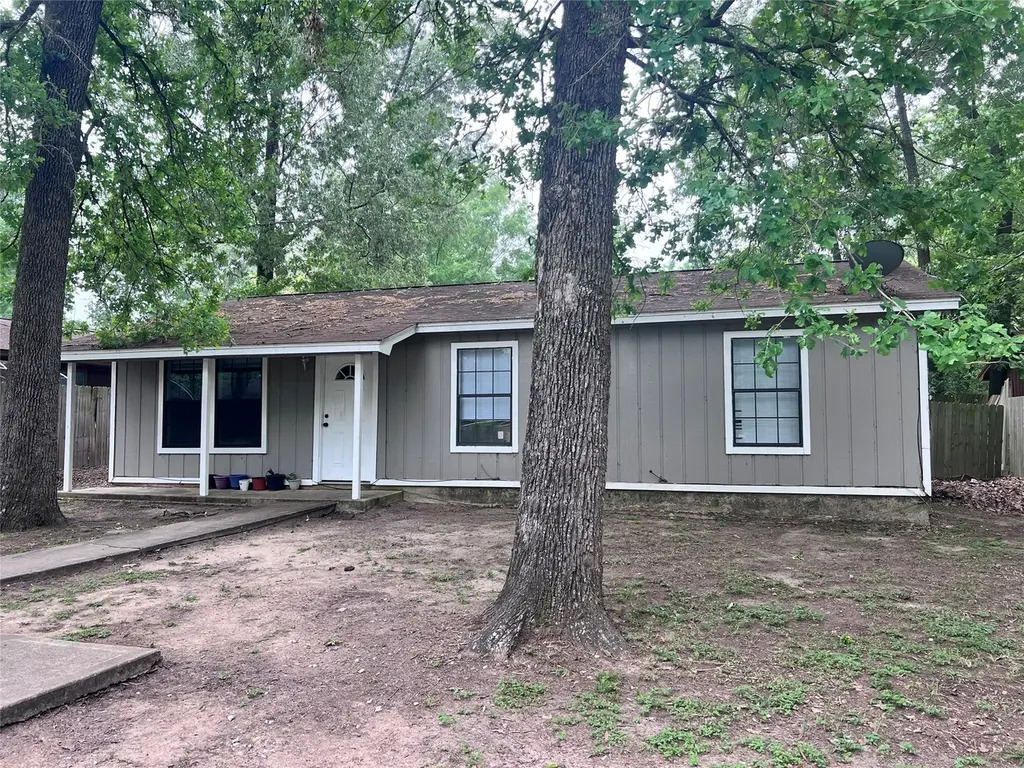
444 Stevens Ln · West Livingston, TX
Flood risk 1/10 · Minimal
- FEMA flood zone
- X (unshaded)
- Chance of flooding over 30 yrs
- 0.0%
- Est. flood insurance / yr
- $507 – $1,088
Fire risk 3/10 · Minor
- Est. fire insurance / yr
- $1,222 – $2,270
Heat risk 8/10 · Major
- Hot days now (above 112°F)
- 7 days/yr
- Hot days in 30 yrs
- 24 days/yr
Wind risk 8/10 · Major
- Chance of severe wind over 30 yrs
- 99.0%
Air-quality risk 1/10 · Minimal
- Unhealthy air days now
- 0 days/yr
- Unhealthy air days in 30 yrs
- 0 days/yr
Risk factors via First Street. Map © Google.
Why this score? — see what drove the F grade
The composite is a weighted blend of 9 inputs, each scored 0–100. Each bar is that input's sub-score; the figure is the points it added to the 100-point composite (weight × sub-score).
- Cash flow +11.9/30.0
- 1% rule +3.6/10.0
- DSCR +3.5/10.0
- Schools +3.2/10.0
- Rent growth +2.5/5.0
- Livability +2.5/5.0
- Condition / age +2.5/5.0
- ARV discount +0.0/15.0
- Appreciation +0.0/10.0
$143,000
🖨 Deal sheet 📄 Offer letter ✓ Due diligence
Listing remarks MLS
Charming and move-in ready, this 3-bedroom home offers comfortable living with a functional, open layout. The spacious living, dining, and kitchen area flows seamlessly together—perfect for everyday living or entertaining. With 1,008 square feet, this home features 1 full bath and an additional half bath for added convenience. The kitchen comes equipped with a refrigerator and range, and the washer and dryer are included—making your move even easier. Step outside to enjoy a large, fenced backyard with a covered patio, plenty of space for pets, play, or relaxing evenings. The home’s gray exterior with crisp white trim adds to its welcoming curb appeal. A great opportunity for first-time buyers, downsizers, or investors—don’t miss this one!
Key facts
- Covered patio
- Fenced backyard
- 9,661 sq ft lot
Tags
Neighborhood map
What this means for you Summary
Snapshot
- This is a 2-bed/1.5-bath single-family listed at $143k.
Deal economics
- At list price, monthly cash flow is $-36 ($-427/yr) — negative.
- To cash-flow at today's rent, offer at most $137k (4.4% below list).
- To meet the 1% rule (rent ≥ 1% of price), the offer needs to be $122k (14.4% below list).
- Recommended offer: $122k (14.4% below list) — sets the bar for 1% rule.
- Cap rate 6.0% vs local median 2.5% in West Livingston — top-decile yield for the area; either an underpriced asset or a hidden risk that comps aren't pricing in. Stress-test before assuming the spread holds.
Location & tenants
- Location reads 50/100 on livability (#1,501 in TX) — a working-class tenant base; expect higher turnover. Strengths: cost of living A+, housing A+; Watch: schools F, crime F, amenities F.
- Livingston ISD (rural): math 38% / reading 39% proficiency, ranked #459 of 826 in TX (top 56%) — families likely to look elsewhere, expect single-tenant / working-renter base with shorter leases.
- Market conditions: 1186 active listings in the ZIP; 769 units permitted in Polk County in 2024 (0 in 5+ unit buildings).
Forward outlook
- Local home prices are declining (-3.0%/yr); year-one equity from $989 of loan paydown is wiped out by about $4k of value loss. Plan a longer hold.
- Polk County population projected at +16% by 2050 — long-run rental-demand tailwind backs the buy-and-hold thesis.
Negotiation context
- It's been on market 80 days — a 6% lower offer ($134k) is reasonable based on typical stale-listing flexibility.
- Current owner paid $40k; list at $143k implies a 258% gain — meaningful room to come down on a strong offer.
Risks & watch-outs
- Climate carrying-cost: severe wind risk, 99% chance of damaging wind over 30y; extreme-heat days projected 7→24/yr by 2055 (HVAC capex compounding) — expect insurance premiums to compound above CPI over the hold.
Questions for the listing agent
- What do current leases actually rent for vs. the listed asking? Can we see a recent rent roll and the last 12 months of T-12 income?
- It's been on market 80 days. Have you received any prior offers? Is the seller open to a 14% concession, seller financing, or rate buy-down credit?
- What does the HOA fee cover, when was the last increase, and are there any pending special assessments or reserve-fund shortfalls?
- Why hasn't it sold? Are there any deal-killer items the seller is aware of (foundation, flood, title, zoning, code violations)?
- Is there a deadline driving the sale (1031 exchange, divorce, estate, relocation)? That informs how much negotiation room exists.
- Schools are F-rated, which usually means shorter tenancies and higher turnover. Who's the typical renter profile here, and what's been the actual vacancy rate?
- Crime grade is F in this area — have there been break-ins, vandalism, or insurance claims at this property in the last 3 years? What carrier currently insures it and at what premium?
- The area grade is low — what's the realistic commute time and amenity access for the typical tenant pool here? Any planned neighborhood developments (good or bad) we should know about?
- What's the average days-on-market for RENTAL listings here right now (not sales)? A rising rental-DOM trend means longer vacancies and softer asking-rent achievability than the comps imply.
- What's the recent tenant-quality profile in this submarket — average credit score on applications, eviction rate, late-payment / NSF rate, and stable-employment percentage? A property-management company in the area should have these aggregated.
- How much new for-sale + rental construction is in the pipeline within 1–3 miles? Heavy new supply typically softens prices + rents 12–24 months out; constrained supply supports both.
Investment metrics
- 1% rule
- 0.86% ✗
- Cap rate
- 5.99%
- Cash-on-cash
- -1.07%
- DSCR
- 0.95
- GRM
- 9.7
CMA / ARV
- ARV (median comp)
- $119,773
- List price
- $143,000
- Delta
- 19.39%
- Verdict
- OVERPRICED
- Comps
- 20 within 1.0 mi
Show comp detail 8 sales within ~0.75 mi
| Address | Dist | Beds/Ba | Sqft | Sold | Price | $/sf | Match |
|---|---|---|---|---|---|---|---|
| 3661 Fm 3277 | 0.44mi | 2/1.0 | 993 (-2%) | 7mo | $99,900 | $101 | 69 |
| 139 Bay Haven Blvd | 0.47mi | 3/1.0 (+1) | 1,056 (+5%) | 6mo | $220,000 | $208 | 58 |
| 328 W Sherwood Dr | 0.43mi | 3/1.0 (+1) | 1,064 (+6%) | 7mo | $85,000 | $80 | 58 |
| 202 New Cove Dr | 0.18mi | 3/2.0 (+1) | 1,140 (+13%) | 12mo | $174,999 | $154 | 53 |
| 131 S Rollingrock Dr | 0.34mi | 2/2.0 | 1,120 (+11%) | 18mo | $129,900 | $116 | 49 |
| 144 Little John | 0.50mi | 2/1.5 | 944 (-6%) | 20mo | $99,900 | $106 | 49 |
| 136 Bay Side St | 0.59mi | 3/1.5 (+1) | 1,056 (+5%) | 23mo | $579,000 | $548 | 41 |
| 300 Bay Haven Blvd | 0.59mi | 3/2.0 (+1) | 1,131 (+12%) | 6mo | $90,000 | $80 | 40 |
Match score weights: distance 35% · size 25% · config 20% · recency 20%. Top-matched comps best support the ARV.
Projected returns pro-forma
-3.0% appreciation · 3.0% rent growth · sell at horizon
- IRR
- -18.0%
- Equity multiple
- 0.37×
- Total profit
- $-25,409
- Equity at exit
- $21,322
- IRR
- -10.2%
- Equity multiple
- 0.38×
- Total profit
- $-24,932
- Equity at exit
- $12,364
Cash invested: $40,040 (down + closing). Projections, not guarantees.
Landlord ↔ Tenant lean methodology
- Overall (STATE)
- 87 Strongly Landlord-Friendly
- State Texas
- 87 Strongly Landlord-Friendly · R+5
- County
- — inherits STATE
- City
- — inherits STATE
ZIP-level market 77351
- Home prices YoY
- -14.8%
- Active inventory
- 1186
- Price-to-rent
- 9.7×
Monthly cashflow live
- Estimated rent
- $1,224 medium interval (Pro) →
- Mortgage (P&I)
- −$750
- Tax from tax record
- −$185 /mo · $2,218/yr
- Insurance
- −$60
- HOA
- −$8
- Vacancy / Maint / Mgmt
- −$257
- Net cashflow
- $-36
Break-even live
UW: 25.0% down · 7.5% · 30yr · 1.5% tax · 5.0% vac · 8.0% maint · 8.0% mgmt
Financing live
Cash to close
- Down payment
- $35,750
- Closing costs
- $4,290
- Reserves months
- —
- Total cash needed
- —
Loan-product check · same deal, 3 products live
Conventional
25% down · 7.5% · 30yr
- Down + closing
- —
- Monthly P&I
- —
- Monthly cashflow
- —
- DSCR
- —
- Eligible?
- —
Personal DTI + credit; lowest rate.
DSCR
20% down · 8.5% · 30yr
- Down + closing
- —
- Monthly P&I
- —
- Monthly cashflow
- —
- DSCR
- —
- Eligible?
- —
No personal income docs; deal must DSCR.
Hard money
10% down · 12.0% · 12mo
- Down + closing
- —
- Monthly P&I
- —
- Monthly cashflow
- —
- DSCR
- —
- Eligible?
- —
Short-term bridge; refi at stabilization.
HOA detail
- Monthly dues
- $8 · $96/yr
Listing history 18 events
-
2026-06-18days on market $143,000 Active 80 DOM
-
2026-06-17days on market $143,000 Active 79 DOM
-
2026-06-16days on market $143,000 Active 78 DOM
-
2026-06-15days on market $143,000 Active 77 DOM
-
2026-06-10days on market $143,000 Active 71 DOM
-
2026-06-08days on market $143,000 Active 70 DOM
-
2026-06-07days on market $143,000 Active 69 DOM
-
2026-06-04days on market $143,000 Active 66 DOM
-
2026-06-03days on market $143,000 Active 65 DOM
-
2026-06-02days on market $143,000 Active 64 DOM
-
2026-06-01days on market $143,000 Active 63 DOM
-
2026-05-31days on market $143,000 Active 62 DOM
-
2026-05-08price $143,000 787-char remark
Show marketing remark (787 chars)
Charming and move-in ready, this 3-bedroom home offers comfortable living with a functional, open layout. The spacious living, dining, and kitchen area flows seamlessly together—perfect for everyday living or entertaining. With 1,008 square feet, this home features 1 full bath and an additional half bath for added convenience. The kitchen comes equipped with a refrigerator and range, and the washer and dryer are included—making your move even easier. Step outside to enjoy a large, fenced backyard with a covered patio, plenty of space for pets, play, or relaxing evenings. The home’s gray exterior with crisp white trim adds to its welcoming curb appeal. A great opportunity for first-time buyers, downsizers, or investors—don’t miss this one!
-
2026-04-15price $148,000 787-char remark
Show marketing remark (787 chars)
Charming and move-in ready, this 3-bedroom home offers comfortable living with a functional, open layout. The spacious living, dining, and kitchen area flows seamlessly together—perfect for everyday living or entertaining. With 1,008 square feet, this home features 1 full bath and an additional half bath for added convenience. The kitchen comes equipped with a refrigerator and range, and the washer and dryer are included—making your move even easier. Step outside to enjoy a large, fenced backyard with a covered patio, plenty of space for pets, play, or relaxing evenings. The home’s gray exterior with crisp white trim adds to its welcoming curb appeal. A great opportunity for first-time buyers, downsizers, or investors—don’t miss this one!
-
2026-03-30$152,000 Active 787-char remark
Show marketing remark (787 chars)
Charming and move-in ready, this 3-bedroom home offers comfortable living with a functional, open layout. The spacious living, dining, and kitchen area flows seamlessly together—perfect for everyday living or entertaining. With 1,008 square feet, this home features 1 full bath and an additional half bath for added convenience. The kitchen comes equipped with a refrigerator and range, and the washer and dryer are included—making your move even easier. Step outside to enjoy a large, fenced backyard with a covered patio, plenty of space for pets, play, or relaxing evenings. The home’s gray exterior with crisp white trim adds to its welcoming curb appeal. A great opportunity for first-time buyers, downsizers, or investors—don’t miss this one!
-
2023-06-06soldstatus
-
2021-12-06soldstatus
-
2003-04-10soldstatus $40,000
ⓘ Source: listings_history table (triggers on properties + properties_extension) + one-shot
backfill from property_details.listing_events for pre-trigger history.
Tax reassessment forecast TX · Resets to sale price
- Current annual tax
- $2,218 · $185/mo
- Projected year-2 tax
- $2,617 · $218/mo
- Expected delta
- +$399/yr (+$33/mo · 18.0%)
ⓘ Screening estimate from a state-policy table — verify with the county assessor before closing.
Climate risk First Street
- Flood 1/10 Low FEMA zone X (unshaded) · 0% chance over 30 yrs
- Wildfire 3/10 Moderate
- Heat 8/10 Severe 7 d/yr ≥112°F today · 24 d/yr by 30 yrs out
- Wind 8/10 Severe 99% chance of damaging wind over 30 yrs
- Air quality 1/10 Low 0 unhealthy d/yr today · 0 by 30 yrs out
Nearby sold comps map
Loading sold comps map…
Walkable amenities ~0.75 mi
Loading nearby amenities…
Taxation est. · year 1
- Rental income
- $14,685
- − Mortgage interest
- −$8,010
- − Property taxes
- −$2,218
- − Insurance
- −$715
- − Repairs & maintenance
- −$1,175
- − Management
- −$1,175
- − HOA
- −$96
- − Depreciation
- −$4,160
- Taxable loss
- −$2,864
- Est. tax savings @ 24.0%
- +$687
- After-tax cash flow
- $261/yr
For passive investors: Depreciation is non-cash, so a rental often shows a tax loss while cash-flowing — sheltering income. Rental losses are passive: they offset passive income freely, and up to $25,000/yr can offset ordinary (W-2) income if you actively participate and your MAGI is under $100k (phasing out to $0 by $150k); unused losses carry forward. On sale, claimed depreciation is recaptured at up to 25%, and gains may owe capital-gains tax (a 1031 exchange can defer both). Figures are a year-1 estimate at your 24.0% rate — not tax advice; consult a CPA.
Schools (NCES district)
- District
- Livingston ISD
- NCES district ID
- 4827780
- Math proficiency
- 38% ▼ -1.00%
- Reading proficiency
- 39% ▲ 3.00%
- Median HH income
- $39,531
- Composite
- 32.25/100
- National rank
- #5767
- State rank
- #459 of 826 in TX
Livability — West Livingston
- Score
- 50/100
- State rank
- #1501
- US rank
- #25668
Category grades
Schools grade is shown separately in the Schools card above.
Census & demographics
- County
- Polk County · 37,143 people
- Metro
- nan
- Population (ZIP)
- 37,143
- Household income
- $66,834
- Rent vs Own
- Severe rent burden
- 608.0
Population outlook (Polk County) Hauer SSP2
- Today (2025)
- 51,049 people
- By 2030
- 53,243 · +4.3%
- By 2040
- 56,528 · +10.7%
- By 2050
- 59,243 · +16.1%
- By 2075
- 63,528 · +24.4%
- By 2100
- 60,376 · +18.3%
Race, ethnicity, and origin ACS 2023
- Neighborhood character
- Predominantly White (72%)
- Race & ethnicity
- White 72% Hispanic / Latino 14% Two or more races 9% Black 8% Native American 2%
- Hispanic origin (detail)
- Mexican 11%
- Common ancestry
- Lithuanian 2% Italian 2% Portuguese 2%
- Foreign-born
- 5% · Canada
- Languages at home
- 88% English-only · Spanish 10%
Political lean MEDSL · Polk
- 2024 margin
- Solid R (+58.9) · D 20.2% · R 79.1%
- 2008→2024 swing
- -21.7pp toward R · 2008: -37.2pp · 2024: -58.9pp
- All cycles
- 2024: R+58.9 2020: R+54.5 2016: R+56.5 2012: R+48.2 2008: R+37.2
Not yet ingested
- Civics
- —
Market trends
- HPI YoY
- ▼ -31.11%
- Current HPI
- 178.5316
- Rent YoY
- —
- Metro
- nan
- State GDP YoY
- ▲ 3.95%
- F500 in state
- 110
Industry mix (Fortune 500 HQ in TX)
| Industry | F500 HQs | Revenue |
|---|---|---|
| Energy | 16 | $1,198B |
|
||
| Technology | 5 | $198B |
|
||
| Engineering / Construction | 4 | $72B |
|
||
| Energy Services | 3 | $60B |
|
||
| Utilities | 3 | $41B |
|
||
| Healthcare | 2 | $330B |
|
||
Price history
+257.5% since first listed6 events — show timeline
- 2026-05-08 Price Changed $143,000 HARMLS
- 2026-04-15 Price Changed $148,000 HARMLS
- 2026-03-30 Listed $152,000 HARMLS
- 2023-06-06 Sold (Public Records) — Public Records
- 2021-12-06 Sold (Public Records) — Public Records
- 2003-04-10 Sold (Public Records) $40,000 Public Records
Property tax history
+2.5%/yrLatest (2025): $2,218 · +1.0% YoY. Source: county tax records.
Cash-flow waterfall
monthlySold comps — $/sqft
last 12 mo · ≤1 miLoading sold comps…