210 Texas · DeRidder, LA
Flood risk 1/10 · Minimal
- FEMA flood zone
- X (unshaded)
- Chance of flooding over 30 yrs
- 0.0%
- Est. flood insurance / yr
- $507 – $1,088
Fire risk 2/10 · Minimal
- Est. fire insurance / yr
- $1,269 – $2,357
Heat risk 8/10 · Major
- Hot days now (above 110°F)
- 7 days/yr
- Hot days in 30 yrs
- 20 days/yr
Wind risk 8/10 · Major
- Chance of severe wind over 30 yrs
- 99.0%
Air-quality risk 2/10 · Minimal
- Unhealthy air days now
- 1 days/yr
- Unhealthy air days in 30 yrs
- 1 days/yr
Risk factors via First Street. Map © Google.
Why this score? — see what drove the B- grade
The composite is a weighted blend of 9 inputs, each scored 0–100. Each bar is that input's sub-score; the figure is the points it added to the 100-point composite (weight × sub-score).
- Cash flow +30.0/30.0
- 1% rule +10.0/10.0
- DSCR +10.0/10.0
- ARV discount +7.5/15.0
- Livability +3.6/5.0
- Schools +3.0/10.0
- Rent growth +2.5/5.0
- Condition / age +2.2/5.0
- Appreciation +0.0/10.0
$49,500
🖨 Deal sheet 📄 Offer letter ✓ Due diligence
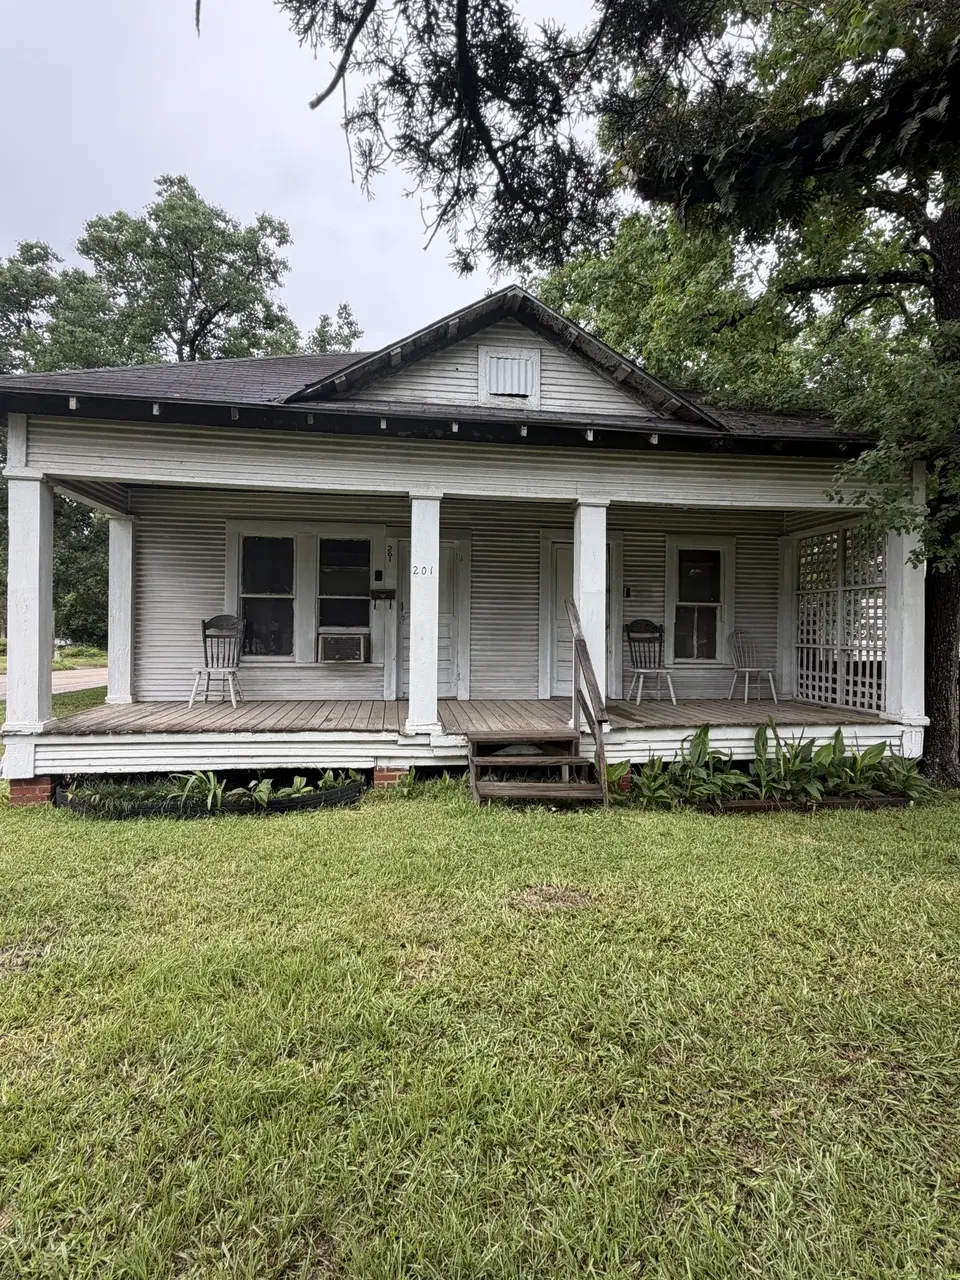
Listing remarks
Calling all investors. This fixer upper is on a great corner lot. Home is sold ''AS IS''.
Key facts
- Corner lot
- 9,148 sq ft lot
- Listed 22 days
Tags
Property features AI
Exterior
- Home design: Single-family residence; One-story
- Exterior features: Corner lot at Texas and Shirley Street; Lot approximately 200 x 43 (0.21 acres)
Interior
- Bathrooms: 1 full bathroom
- Interior features: 6 total rooms
Neighborhood map
What this means for you Summary
Snapshot
- This is a 3-bed/1.0-bath single-family listed at $50k. Condition is rated fair.
Deal economics
- At list price, monthly cash flow is $548 ($7k/yr) — positive.
- The deal already cash-flows at list — no discount required.
- Meets the 1% rule at list price ($1k rent vs $50k).
- Recommended offer: $49k (1.5% below list) — sets the bar for market timing.
- Cap rate 19.6% vs local median 4.8% in DeRidder — top-decile yield for the area; either an underpriced asset or a hidden risk that comps aren't pricing in. Stress-test before assuming the spread holds.
Location & tenants
- Location reads 72/100 on livability (#43 in LA) — a middle-class / working-renter tenant base. Strengths: cost of living A+, housing A+, health & safety A+; Watch: amenities F, commute F, employment D-.
- Beauregard Parish (rural): math 30% / reading 41% proficiency, ranked #32 of 98 in LA (top 33%) — families likely to look elsewhere, expect single-tenant / working-renter base with shorter leases.
- Market conditions: 241 active listings in the ZIP; 2 comparable units currently listed for rent nearby; 83 units permitted in Beauregard Parish in 2024 (0 in 5+ unit buildings).
Forward outlook
- Local home prices are declining (-3.0%/yr); year-one equity from $342 of loan paydown is wiped out by about $1k of value loss. Plan a longer hold.
- At projected returns (-3.0% appreciation + 3.0% rent growth), your $14k cash investment doubles in ~3 years — after that, you're playing with house money.
Negotiation context
- It's been on market 23 days — a 2% lower offer ($49k) is reasonable based on typical stale-listing flexibility.
Risks & watch-outs
- Climate carrying-cost: severe wind risk, 99% chance of damaging wind over 30y; extreme-heat days projected 7→20/yr by 2055 (HVAC capex compounding) — expect insurance premiums to compound above CPI over the hold.
Questions for the listing agent
- Have any recent inspections been done? Can we get a copy of the seller's disclosures and any deferred-maintenance estimates?
- Is there a deadline driving the sale (1031 exchange, divorce, estate, relocation)? That informs how much negotiation room exists.
- Schools are B-rated — typically a magnet for longer-tenancy family renters. What's the average tenant stay here, and is there a school-zone premium baked into asking?
- What's the average days-on-market for RENTAL listings here right now (not sales)? A rising rental-DOM trend means longer vacancies and softer asking-rent achievability than the comps imply.
- What's the recent tenant-quality profile in this submarket — average credit score on applications, eviction rate, late-payment / NSF rate, and stable-employment percentage? A property-management company in the area should have these aggregated.
- How much new for-sale + rental construction is in the pipeline within 1–3 miles? Heavy new supply typically softens prices + rents 12–24 months out; constrained supply supports both.
Investment metrics
- 1% rule
- 2.28% ✓
- Cap rate
- 19.57%
- Cash-on-cash
- 47.42%
- DSCR
- 3.11
- GRM
- 3.7
CMA / ARV
- ARV (on-the-fly)
- $140,812
- Comps found
- 12
Show comp detail 12 sales within ~0.75 mi
| Address | Dist | Beds/Ba | Sqft | Sold | Price | $/sf | Match |
|---|---|---|---|---|---|---|---|
| 501 Stacey Ln | 0.18mi | 3/2.0 | 1,200 (-9%) | 7mo | $169,000 | $141 | 67 |
| 707 Bon Ami St | 0.49mi | 3/2.0 | 1,346 (+2%) | 10mo | $144,000 | $107 | 61 |
| 510 N Texas St | 0.44mi | 3/2.0 | 1,334 (+1%) | 16mo | $44,000 | $33 | 60 |
| 118 S Division St | 0.25mi | 2/2.0 (-1) | 1,410 (+7%) | 11mo | $167,000 | $118 | 59 |
| 1441 Bilbo St | 0.51mi | 3/2.0 | 1,375 (+4%) | 12mo | $159,900 | $116 | 55 |
| 315 Dick Allen St | 0.49mi | 3/2.0 | 1,367 (+4%) | 18mo | $174,000 | $127 | 52 |
| 605 S Royal St | 0.39mi | 2/1.0 (-1) | 1,120 (-15%) | 4mo | $108,000 | $96 | 48 |
| 604 Magnolia St | 0.58mi | 2/1.0 (-1) | 1,339 (+2%) | 21mo | $135,500 | $101 | 48 |
| 315 N Royal St | 0.43mi | 2/1.5 (-1) | 1,188 (-10%) | 13mo | $115,000 | $97 | 46 |
| 212 Dogwood Dr | 0.73mi | 3/2.0 | 1,268 (-4%) | 19mo | $140,000 | $110 | 40 |
| 710 W 8th St | 0.44mi | 3/2.0 | 1,510 (+15%) | 20mo | $152,500 | $101 | 34 |
| 507 Fair St | 0.65mi | 2/2.0 (-1) | 1,189 (-10%) | 17mo | $50,000 | $42 | 30 |
Match score weights: distance 35% · size 25% · config 20% · recency 20%. Top-matched comps best support the ARV.
Projected returns pro-forma
-3.0% appreciation · 3.0% rent growth · sell at horizon
- IRR
- 44.8%
- Equity multiple
- 2.94×
- Total profit
- $26,882
- Equity at exit
- $7,381
- IRR
- 50.7%
- Equity multiple
- 5.94×
- Total profit
- $68,400
- Equity at exit
- $4,280
Cash invested: $13,860 (down + closing). Projections, not guarantees.
Landlord ↔ Tenant lean methodology
- Overall (STATE)
- 90 Strongly Landlord-Friendly
- State Louisiana
- 90 Strongly Landlord-Friendly · R+12
- County
- — inherits STATE
- City
- — inherits STATE
ZIP-level market 70634
- Home prices YoY
- -30.6%
- Active inventory
- 241
- Price-to-rent
- 3.7×
Monthly cashflow live
- Estimated rent
- $1,126 medium interval (Pro) →
- Mortgage (P&I)
- −$260
- Tax est. 1.5%
- −$62 /mo · $742/yr
- Insurance
- −$21
- HOA
- −$0
- Vacancy / Maint / Mgmt
- −$237
- Net cashflow
- $548
Break-even live
UW: 25.0% down · 7.5% · 30yr · 1.5% tax · 5.0% vac · 8.0% maint · 8.0% mgmt
Financing live
Cash to close
- Down payment
- $12,375
- Closing costs
- $1,485
- Reserves months
- —
- Total cash needed
- —
Loan-product check · same deal, 3 products live
Conventional
25% down · 7.5% · 30yr
- Down + closing
- —
- Monthly P&I
- —
- Monthly cashflow
- —
- DSCR
- —
- Eligible?
- —
Personal DTI + credit; lowest rate.
DSCR
20% down · 8.5% · 30yr
- Down + closing
- —
- Monthly P&I
- —
- Monthly cashflow
- —
- DSCR
- —
- Eligible?
- —
No personal income docs; deal must DSCR.
Hard money
10% down · 12.0% · 12mo
- Down + closing
- —
- Monthly P&I
- —
- Monthly cashflow
- —
- DSCR
- —
- Eligible?
- —
Short-term bridge; refi at stabilization.
Rent comps 2 comps
| Address | Beds | Baths | Sqft | Rent | $/sqft | DOM | Units | Dist |
|---|---|---|---|---|---|---|---|---|
| 1014 W 9th St Deridder, LA | 3.0 | 2.0 | 1224 | $1,200 | $0.98 | 43d | 1 | 0.45mi |
| 124 Azalea Ave Deridder, LA | 3.0 | 2.0 | 1440 | $1,000 | $0.69 | 13d | 1 | 0.75mi |
Listing history 17 events
-
2026-06-19days on market $49,500 Active 23 DOM
-
2026-06-18days on market $49,500 Active 22 DOM
-
2026-06-17days on market $49,500 Active 21 DOM
-
2026-06-16days on market $49,500 Active 20 DOM
-
2026-06-15days on market $49,500 Active 19 DOM
-
2026-06-14days on market $49,500 Active 17 DOM
-
2026-06-13days on market $49,500 Active 16 DOM
-
2026-06-10days on market $49,500 Active 14 DOM
-
2026-06-09days on market $49,500 Active 13 DOM
-
2026-06-08days on market $49,500 Active 12 DOM
-
2026-06-07days on market $49,500 Active 11 DOM
-
2026-06-03days on market $49,500 Active 7 DOM
-
2026-06-02days on market $49,500 Active 6 DOM
-
2026-06-01days on market $49,500 Active 5 DOM
-
2026-05-31days on market $49,500 Active 4 DOM
-
2026-05-30days on market $49,500 Active 3 DOM
-
2026-05-27$49,500 Active
ⓘ Source: listings_history table (triggers on properties + properties_extension) + one-shot
backfill from property_details.listing_events for pre-trigger history.
Climate risk First Street
- Flood 1/10 Low FEMA zone X (unshaded) · 0% chance over 30 yrs
- Wildfire 2/10 Low
- Heat 8/10 Severe 7 d/yr ≥110°F today · 20 d/yr by 30 yrs out
- Wind 8/10 Severe 99% chance of damaging wind over 30 yrs
- Air quality 2/10 Low 1 unhealthy d/yr today · 1 by 30 yrs out
Nearby sold comps map
Loading sold comps map…
Walkable amenities ~0.75 mi
Loading nearby amenities…
Taxation est. · year 1
- Rental income
- $13,516
- − Mortgage interest
- −$2,773
- − Property taxes
- −$742
- − Insurance
- −$248
- − Repairs & maintenance
- −$1,081
- − Management
- −$1,081
- − Depreciation
- −$1,440
- Taxable income
- $6,151
- Est. tax owed @ 24.0%
- −$1,476
- After-tax cash flow
- $5,097/yr
For passive investors: Depreciation is non-cash, so a rental often shows a tax loss while cash-flowing — sheltering income. Rental losses are passive: they offset passive income freely, and up to $25,000/yr can offset ordinary (W-2) income if you actively participate and your MAGI is under $100k (phasing out to $0 by $150k); unused losses carry forward. On sale, claimed depreciation is recaptured at up to 25%, and gains may owe capital-gains tax (a 1031 exchange can defer both). Figures are a year-1 estimate at your 24.0% rate — not tax advice; consult a CPA.
Condition & rehab AI · 10 photos
This fixer upper requires moderate renovations to improve its condition and appeal to buyers. Key areas for improvement include the kitchen and bathroom, as well as the exterior and flooring.
Repairs flagged
- Major kitchen appliances — need replacement for functionality
- Major bathroom fixtures — need replacement for functionality
- Moderate exterior siding — visible wear and tear
- Minor interior walls — paint peeling in some areas
Value-add opportunities
- Resale update kitchen appliances — modern appliances attract buyers
- Resale replace bathroom fixtures — outdated fixtures deter buyers
- Both paint exterior — enhances curb appeal and resale value
- Both replace windows — better insulation and energy efficiency
- Both repair flooring — improves home's overall appearance and functionality
Renovation cost estimate screening
| Repair item | Severity | Est. cost |
|---|---|---|
| kitchen appliances · need replacement for functionality | Major | $15,000–50,000 |
| bathroom fixtures · need replacement for functionality | Major | $15,000–50,000 |
| exterior siding · visible wear and tear | Moderate | $3,000–15,000 |
| interior walls · paint peeling in some areas | Minor | $500–3,000 |
| Total estimated repair cost · 4 items | $33,500–118,000 |
Value-add ROI direction
- Resale update kitchen appliances — modern appliances attract buyers ↑
- Resale replace bathroom fixtures — outdated fixtures deter buyers ↑
- Both paint exterior — enhances curb appeal and resale value ↑
- Both replace windows — better insulation and energy efficiency ↑
- Both repair flooring — improves home's overall appearance and functionality ↑
ⓘ Cost ranges are severity-bucket heuristics (US national rule-of-thumb). Get contractor quotes + a written scope before underwriting a rehab budget.
Schools (NCES district)
- District
- Beauregard Parish
- NCES district ID
- 2200180
- Math proficiency
- 30% ▼ -40.00%
- Reading proficiency
- 41% ▼ -35.00%
- Median HH income
- $46,033
- Composite
- 30.34/100
- National rank
- #6265
- State rank
- #32 of 98 in LA
Livability — DeRidder
- Score
- 72/100
- State rank
- #43
- US rank
- #6227
Category grades
Schools grade is shown separately in the Schools card above.
Census & demographics
- Census place
- DeRidder, LA
- Population (ZIP)
- 25,038
Population outlook (Beauregard County) Hauer SSP2
- Today (2025)
- 37,760 people
- By 2030
- 38,140 · +1.0%
- By 2040
- 38,518 · +2.0%
- By 2050
- 38,164 · +1.1%
- By 2075
- 36,437 · -3.5%
- By 2100
- 32,493 · -13.9%
Race, ethnicity, and origin ACS 2023
- Neighborhood character
- Predominantly White (72%)
- Race & ethnicity
- White 72% Black 14% Two or more races 9% Hispanic / Latino 5% Asian 1%
- Hispanic origin (detail)
- Mexican 3% Puerto Rican 1%
- Common ancestry
- Lithuanian 6% Slovak 1% Italian 1%
- Foreign-born
- 2% · Canada
- Languages at home
- 96% English-only · Spanish 2% French/Haitian/Cajun 1%
Political lean MEDSL · Beauregard
- 2024 margin
- Solid R (+71.3) · D 13.8% · R 85.1% · Other 1.1%
- 2008→2024 swing
- -16.9pp toward R · 2008: -54.3pp · 2024: -71.3pp
- All cycles
- 2024: R+71.3 2020: R+67.5 2016: R+65.3 2012: R+58.2 2008: R+54.3
Not yet ingested
- Civics
- —
Market trends
- HPI YoY
- ▼ -57.61%
- Current HPI
- 130.4445
- Rent YoY
- —
- Metro
- —
- State GDP YoY
- ▲ 3.29%
- F500 in state
- 10
Industry mix (Fortune 500 HQ in LA)
| Industry | F500 HQs | Revenue |
|---|---|---|
| Telecommunications | 2 | $23B |
|
||
| Utilities | 1 | $12B |
|
||
| Wholesale / Distribution | 1 | $5B |
|
||
| Advertising | 1 | $2B |
|
||
Price history
1 event — show timeline
- 2026-05-27 Listed $49,500 GFPAR
Cash-flow waterfall
monthlySold comps — $/sqft
last 12 mo · ≤1 miLoading sold comps…